Pharmaceutical & Biotechnology Environment Monitoring Market Outlook:
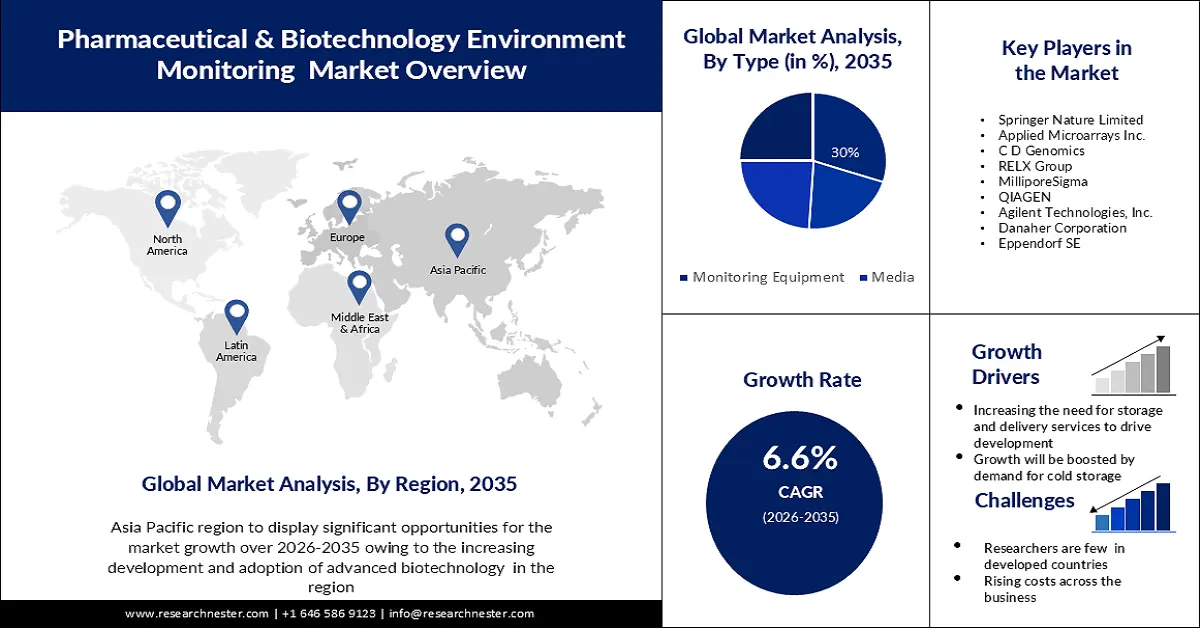
Pharmaceutical & Biotechnology Environment Monitoring Market size was valued at USD 1.23 billion in 2025 and is expected to reach USD 2.33 billion by 2035, registering around 6.6% CAGR during the forecast period i.e., between 2026-2035. In the year 2026, the industry size of pharmaceutical & biotechnology environment monitoring is assessed at USD 1.3 billion.
This market is anticipated to grow in the near future due to increased safety-related awareness among researchers in the pharmaceutical sector. Global biotechnology accounted for USD 266 billion in drug revenues in 2019, a figure that has been steadily growing for the past several years. It is projected to reach USD 505 billion by 2026, while the conventional drug market is expected to be worth USD 681 billion that same year.
With the adoption of modern technologies that have shown to be more efficient and economical, the pharmaceutical sector has undergone a significant transition. The expansion of this market has been positively affected by an increase in the flow of investment. Each year, the pharmaceutical sector as a whole invests more than USD 80 billion in research and development in the United States.
Key Pharmaceutical & Biotechnology Environment Monitoring Market Insights Summary:
Regional Insights:
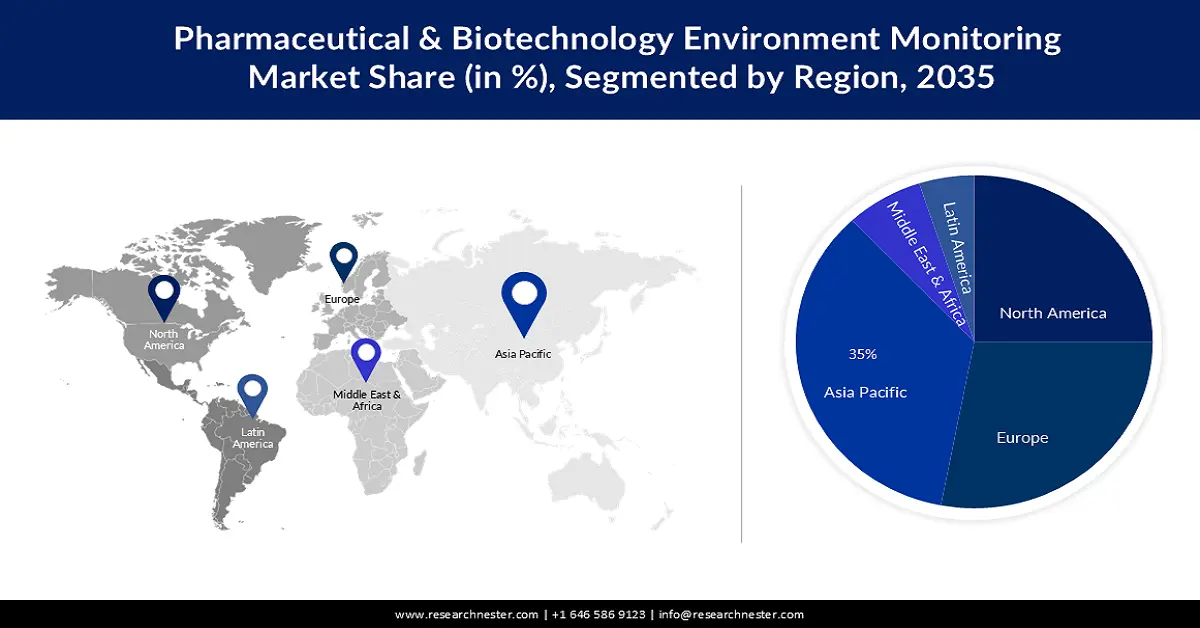
- The Asia Pacific region is anticipated to capture a 35% share by 2035 in the pharmaceutical & biotechnology environment monitoring market, spurred by the rapid adoption of advanced biotechnology and rising investment in regional biotech enterprises.
- Europe is expected to secure a 28% share by 2035, underpinned by strong demand for environmental monitoring platforms across major economies such as Germany, the United Kingdom, Italy, and France.
Segment Insights:
- The monitoring equipment segment in the pharmaceutical & biotechnology environment monitoring market is projected to attain a 30% share by 2035, propelled by the expanding need to measure critical parameters including particle counts, airflow, temperature, humidity, and microbiological contaminants.
- The academic & research institutes segment is forecasted to hold a 25% share by 2035, supported by rising investment in monitoring solutions required to meet stringent global safety and regulatory standards.
Key Growth Trends:
- Increasing Demand for Artificial Intelligence and Information Technology
- Rising Need for Cold Storage Solutions
Major Challenges:
- Concerns About Health and Safety Might Change Market Dynamics
- Researchers are Few in Undeveloped Countries
Key Players: Thermo Fisher Scientific Company, Springer Nature Limited, Applied Microarrays Inc., C D Genomics, RELX Group, MilliporeSigma, QIAGEN, Agilent Technologies, Inc., Danaher Corporation, Eppendorf SE.
Global Pharmaceutical & Biotechnology Environment Monitoring Market Forecast and Regional Outlook:
Market Size & Growth Projections:
- 2025 Market Size: USD 1.23 billion
- 2026 Market Size: USD 1.3 billion
- Projected Market Size: USD 2.33 billion by 2035
- Growth Forecasts: 6.6%
Key Regional Dynamics:
- Largest Region: Asia Pacific (35% Share by 2035)
- Fastest Growing Region: Asia Pacific
- Dominating Countries: United States, China, Germany, Japan, United Kingdom
- Emerging Countries: India, South Korea, Brazil, Singapore, Israel
Last updated on : 20 November, 2025
Pharmaceutical & Biotechnology Environment Monitoring Market - Growth Drivers and Challenges
Growth Drivers
-
Increasing Demand for Artificial Intelligence and Information Technology- The usage of cloud technology including private and public cloud, increased emphasis on the value of research and development, precision medicine, and other digital processes are about to undergo some dramatic developments in the pharmaceutical and biotechnology environment monitoring industry. The pharmaceutical and biotechnology industries may now work together with several different stakeholders for the same market thanks to cloud technology. According to a survey, 98% of all respondent businesses have a multi-cloud strategy in place or in development. Additionally, the cloud will host 82% of the workload.
-
Rising Need for Cold Storage Solutions- The pharmaceutical and biotechnology industries have benefited from R&D for the treatment of COVID-19 since the primary vaccine developed required a safe cold storage solution service. The necessity for cold chain services to assist in the monitoring and transportation of the vaccinations and other pertinent goods to their destination was great.
- Increasing Requirement for Storage and Delivery Services- The delivery of goods by sea and air is another factor boosting the development of this industry. Such a need can be seen as a result of lower long-term average ocean and air freight costs, which may be coupled with an increase in demand from biologics, temperature-sensitive pharmaceuticals, and other protein segments.
Challenges-
-
Concerns About Health and Safety Might Change Market Dynamics- In the pharmaceutical and biotechnology industries, health and safety are crucial for long-term viability and increased output. Biological and chemical risks, which have been shown to represent a major threat to those working in these settings, are mostly exposed in this business. Along with this, a lack of safety regulations and non-compliance may affect employee productivity and, in the long run, have an adverse effect on the expansion of the organization.
-
Researchers are Few in Undeveloped Countries
- Rising Costs Across the Business
Pharmaceutical & Biotechnology Environment Monitoring Market Size and Forecast:
| Report Attribute | Details |
|---|---|
|
Base Year |
2025 |
|
Forecast Year |
2026-2035 |
|
CAGR |
6.6% |
|
Base Year Market Size (2025) |
USD 1.23 billion |
|
Forecast Year Market Size (2035) |
USD 2.33 billion |
|
Regional Scope |
|
Pharmaceutical & Biotechnology Environment Monitoring Market Segmentation:
Type Segment Analysis
The monitoring equipment segment in the pharmaceutical & biotechnology environment monitoring market is anticipated to have the largest revenue with a 30% share in the upcoming years. Environmental monitoring parameters for the pharmaceutical and biotechnology industries are tracked using monitoring equipment. A few of them are airflow analysis, particle counters for air emissions, temperature, humidity, and pressure monitors. Microbiology tools like Bioburden Testing (Bacillus count), Endotoxin Testing (LAL assay), and Mycoplasma Detection Test Instruments are within the category of monitoring equipment. Instruments for counting particles, such as photometer-based contamination detectors and laser scattering detectors, etc.
End-User Segment Analysis
The academic & research institutes are set to have a 25% of the global pharmaceutical & biotechnology environment monitoring market share. Multiple layers of pharmaceutical and biotechnological research necessitate the monitoring of diverse environmental variables. The pH, which has a direct impact on the majority of biochemical activities taking place in laboratories or industrial facilities, is one such crucial parameter that has to be monitored. Additionally, as researchers become more aware of safety issues, stricter regulatory guidelines are applied to them globally. As a result, many universities around the world are forced to make significant investments in pharmaceutical and biotechnological equipment and services.
Our in-depth analysis of the global market includes the following segments:
|
Type |
|
|
End - User |
|

Vishnu Nair
Head - Global Business DevelopmentCustomize this report to your requirements — connect with our consultant for personalized insights and options.
Pharmaceutical & Biotechnology Environment Monitoring Market - Regional Analysis
APAC Market Insights
Asia Pacific industry is predicted to hold largest revenue share of 35% by 2035. On the back of increasing development and adoption of advanced biotechnology in developing countries, including India, China, and Japan, the market in the Asia Pacific region is projected to experience noteworthy growth over the forecast period. Due to economic growth and government initiatives aimed at energy conservation, the Asia Pacific region is expected to have one of the fastest-growing markets during the anticipated timeframe. This will result in a huge demand for micro-biological solutions across numerous industries, including pharmaceuticals and biotechnology. Additionally, growing investment in biotech startups is anticipated to further accelerate market expansion. Around 2,500 biotech enterprises were founded in India, according to studies. In 2019, the Indian biotechnology market was worth USD 63 billion.
European Market Insights
Over the course of the estimate, Europe is poised to have the second-largest market with a 28% share in this sector. Countries such as the United Kingdom, Germany, Italy, and France have strong demand for environmental monitoring services such as environmental intelligence platform, and others. With the greatest market value of about USD 83,725 million, Germany emerged as the leader, and it is projected to drive the elevate the market’s growth in the region.
Pharmaceutical & Biotechnology Environment Monitoring Market Players:
- Thermo Fisher Scientific Company
- Company Overview
- Business Strategy
- Key Product Offerings
- Financial Performance
- Key Performance Indicators
- Risk Analysis
- Recent Development
- Regional Presence
- SWOT Analysis
- Springer Nature Limited
- Applied Microarrays Inc.
- C D Genomics
- RELX Group
- MilliporeSigma
- QIAGEN
- Agilent Technologies, Inc.
- Danaher Corporation
- Eppendorf SE
Recent Developments
- Danaher Corporation, the leading global science and medical technology innovator, announced the completion of its acquisition of Aldevron.
- CD Genomic slaunched the low-coverage sequencing which can effectively identify novel variants in the genomic databases.
- Report ID: 3931
- Published Date: Nov 20, 2025
- Report Format: PDF, PPT
- Explore a preview of key market trends and insights
- Review sample data tables and segment breakdowns
- Experience the quality of our visual data representations
- Evaluate our report structure and research methodology
- Get a glimpse of competitive landscape analysis
- Understand how regional forecasts are presented
- Assess the depth of company profiling and benchmarking
- Preview how actionable insights can support your strategy
Explore real data and analysis
Frequently Asked Questions (FAQ)
About this Report
Connect with our Expert

Report, 2026-2035


Copyright @ 2026 Research Nester. All Rights Reserved.
