Managed Services Market Outlook:
Managed Services Market size was valued at USD 380.33 billion in 2025 and is likely to cross USD 1.27 trillion by 2035, registering more than 12.8% CAGR during the forecast period i.e., between 2026-2035. In the year 2026, the industry size of managed services is estimated at USD 424.14 billion.
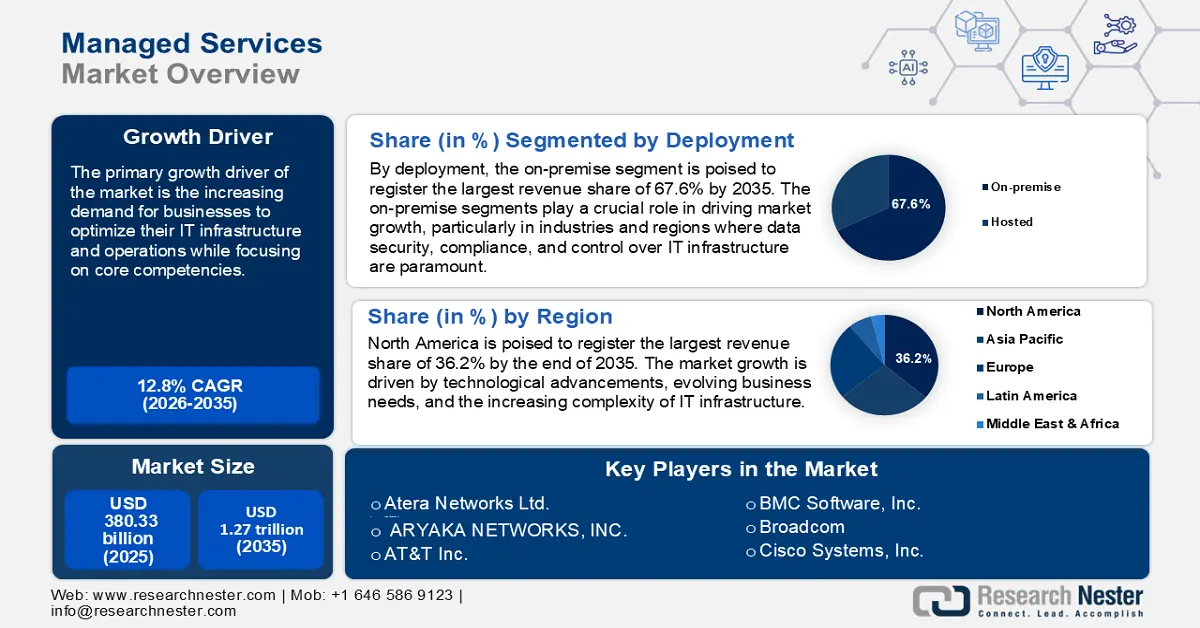
The primary growth driver of the managed services market is the increasing demand for businesses to optimize their IT infrastructure and operations while focusing on core competencies. Businesses seek to reduce IT operational costs by outsourcing tasks like network management, cybersecurity, and cloud operations to managed service providers (MSPs). Managed services help organizations transition from capital expenditures (CapEx) to predictable operational expenditures (OpEx), improving budget planning.
Moreover, the shift to cloud-based solutions is driving the need for managed cloud services, including migration, maintenance, and optimization. As of May 2024, about 94% of all companies across the world use cloud computing in their operations. Enterprises require MSPs to manage multi-cloud and hybrid environments for seamless integration and scalability. MSPs play a key role in supporting the deployment and management of emerging technologies like IoT, AI, and edge computing.
Key Managed Services Market Insights Summary:
Regional Highlights:
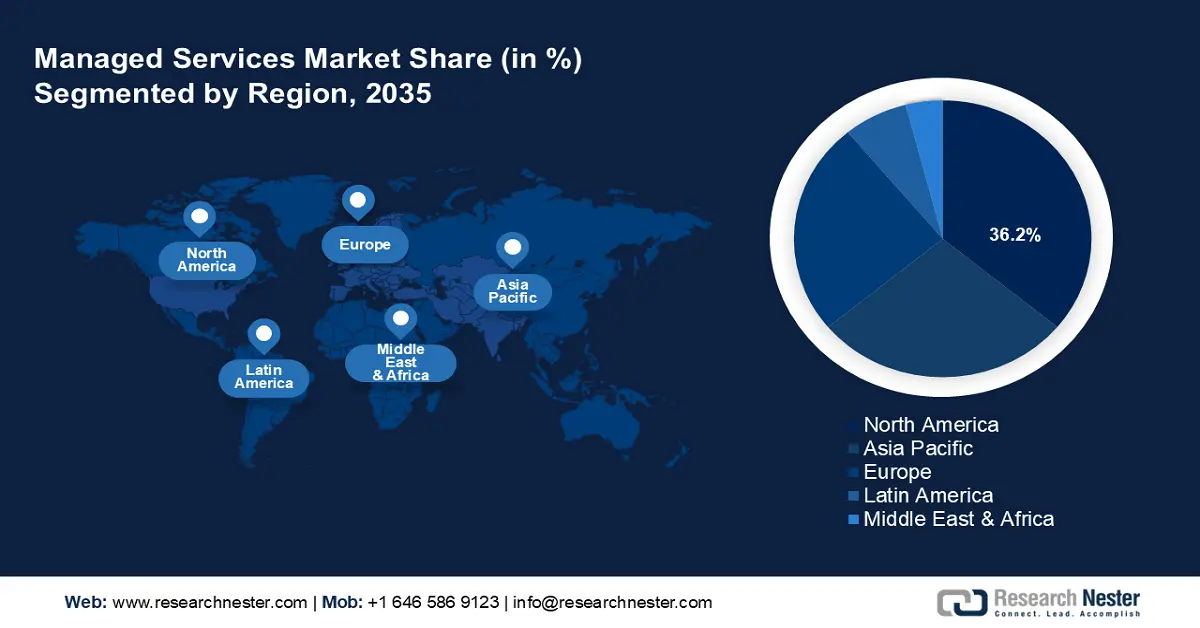
- North America commands a 36.2% share of the Managed Services Market, driven by technological advancements, evolving business needs, and increasing complexity of IT infrastructure, ensuring market leadership through 2026–2035.
- Asia Pacific’s managed services market is anticipated to grow rapidly by 2035, driven by increasing digital transformation and rising adoption of cloud computing.
Segment Insights:
- The On-Premise segment is anticipated to hold more than 67.6% market share by 2035, driven by data security needs and compliance in regulated industries.
- The Large Enterprises segment of the Managed Services Market is expected to capture a 60% share by 2035, fueled by the need for scalable IT and managed security services.
Key Growth Trends:
- Rising cybersecurity concerns
- Growth of the Internet of Things (IoT) and edge computing
Major Challenges:
- High initial setup costs
- Lack of awareness and expertise among businesses
- Key Players: Atera Networks Ltd., Allegro MicroSystems, Inc., ARYAKA NETWORKS, INC., AT&T Inc., BMC Software, Inc., Broadcom, Cisco Systems, Inc..
Global Managed Services Market Forecast and Regional Outlook:
Market Size & Growth Projections:
- 2025 Market Size: USD 380.33 billion
- 2026 Market Size: USD 424.14 billion
- Projected Market Size: USD 1.27 trillion by 2035
- Growth Forecasts: 12.8% CAGR (2026-2035)
Key Regional Dynamics:
- Largest Region: North America (36.2% Share by 2035)
- Fastest Growing Region: Asia Pacific
- Dominating Countries: United States, Canada, United Kingdom, Germany, Japan
- Emerging Countries: China, India, Japan, South Korea, Singapore
Last updated on : 14 August, 2025
Managed Services Market Growth Drivers and Challenges:
Growth Drivers
-
Rising cybersecurity concerns: Common cyber threats like malware, phishing, ransomware, and advanced persistent threats (APTs) have escalated, making it essential for businesses to enhance their cybersecurity defenses. Cybersecurity statistics show that there are 2,200 cyberattacks every day, with one occurring every 39 seconds on average. In the U.S., a data breach costs an average of USD 9.44 million, with cybercrime costing USD 8 trillion as of 2023. High-profile cyberattacks, such as the WannaCry ransomware attack and data breaches at major corporations, have heightened awareness about the importance of robust cybersecurity measures. As a result, organizations are looking for managed service providers, offering 24/7 threat detection, vulnerability assessments, and incident response.
Organizations must comply with various data privacy regulations (e.g., GDPR, HIPAA, CCPA) that require them to implement robust security measures to protect sensitive data. Managed services help businesses meet these compliance requirements by ensuring necessary security protocols, tools, and audits are in place. - Growth of the Internet of Things (IoT) and edge computing: There were 16.6 billion connected IoT devices by the end of 2023 (a growth of 15% over 2022). IoT generates vast amounts of data and requires sophisticated management to ensure functionality, efficiency, and security.
The proliferation of IoT devices and edge computing increases the complexity of IT environments, making businesses turn to MSPs for monitoring and management. MSPs offer expertise in managing large-scale IoT and edge computing infrastructures, ensuring optimal performance and security. Moreover, edge computing is critical for processing data locally, reducing latency, and improving real-time decision-making for IoT applications. - Increased focus on digital transformation: As businesses move towards digital transformation, managed services provide the IT support necessary for the successful deployment of new technologies like AI, machine learning, and automation. Managed services enable companies to leverage these technologies without needing large in-house IT teams.
Additionally, the rising shift to remote work, accelerated by the COVID-10 pandemic, is a key aspect of digital transformation. Businesses require MSPs to ensure secure, reliable remote access and collaboration tools. According to a 2024 report, published by the World Economic Forum, by 2030, the number of worldwide digital jobs that can be performed remotely from anywhere is predicted to increase by around 25%, reaching approximately 92 million.
Challenges
-
High initial setup costs: Organizations may face high upfront costs for implementing managed services, especially in transitioning from legacy systems to cloud-based or modern infrastructures. Tailored managed services often require additional customization, which increases initial costs. This can discourage small and medium-sized enterprises (SMEs) with limited budgets from adopting managed services.
- Lack of awareness and expertise among businesses: Many organizations, particularly SMEs, lack understanding of the benefits and capabilities of managed services. A preference for traditional in-house IT management or reluctance to adopt new service models can hinder market penetration. Lack of awareness reduces the potential customer base, especially in emerging managed services markets.
Managed Services Market Size and Forecast:
| Report Attribute | Details |
|---|---|
|
Base Year |
2025 |
|
Forecast Period |
2026-2035 |
|
CAGR |
12.8% |
|
Base Year Market Size (2025) |
USD 380.33 billion |
|
Forecast Year Market Size (2035) |
USD 1.27 trillion |
|
Regional Scope |
|
Managed Services Market Segmentation:
Deployment (On-Premise and Hosted)
By 2035, on-premise segment is set to hold managed services market share of more than 67.6%. The on-premise segments play a crucial role in driving market growth, particularly in industries and regions where data security, compliance, and control over IT infrastructure are paramount. Industries like finance, healthcare, and government often require sensitive data to be stored and managed on-premise to comply with stringent local regulations. On-premise solutions allow organizations to maintain complete control over their security protocols, reducing vulnerabilities associated with cloud environments.
The on-premise segment remains significant, particularly in regions like Asia Pacific, including Japan, where regulatory compliance and data sovereignty are prioritized. While cloud adoption is growing, the on-premise managed services market segment is expected to continue growing at a steady pace due to its relevance in critical and regulated industries.
Enterprise Size [Small & Medium Enterprises (SMEs) and Large Enterprises]
By enterprise size, the large enterprises segment is poised to register a profitable revenue share in managed services market during the forecast period. Large enterprises operate across multiple geographies and industries, requiring scalable IT solutions to manage diverse operations. These organizations are frequent targets of cyberattacks, prompting them to invest in managed security services to safeguard sensitive information. Large enterprises account for 60% of the total managed IT services share.
Moreover, large organizations are increasingly adopting hybrid and multi-cloud environments, requiring expert management from MSPs. Over 70% of large enterprises globally are expected to adopt hybrid cloud solutions by 2025, with managed services playing a central role in managing these environments.
Our in-depth analysis of the managed services market includes the following segments:
|
Solution |
|
|
Managed Information Service (MIS) |
|
|
Deployment |
|
|
Enterprise Size |
|
|
End use |
|

Vishnu Nair
Head - Global Business DevelopmentCustomize this report to your requirements — connect with our consultant for personalized insights and options.
Managed Services Market Regional Analysis:
North America Market Forecast
North America industry is poised to dominate majority revenue share of 36.2% by 2035. The managed services market growth is driven by technological advancements, evolving business needs, and the increasing complexity of IT infrastructure. Businesses in the region are rapidly migrating to cloud environments, including hybrid and multi-cloud models, to enhance scalability and flexibility. MSPs play a vital role in managing, optimizing, and securing these cloud environments.
In the U.S. companies are increasingly adopting hybrid and multi-cloud environments, requiring expert management from MSPs. Over 65% of enterprises in the country utilize managed cloud services for operations. The country also experiences a high volume of cyberattacks, prompting businesses to outsource cybersecurity management. Laws like HIPAA, CCPA, and SOX mandate strict security compliance, encouraging firms to partner with MSPs.
Businesses in Canada are increasingly incorporating AI, machine learning, and IoT solutions into their operations, requiring managed services for integration, management, and security. Many local enterprises are investing in digital transformation to stay competitive, leveraging MSPs for services such as cloud computing, infrastructure management, and data analytics. Canadian laws like the Personal Information Protection and Electronic Documents Act (PIPEDA) are encouraging organizations to outsource cybersecurity and compliance management to MSPs.
APAC Market Analysis
The managed services market of Asia Pacific is poised to register the fastest revenue growth by 2035. The growth of the market is driven by increasing digital transformation, rising adoption of cloud computing, and the expansion of small and medium-sized enterprises. As businesses in the region adapt to technological advancements, the demand for managed IT services is surging.
In China, several companies are launching and expanding their managed services offerings to capitalize on the rapidly growing market. For instance, in July 2021, Acquia, a digital experience firm, introduced its new China Managed Services offering, which provides digital experiences to local consumers through the country's premier managed Drupal service. Multinational enterprises can benefit from Acquia's world-class support and Drupal expertise while operating in China.
The managed services market in India is poised for robust growth, driven by digital transformation, SME expansion, and rising cybersecurity needs. With strong government initiatives like Digital India and the adoption of advanced technologies such as AI, IoT, and 5G, the market will continue to expand. Both domestic and global players are well-positioned to capitalize on the growing demand for cost-effective and scalable IT solutions.
Key Managed Services Market Players:
- Accenture
- Company Overview
- Business Strategy
- Key Product Offerings
- Financial Performance
- Key Performance Indicators
- Risk Analysis
- Recent Development
- Regional Presence
- SWOT Analysis
- Atera Networks Ltd.
- ARYAKA NETWORKS, INC.
- AT&T Inc.
- BMC Software, Inc.
- Broadcom
- Cisco Systems, Inc.
- Logicalis Group
- MSP Corp
- DXC Technology Company
- International Business Machines Corporation
- ScalePad Software Inc.
Key players offer a wide range of services, including cloud management, cybersecurity, IT infrastructure, and network management. These companies are investing in AI, automation, and tailored solutions to cater to diverse industries.
Here are some key players in the managed services market:
Recent Developments
- In September 2023, Logicalis, a worldwide technology service provider that offers next-generation digital managed services, announced the launch of Intelligent Connectivity powered by Cisco, a suite of solutions that includes Private 5G, SD-WAN, SASE, SSE, SD-Access, and ACI Data Centre.
- In May 2023, Alfar Capital and Walter Capital Partners completed the acquisition of MSP Corp, a prominent Canadian managed service provider group, for more than $100 million. Following the acquisition, MSP Corp will merge with Groupe Access, a prominent managed service provider for technology and cybersecurity solutions. The combined entity, MSP Corp, creates a national Canadian managed services platform that is prepared to lead the industry in digital transformation, cloud computing, and cybersecurity.
- Report ID: 6742
- Published Date: Aug 14, 2025
- Report Format: PDF, PPT
- Explore a preview of key market trends and insights
- Review sample data tables and segment breakdowns
- Experience the quality of our visual data representations
- Evaluate our report structure and research methodology
- Get a glimpse of competitive landscape analysis
- Understand how regional forecasts are presented
- Assess the depth of company profiling and benchmarking
- Preview how actionable insights can support your strategy
Explore real data and analysis
Frequently Asked Questions (FAQ)
Managed Services Market Report Scope
Free Sample includes current and historical market size, growth trends, regional charts & tables, company profiles, segment-wise forecasts, and more.
Connect with our Expert


Copyright @ 2026 Research Nester. All Rights Reserved.
