Global Solid Oxide Fuel Cell Market
1. An Outline of the Global Solid Oxide Fuel Cell Market
1.1. Market Definition and Segmentation
1.2. Study Assumptions and Abbreviations
2. Research Methodology & Approach
2.1. Primary Research
2.2. Secondary Research
2.3. Data Triangulation
2.4. SPSS Methodology
3. Executive Summary
4. Growth Drivers
5. Major Roadblocks
6. Opportunities
7. Prevalent Trends
8. Government Regulation
9. Growth Outlook
10. Competitive White Space Analysis – Identifying Untapped Market Gaps
11. Risk Overview
12. SWOT
13. Technological Advancement
14. Technology Maturity Matrix for the Solid Oxide Fuel Cell Market: Recent News
15. Regional Demand
16. Global Solid Oxide Fuel Cell by Geography – Strategic Comparative Analysis
17. Strategic Segment Analysis: Solid Oxide Fuel Cell Demand Landscape
18. Solid Oxide Fuel Cell Demand Trends Driven by the expansion of hydrogen production & storage infrastructure, and continuous technological innovations. (2027-2036)
19. Root Cause Analysis (RCA) for discovering problems of the Solid Oxide Fuel Cell Market
20. Porter Five Forces
21. PESTLE
22. Comparative Positioning
23. Global Solid Oxide Fuel Cell – Key Player Analysis (2036)
24. Competitive Landscape: Key Suppliers/Players
25. Competitive Model: A Detailed Inside View for Investors
26. Company Market Share, 2036 (%)
26.1. Bloom Energy
26.2. Ceres Power Holdings plc
26.3. Doosan Fuel Cell Co., Ltd.
26.4. Elcogen
26.5. H2E Power
26.6. KYOCERA Corporation
26.7. Lentatek Uzay Havacılık ve Teknoloji A.Ş
26.8. Mitsubishi Heavy Industries, Ltd.
26.9. Ningbo VET Energy Technology Co., Ltd
26.10. SolydEra GmbH
26.11. Taiyo Yuden Co., Ltd.
26.12. WATT Fuel Cell
26.13. Delta Electronics, Inc.
27. Global Solid Oxide Fuel Cell Market Outlook
27.1. Market Overview
27.1.1. Market Revenue by Value (USD Million) and Compound Annual Growth Rate (CAGR)
27.2. Solid Oxide Fuel Cell Market Segmentation Analysis (2027-2036)
27.2.1. By Type
27.2.1.1. Planar, Market Value (USD Million), and CAGR, 2027-2036F
27.2.1.2. Tubular, Market Value (USD Million), and CAGR, 2027-2036F
27.2.2. By Mobility
27.2.2.1. Stationary, Market Value (USD Million), and CAGR, 2027-2036F
27.2.2.2. Portable, Market Value (USD Million), and CAGR, 2027-2036F
27.2.3. By Application
27.2.3.1. Combined Heat & Power, Market Value (USD Million), and CAGR, 2027-2036F
27.2.3.2. Power Generation, Market Value (USD Million), and CAGR, 2027-2036F
27.2.3.3. Others, Market Value (USD Million), and CAGR, 2027-2036F
27.2.4. By End user
27.2.4.1. Data Centers, Market Value (USD Million), and CAGR, 2027-2036F
27.2.4.2. Commercial & Retail, Market Value (USD Million), and CAGR, 2027-2036F
27.2.4.3. Residential, Market Value (USD Million), and CAGR, 2027-2036F
27.2.4.4. Others, Market Value (USD Million), and CAGR, 2027-2036F
27.2.5. Regional Synopsis, Value (USD Million), 2027-2036
27.2.5.1. North America Market Value (USD Million) and CAGR & Y-o-Y Growth Trend, 2027-2036F
27.2.5.2. Europe Market Value (USD Million) and CAGR & Y-o-Y Growth Trend, 2027-2036F
27.2.5.3. Asia Pacific, excluding Japan Market Value (USD Million) and CAGR & Y-o-Y Growth Trend, 2027-2036F
27.2.5.4. Latin America Market Value (USD Million) and CAGR & Y-o-Y Growth Trend, 2027-2036F
27.2.5.5. Middle East and Africa Market Value (USD Million) and CAGR & Y-o-Y Growth Trend, 2027-2036F
28. North America Market
28.1. Overview
28.1.1. Market Value (USD Million), Current and Future Projections, 2027-2036
28.1.2. Increment $ Opportunity Assessment, 2027-2036
28.2. Segmentation (USD Million), 2027-2036, By
28.2.1. By Type
28.2.1.1. Planar, Market Value (USD Million), and CAGR, 2027-2036F
28.2.1.2. Tubular, Market Value (USD Million), and CAGR, 2027-2036F
28.2.2. By Mobility
28.2.2.1. Stationary, Market Value (USD Million), and CAGR, 2027-2036F
28.2.2.2. Portable, Market Value (USD Million), and CAGR, 2027-2036F
28.2.3. By Application
28.2.3.1. Combined Heat & Power, Market Value (USD Million), and CAGR, 2027-2036F
28.2.3.2. Power Generation, Market Value (USD Million), and CAGR, 2027-2036F
28.2.3.3. Others, Market Value (USD Million), and CAGR, 2027-2036F
28.2.4. By End user
28.2.4.1. Data Centers, Market Value (USD Million), and CAGR, 2027-2036F
28.2.4.2. Commercial & Retail, Market Value (USD Million), and CAGR, 2027-2036F
28.2.4.3. Residential, Market Value (USD Million), and CAGR, 2027-2036F
28.2.4.4. Others, Market Value (USD Million), and CAGR, 2027-2036F
28.2.5. Country Level Analysis, Value (USD Million)
28.2.5.1. U.S. Market Value (USD Million) and CAGR & Y-o-Y Growth Trend, 2027-2036F
28.2.5.2. Canada Market Value (USD Million) and CAGR & Y-o-Y Growth Trend, 2027-2036F
29. Europe Market
29.1. Overview
29.1.1. Market Value (USD Million), Current and Future Projections, 2027-2036
29.1.2. Increment $ Opportunity Assessment, 2027-2036
29.2. Segmentation (USD Million), 2027-2036, By
29.2.1. By Type
29.2.1.1. Planar, Market Value (USD Million), and CAGR, 2027-2036F
29.2.1.2. Tubular, Market Value (USD Million), and CAGR, 2027-2036F
29.2.2. By Mobility
29.2.2.1. Stationary, Market Value (USD Million), and CAGR, 2027-2036F
29.2.2.2. Portable, Market Value (USD Million), and CAGR, 2027-2036F
29.2.3. By Application
29.2.3.1. Combined Heat & Power, Market Value (USD Million), and CAGR, 2027-2036F
29.2.3.2. Power Generation, Market Value (USD Million), and CAGR, 2027-2036F
29.2.3.3. Others, Market Value (USD Million), and CAGR, 2027-2036F
29.2.4. By End user
29.2.4.1. Data Centers, Market Value (USD Million), and CAGR, 2027-2036F
29.2.4.2. Commercial & Retail, Market Value (USD Million), and CAGR, 2027-2036F
29.2.4.3. Residential, Market Value (USD Million), and CAGR, 2027-2036F
29.2.4.4. Others, Market Value (USD Million), and CAGR, 2027-2036F
29.2.5. Country Level Analysis, Value (USD Million)
29.2.5.1. UK Market Value (USD Million) and CAGR & Y-o-Y Growth Trend, 2027-2036F
29.2.5.2. Germany Market Value (USD Million) and CAGR & Y-o-Y Growth Trend, 2027-2036F
29.2.5.3. France Market Value (USD Million) and CAGR & Y-o-Y Growth Trend, 2027-2036F
29.2.5.4. Italy Market Value (USD Million) and CAGR & Y-o-Y Growth Trend, 2027-2036F
29.2.5.5. Spain Market Value (USD Million) and CAGR & Y-o-Y Growth Trend, 2027-2036F
29.2.5.6. Netherlands Market Value (USD Million) and CAGR & Y-o-Y Growth Trend, 2027-2036F
29.2.5.7. Russia Market Value (USD Million) and CAGR & Y-o-Y Growth Trend, 2027-2036F
29.2.5.8. Switzerland Market Value (USD Million) and CAGR & Y-o-Y Growth Trend, 2027-2036F
29.2.5.9. Poland Market Value (USD Million) and CAGR & Y-o-Y Growth Trend, 2027-2036F
29.2.5.10. Belgium Market Value (USD Million) and CAGR & Y-o-Y Growth Trend, 2027-2036F
29.2.5.11. Rest of Europe Market Value (USD Million) and CAGR & Y-o-Y Growth Trend, 2027-2036F
30. Asia Pacific Market
30.1. Overview
30.1.1. Market Value (USD Million), Current and Future Projections, 2027-2036
30.1.2. Increment $ Opportunity Assessment, 2027-2036
30.2. Segmentation (USD Million), 2027-2036, By
30.2.1. By Type
30.2.1.1. Planar, Market Value (USD Million), and CAGR, 2027-2036F
30.2.1.2. Tubular, Market Value (USD Million), and CAGR, 2027-2036F
30.2.2. By Mobility
30.2.2.1. Stationary, Market Value (USD Million), and CAGR, 2027-2036F
30.2.2.2. Portable, Market Value (USD Million), and CAGR, 2027-2036F
30.2.3. By Application
30.2.3.1. Combined Heat & Power, Market Value (USD Million), and CAGR, 2027-2036F
30.2.3.2. Power Generation, Market Value (USD Million), and CAGR, 2027-2036F
30.2.3.3. Others, Market Value (USD Million), and CAGR, 2027-2036F
30.2.4. By End user
30.2.4.1. Data Centers, Market Value (USD Million), and CAGR, 2027-2036F
30.2.4.2. Commercial & Retail, Market Value (USD Million), and CAGR, 2027-2036F
30.2.4.3. Residential, Market Value (USD Million), and CAGR, 2027-2036F
30.2.4.4. Others, Market Value (USD Million), and CAGR, 2027-2036F
30.2.5. Country Level Analysis, Value (USD Million)
30.2.5.1. China Market Value (USD Million) and CAGR & Y-o-Y Growth Trend, 2027-2036F
30.2.5.2. Japan Market Value (USD Million) and CAGR & Y-o-Y Growth Trend, 2027-2036F
30.2.5.3. India Market Value (USD Million) and CAGR & Y-o-Y Growth Trend, 2027-2036F
30.2.5.4. South Korea Market Value (USD Million) and CAGR & Y-o-Y Growth Trend, 2027-2036F
30.2.5.5. Australia Market Value (USD Million) and CAGR & Y-o-Y Growth Trend, 2027-2036F
30.2.5.6. Indonesia Market Value (USD Million) and CAGR & Y-o-Y Growth Trend, 2027-2036F
30.2.5.7. Malaysia Market Value (USD Million) and CAGR & Y-o-Y Growth Trend, 2027-2036F
30.2.5.8. Vietnam Market Value (USD Million) and CAGR & Y-o-Y Growth Trend, 2027-2036F
30.2.5.9. Thailand Market Value (USD Million) and CAGR & Y-o-Y Growth Trend, 2027-2036F
30.2.5.10. Singapore Market Value (USD Million) and CAGR & Y-o-Y Growth Trend, 2027-2036F
30.2.5.11. New Zealand Market Value (USD Million) and CAGR & Y-o-Y Growth Trend, 2027-2036F
30.2.5.12. Rest of Asia Pacific Excluding Japan Market Value (USD Million) and CAGR & Y-o-Y Growth Trend, 2027-2036F
31. Latin America Market
31.1. Overview
31.1.1. Market Value (USD Million), Current and Future Projections, 2027-2036
31.1.2. Increment $ Opportunity Assessment, 2027-2036
31.1.3. Year-on-Year Growth Forecast (%)
31.2. Segmentation (USD Million), 2027-2036, By
31.2.1. By Type
31.2.1.1. Planar, Market Value (USD Million), and CAGR, 2027-2036F
31.2.1.2. Tubular, Market Value (USD Million), and CAGR, 2027-2036F
31.2.2. By Mobility
31.2.2.1. Stationary, Market Value (USD Million), and CAGR, 2027-2036F
31.2.2.2. Portable, Market Value (USD Million), and CAGR, 2027-2036F
31.2.3. By Application
31.2.3.1. Combined Heat & Power, Market Value (USD Million), and CAGR, 2027-2036F
31.2.3.2. Power Generation, Market Value (USD Million), and CAGR, 2027-2036F
31.2.3.3. Others, Market Value (USD Million), and CAGR, 2027-2036F
31.2.4. By End user
31.2.4.1. Data Centers, Market Value (USD Million), and CAGR, 2027-2036F
31.2.4.2. Commercial & Retail, Market Value (USD Million), and CAGR, 2027-2036F
31.2.4.3. Residential, Market Value (USD Million), and CAGR, 2027-2036F
31.2.4.4. Others, Market Value (USD Million), and CAGR, 2027-2036F
31.2.5. Country Level Analysis, Value (USD Million)
31.2.5.1. Brazil Market Value (USD Million) and CAGR & Y-o-Y Growth Trend, 2027-2036F
31.2.5.2. Argentina Market Value (USD Million) and CAGR & Y-o-Y Growth Trend, 2027-2036F
31.2.5.3. Mexico Market Value (USD Million) and CAGR & Y-o-Y Growth Trend, 2027-2036F
31.2.5.4. Rest of Latin America Market Value (USD Million) and CAGR & Y-o-Y Growth Trend, 2027-2036F
32. Middle East & Africa Market
32.1. Overview
32.1.1. Market Value (USD Million), Current and Future Projections, 2027-2036
32.1.2. Increment $ Opportunity Assessment, 2027-2036
32.1.3. Year-on-Year Growth Forecast (%)
32.2. Segmentation (USD Million), 2027-2036, By
32.2.1. By Type
32.2.1.1. Planar, Market Value (USD Million), and CAGR, 2027-2036F
32.2.1.2. Tubular, Market Value (USD Million), and CAGR, 2027-2036F
32.2.2. By Mobility
32.2.2.1. Stationary, Market Value (USD Million), and CAGR, 2027-2036F
32.2.2.2. Portable, Market Value (USD Million), and CAGR, 2027-2036F
32.2.3. By Application
32.2.3.1. Combined Heat & Power, Market Value (USD Million), and CAGR, 2027-2036F
32.2.3.2. Power Generation, Market Value (USD Million), and CAGR, 2027-2036F
32.2.3.3. Others, Market Value (USD Million), and CAGR, 2027-2036F
32.2.4. By End user
32.2.4.1. Data Centers, Market Value (USD Million), and CAGR, 2027-2036F
32.2.4.2. Commercial & Retail, Market Value (USD Million), and CAGR, 2027-2036F
32.2.4.3. Residential, Market Value (USD Million), and CAGR, 2027-2036F
32.2.4.4. Others, Market Value (USD Million), and CAGR, 2027-2036F
32.2.5. Country Level Analysis, Value (USD Million)
32.2.5.1. Saudi Arabia Market Value (USD Million) and CAGR & Y-o-Y Growth Trend, 2027-2036F
32.2.5.2. UAE Market Value (USD Million) and CAGR & Y-o-Y Growth Trend, 2027-2036F
32.2.5.3. Israel Market Value (USD Million) and CAGR & Y-o-Y Growth Trend, 2027-2036F
32.2.5.4. Qatar Market Value (USD Million) and CAGR & Y-o-Y Growth Trend, 2027-2036F
32.2.5.5. Kuwait Market Value (USD Million) and CAGR & Y-o-Y Growth Trend, 2027-2036F
32.2.5.6. Oman Market Value (USD Million) and CAGR & Y-o-Y Growth Trend, 2027-2036F
32.2.5.7. South Africa Market Value (USD Million) and CAGR & Y-o-Y Growth Trend, 2027-2036F
32.2.5.8. Rest of Middle East & Africa Market Value (USD Million) and CAGR & Y-o-Y Growth Trend, 2027-2036F
33. Global Economic Scenario
33.1. World Economic Outlook
34. About Research Nester
34.1. Our Global Clientele
34.2. We Serve Clients Across World
Solid Oxide Fuel Cell Market Outlook:
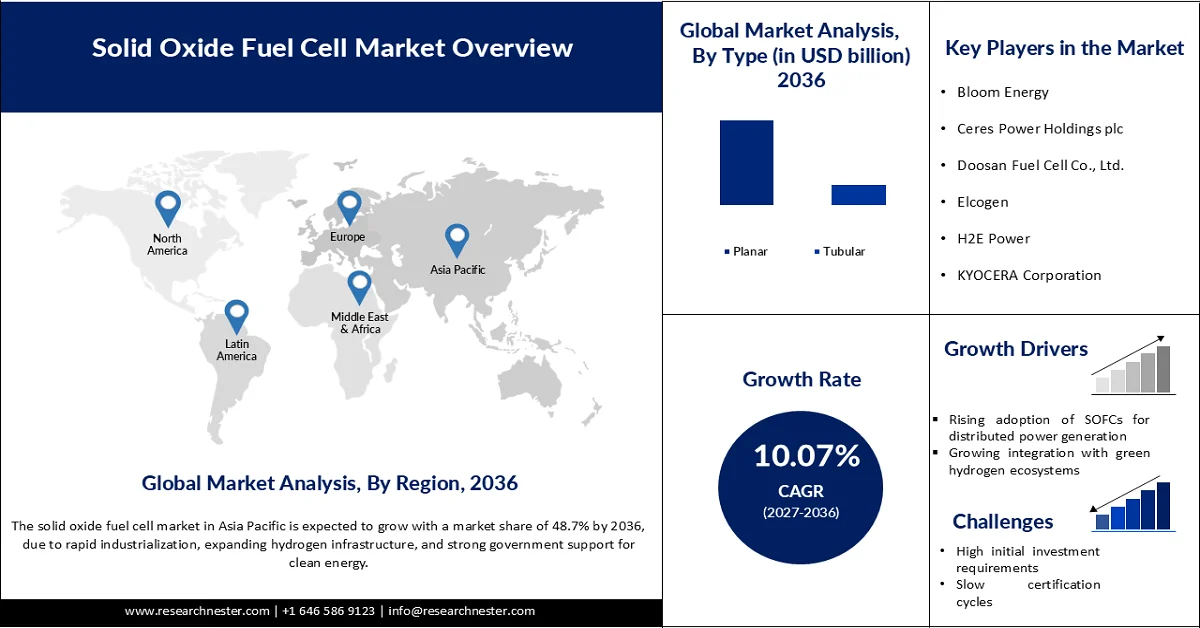
Solid Oxide Fuel Cell Market size was valued at USD 3.43 billion in 2026 and is projected to reach USD 9.40 billion by 2036, growing at a CAGR of 10.07% during the forecast period, i.e., 2027-2036. In 2027, the industry size of solid oxide fuel cell is assessed at USD 3.96 billion.
The rapid expansion of green hydrogen production is likely to create a strong demand for solid oxide fuel cell technologies. Green hydrogen is increasingly gaining traction as a key driver to achieve decarbonization goals. The robust investment in hydrogen production plants and refueling infrastructure is anticipated to boost the commercialization of solid oxide fuel cell systems.
The International Energy Agency (IEA) disclosed that
- The global hydrogen demand rose to nearly 100 million tonnes in 2024, a 2% increase from 2023.
- By 2030, about 45% of low-emission hydrogen projects are planned for export.
- Around 37,000 km of hydrogen pipelines have been proposed for development by 2035.
- Most of these projects are in Europe and China, while Germany has started repurposing a 400 km natural gas pipeline for hydrogen use.
Over the past few decades, energy technologies have emerged as the key end users of critical metals to cope with the paradigm shift of the energy transition. This has resulted in a huge demand for noble metals such as cobalt and nickel, which are the critical raw materials required for solid oxide fuel cells.
- China accounts for 63% of the total rare earth mining, making it a strategic resource on the global map.
- Most cobalt (70%) is sourced in the Democratic Republic of the Congo (Kinshasa) and China, with fewer production projects outside of these countries.
- As of 2022, the world cobalt mine reserve was 8,300,000 metric tons, and 190,000 metric tons were mined, primarily by Kinshasa and China, which remained the largest consumer.
- Nickel reserves were over 100,000,0000 metric tons, and 3,300,000 metric tons were mined.
- Indonesia has increased its nickel mining, amounting to 20% of the globally mined share.
- Zirconium was the third-largest sourced earth element, with a production volume of 1,400,000 metric tons of 68,000,000 metric tons in reserves.
- The leading exporters of zirconium concentrates were Senegal, South Africa, and Australia.
- Both cobalt and nickel are key materials used in solid oxide fuel cells (SOFCs) and solid oxide electrolyzer cells (SOEC) batteries, and the demand for both is expected to be 2 and 5 times higher in 2040 than in the 2010s.
By the year 2033, SOFCs are expected to find widespread adoption in industrial and commercial sectors, stationary power segments, data centers, and defense and military institutions, with residential sectors following closely behind. On the other hand, it has become vitally important to continue R&D to identify advanced chemical alternative materials to move solid oxide cell manufacturing away from dependency on critical element mining.
- In May 2024, the U.S. Department of Energy’s (DOE) Office of Fossil Energy and Carbon Management (FECM) initiated an RFI to promote the development of efficient reversible solid oxide fuel cells (R-SOFC). The prospects are aligned with near-zero emissions of CO2 by increasing hydrogen production capacity.
Solid Oxide Fuel Cells Projects Review through 2022
|
Project Number |
Title |
Lead Organization |
Total Funding |
Project Duration |
||
|
|
|
|
DOE |
Cost Share |
From |
To |
|
FE0031975 |
A Highly Efficient and Affordable Hybrid System for Hydrogen and Electricity Production |
Phillips 66 Company |
$3,000,000 |
$450,000 |
09/27/2020 |
09/26/2023 |
|
FE0031976 |
Low-Cost Solid Oxide Fuel Cells for Small-Scale Distributed Power Generation |
Redox Power Systems LLC |
$2,060,653 |
$665,177 |
12/01/2020 |
11/30/2023 |
|
FE0031639 |
MW-Class SOFC Pilot System Development |
FuelCell Energy Inc |
$1,500,000 |
$375,001 |
08/17/2018 |
02/16/2023 |
|
FWP1022460 |
Solid Oxide Fuel Cell Integrated Energy System |
National Energy Technology Laboratory |
$4,000,002 |
$0 |
04/01/2019 |
03/31/2022 |
|
|
$10,560,655 |
$1,490,178 |
|
|||
|
|
$12,050,833 |
|
||||
Source: NETL
Key Solid Oxide Fuel Cell Market Insights Summary:
Regional Highlights:
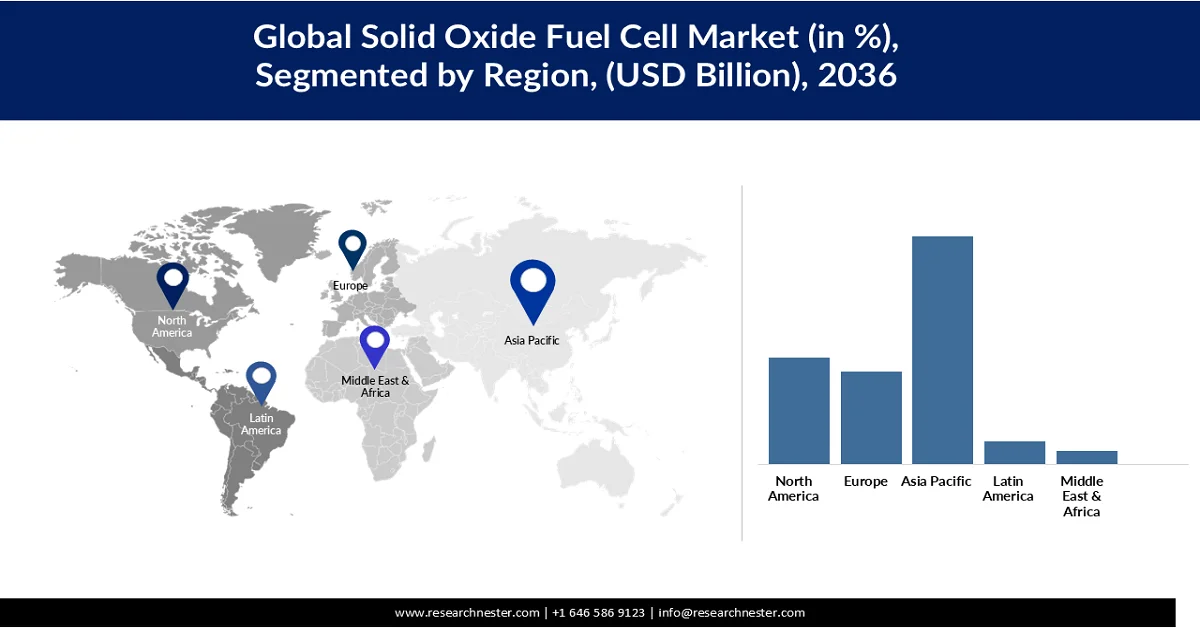
- The Asia Pacific market is anticipated to command 48.7% of global revenue by 2036, reinforced by government-backed clean energy initiatives and growing demand for energy-efficient power generation
- North America is expected to secure 23.7% of the global market share by 2036, stimulated by mounting energy demand, rapid urbanization, and increasing electricity consumption from renewable sources
- The U.S. solid oxide fuel cell market is expected to increase at a CAGR of 9.59% from 2027 to 2036, mainly owing to the robust investments in clean energy technologies
- Japan is projected to capture nearly 10.7% of the market share by 2036, supported by continuous technological advancements and a rise in hydrogen development
Segment Insights:
- The planar segment is forecast to account for 80.95% of the solid oxide fuel cell market by 2036, bolstered by its uncomplicated design, high efficiency, large power capacity, and superior power density
- The commercial & retail segment is set to hold 36.55% of the market share by 2036, fueled by the affordability, compact footprint, quiet operation, and thermal integration capabilities of SOFC systems
Key Growth Trends:
- Shift toward AI-driven distributed power systems
- Adoption in maritime decarbonization
Major Challenges:
- High initial investment requirements
- Slow certification cycles
Key Players: Bloom Energy (U.S.), Ceres Power Holdings plc (UK), Doosan Fuel Cell Co., Ltd. (South Korea), Elcogen (Estonia), H2E Power (India), KYOCERA Corporation (Japan), Lentatek Uzay Havacılık ve Teknoloji A.Ş (Turkey), Mitsubishi Heavy Industries, Ltd. (Japan), Ningbo VET Energy Technology Co., Ltd (China), SolydEra GmbH (Italy), Taiyo Yuden Co., Ltd. (Japan), WATT Fuel Cell (U.S.), Delta Electronics, Inc. (Taiwan).
Global Solid Oxide Fuel Cell Market Forecast and Regional Outlook:
Market Size & Growth Projections:
- 2026 Market Size: USD 3.43 billion
- 2027 Market Size: USD 3.96 billion
- Projected Market Size: USD 9.40 billion by 2036
- Growth Forecasts: 10.07% (2027-2036)
Key Regional Dynamics:
- Largest Region: Asia Pacific (48.7% Share by 2036)
- Fastest Growing Region: North America
- Dominating Countries: Japan, United States, China, Germany, South Korea
- Emerging Countries: India, United Kingdom, Canada, Australia, France
Last updated on : 9 July, 2026
Solid Oxide Fuel Cell Market - Growth Drivers and Challenges
Growth Drivers
- Shift toward AI-driven distributed power systems: The expansion of AI data centers is boosting the demand for on-site, grid-independent power systems. Continuous operation, scalability, and efficiency are fueling the importance of SOFC systems in the high-density computing infrastructure. Thus, the shift toward AI-driven distributed energy systems is set to increase the revenues of solid oxide fuel cell manufacturers in the years ahead.
- In April 2026, Bloom Energy announced a larger partnership with Oracle to support the fast growth of its AI and cloud infrastructure.
- Under the agreement, Oracle plans to buy up to 2.8 GW of Bloom’s fuel cell systems.
- An initial 1.2 GW has already been secured, and deployment is already under way, continuing into next year.
- These fuel cells are set to help power Oracle projects in the U.S. and support its growing cloud network.
- Adoption in maritime decarbonization: The shift toward cleaner alternatives to conventional marine fuels is expected to propel the adoption of solid oxide fuel cell solutions in the years ahead. The high electrical efficiency and ability to operate on a wide range of fuels are expected to push the adoption of SOFC systems. Researchers and manufacturers are also exploring their application in hybrid marine propulsion systems, which is expected to directly fuel the application of SOFCs as it works alongside batteries and renewable energy technologies to improve overall vessel efficiency.
- In January 2026, Delta Electronics announced a partnership with MODEC and Eld Energy to support cleaner power use in the maritime sector.
- Delta is set to provide solid oxide stacks, power conditioning systems, and converters for Eld Energy’s SOFC system, which is planned for use on an FPSO vessel.
- The partners aim to begin a 120 kW pilot trial by 2027, marking the first use of this technology on an FPSO and opening the way for hydrogen-based power at sea.
- Increasing SOFC applications across hospitals & critical health infrastructure: Research Nester projects that the rising hospital demand for 24/7 energy security is likely to create lucrative opportunities for solid oxide fuel cell technology producers. Thus, as healthcare providers focus on strengthening energy resilience and reducing grid outage risks, the demand for fuel-cell-based combined heat & power (CHP) and backup power solutions is set to boom.
- In January 2025, Rehlko revealed that it has developed a zero-emission hydrogen fuel cell system for Klickitat Valley Health (KVH), a major healthcare facility in Goldendale, Washington.
- The modular and scalable system functions as prime power, backup power, or part of a distributed energy network.
- It uses PEM fuel cell technology in collaboration with Toyota Motor North America, offering high efficiency and fast response to power demands.
- Key features include compact design, rugged outdoor durability, low noise, and a 20-year design life.
- The project supports KVH’s sustainability goals and demonstrates Rehlko’s capability in providing clean, resilient power solutions for healthcare settings.
Challenges
- High initial investment requirements: Research Nester estimates that the high upfront investment limits adoption to large, financed projects, delaying widespread commercial penetration of SOFC systems. The integration of specialized materials and technologies in the production increases the final costs of SOFC systems. Many small-scale enterprises refrain from investing in these solutions due to budget constraints.
- Slow certification cycles: The strict regulations and lengthy approval procedures are hindering the sales of SOFC systems. The lack of universal frameworks also creates regional compliance barriers. Manufacturers are required to meet various technical and safety regulations across markets. Thus, the extended certification timelines increase the commercialization costs and hamper the overall sales of SOFC systems.
Solid Oxide Fuel Cell Market Size and Forecast:
| Report Attribute | Details |
|---|---|
|
Base Year |
2026 |
|
Forecast Period |
2027-2036 |
|
CAGR |
10.07% |
|
Base Year Market Size (2026) |
USD 3.43 billion |
|
Forecast Year Market Size (2036) |
USD 9.40 billion |
|
Regional Scope |
|
Solid Oxide Fuel Cell Market Segmentation:
Type Segment Analysis
The planar segment is projected to capture 80.95% of the global solid oxide fuel cell market through 2036. The uncomplicated geometry and relatively simple construction method are contributing to the emergence of the planar solid oxide fuel cells. Planar solid oxide fuel cells are a preferred choice for power backup and voltage variations due to their high efficiency, large capacity, and continuous power generation capability. Planar SOFCs reach larger power densities than tubular SOFCs.
- For instance, Elcogen AS provides solid oxide cells that are compatible with third-party stacks. These are anode-supported, planar, ceramic cells. The operating temperature of the cell, which is low, i.e., 650°C, allows for extended lifetimes and the use of low-cost components at the stack and system levels.
End user Segment Analysis
By the end of 2036, the commercial & retail segment in the solid oxide fuel cell market is anticipated to account for a share of 36.55%. Due to their affordability, compact size, and quiet operation, solid oxide fuel cells (SOFCs) are the perfect source of energy for commercial customers. Thermal integration with current boilers and HVAC systems is also possible owing to the high-temperature waste heat from SOFC.
- For instance, German company Bosch has created a solid oxide fuel cell system for business and industrial uses and is prepared to ramp up manufacturing by 2037. This system can run on hydrogen, natural gas, biomethane, or different blends, with an electrical efficiency of greater than 60% and an overall efficiency of approximately 85%.
Mobility Segment Analysis
The stationary segment is estimated to hold the largest share of the global solid oxide fuel cell (SOFC) market throughout the forecast period. The ability to deliver highly efficient, continuous, and reliable power for long-duration applications is driving the sales of stationary SOFCs. These technologies are designed to operate at high temperatures and provide stable baseload electricity, which increases their application across commercial buildings, industrial facilities, and utility-scale distributed power systems.
Our in-depth analysis of the solid oxide fuel cell market includes the following segments:
|
Segments |
Subsegments |
|
Type |
|
|
Mobility |
|
|
Application |
|
|
End user |
|

Vishnu Nair
Head - Global Business DevelopmentCustomize this report to your requirements — connect with our consultant for personalized insights and options.
Solid Oxide Fuel Cell Market - Regional Analysis
Asia Pacific Market Insights
Asia Pacific is projected to capture 48.7% of the global solid oxide fuel cell market share through 2036. The market growth is attributed to public and private initiatives to transform electricity and power production. For instance, programs funded by the government such as ENE-FARM in Japan, along with rising demand for energy-efficient power generation, are likely to boost SOFC sales. A new department was formed in CSIR-CGCRI, Kolkata, India, known as Fuel Cell & Battery (FCB), to develop viable technologies in different important and upcoming areas in the non-conventional energy sector, namely solid oxide fuel cell (SOFC).
The sales of solid oxide fuel cells in China are estimated to increase at a CAGR of 10.79% throughout the study period. The country is among the world leaders in terms of fuel cell and hydrogen production.
- The country exported hydrogen worth USD 3.34 billion, followed by Japan and South Korea.
- Graphite, another raw material in SOFCs, is also primarily produced and exported from China (supplying 62% of total world output as of 2021).
- The U.S. was 76% dependent on cobalt imports to meet domestic requirements.
- Cobalt mining is primarily concentrated in China and the Democratic Republic of Congo.
Japan is expected to capture 22% of the Asia Pacific market share throughout the forecast period. The country is one of the most technologically advanced and commercially mature markets for solid oxide fuel cells, supported by decades of investment in fuel cell research, energy efficiency, and hydrogen development. Japan’s limited domestic energy resources and strong focus on energy security are also encouraging the adoption of distributed power generation technologies that reduce dependence on imported fossil fuels.
The Japan market is estimated to be valued at USD 471.07 million in 2027. The high-efficiency electricity for residential, commercial, and industrial applications is driving the sales of solid oxide fuel cell systems. Japan's long-term decarbonization objectives are also propelling the trade of solid oxide fuel cells. National strategies promoting hydrogen production, distribution, and utilization are encouraging the deployment of hydrogen-compatible SOFC systems.
- The government introduced its Basic Hydrogen Strategy in 2017.
- Aiming to achieve targets for developing a full hydrogen economy by 2050.
- Some key areas include expanding fuel cell vehicles and hydrogen refuelling stations.
- The government invested nearly USD 1 billion (JPY 140 billion) between 2020 and 2021 for R&D and supply chain development.
Japan Solid Oxide Fuel Cell Market Size and Forecast
|
Report Attribute |
Details |
|
Base Year Market Size (2026) |
USD 411.72 million |
|
Forecast Year Market Size (2036) |
USD 1,009.50 million |
|
CAGR (2027-2036) |
8.84% |
North America Market Insights
North America is projected to capture 23.7% of the global solid oxide fuel cell market share through 2036. The market growth is driven by mounting energy demand, rapid urbanization, and increasing electricity demand, especially from renewable sources.
- For instance, according to the U.S. Energy Information Administration, total electricity consumption in 2022 was 14 times greater than in 1950, which is equivalent to approximately 4.05 trillion kWh.
- Besides, in 2021, annual energy production was equal to 97.78 quads and consumption equaled 97.33 quads.
- Furthermore, about 61% of total electricity generation in 2021 in the U.S. was produced from fossil fuels.
Key North America Companies through 2021
|
Name |
Country |
Market cap (in USD billion) |
Technology |
|
Plug Power, Inc. |
The U.S. |
24,4 |
PEM |
|
Ballard Power Systems, Inc. |
Canada |
8.55 |
PEM |
|
Fuelcell Energy, Inc. |
The U.S. |
5.76 |
Solid oxide |
|
Bloom Energy Corp |
The U.S. |
4.76 |
Solid oxide |
Source: World Hydrogen Leaders
The U.S. solid oxide fuel cell market is estimated to reach USD 2,228.49 million by 2036. The rising demand for distributed power generation and expansion of AI-driven data centers are fueling the adoption of solid oxide fuel cell systems.
- The U.S. DOE has a dedicated hydrogen and fuel cell technologies office (HFCT) that offers grants to aid R&D activities in the field.
- The particular sub-program objectives are to develop 68- 72% peak-efficient direct H2 fuel cell power systems catering to heavy-duty vehicles that can achieve approximately 30,000-hour durability and mass production at USD 80/kw by the end of 2030.
- The hydrogen sector is more than 10 million MMT/yr in the country and 65100 MMT/yr globally.
- Considering its pathways to Princeton Net-Zero America E+RE+ and Net-Zero Greenhouse Gas Emissions scenarios, the U.S. is estimated to reach 100 MMT H2/yr in 2050, thereby aiding market growth.
The Canada solid oxide fuel cell market is expected to increase at a CAGR of 8.22% from 2027 to 2036. The country's commitment to clean energy transition and greenhouse gas emission reduction is boosting the sales of solid oxide fuel cell systems. The hydrogen economy development is expected to propel the application of solid oxide fuel cell technologies in the years ahead.
The Canadian Renewable Energy Association (CanREA) disclosed that
- By the end of 2025, Canada had about 25 GW of installed wind, solar, and energy storage capacity.
- Ontario led the way, with storage capacity rising to nearly 1 GW and expected to grow further over the next two years.
- Overall installed wind, solar, and storage capacity in Canada is projected to rise by 32% by 2029 and double by 2035.
Europe Market Insights
The Europe solid oxide fuel cell market is projected to expand at a CAGR of 10.10% from 2027 to 2036. The ambitious decarbonization policies and strong investments in hydrogen infrastructure are driving the sales of solid oxide fuel cells. The widespread adoption of distributed energy systems is also contributing to the increasing application of solid oxide fuel cell solutions.
- The Clean Hydrogen Joint Undertaking (JU) published its Annual Work Programme 2024 in January 2024.
- The programme outlines major funding calls for research and demonstration projects across the entire clean hydrogen value chain.
Key focus areas include:
- Renewable hydrogen production
- Hydrogen storage and distribution
- End-use applications in transport, clean heat & power
- Hydrogen Valleys — integrated regional ecosystems
- Cross-cutting topics such as safety, sustainability, and regulatory support
The goal is to accelerate cost reduction, scale-up, and deployment of clean hydrogen technologies to support Europe’s net-zero targets by 2050. It focuses on public-private collaboration to strengthen Europe’s competitiveness in the global hydrogen market.
The UK market for solid oxide fuel cells is expected to be valued at USD 131.64 million in 2027. The country’s aim to achieve net-zero greenhouse gas emissions and develop a robust hydrogen economy is opening high-earning opportunities for SOFC manufacturers. Commercial buildings, industrial facilities, healthcare institutions, and data centers are key end users of SOFC systems in the country.
- The commercial and retail segment is estimated to capture 36.58% of the UK market share throughout the forecast period.
The Germany solid oxide fuel cell market is set to increase at a CAGR of 10.79% throughout the study timeframe. The country’s strong industrial base and advanced engineering capabilities are fueling the sales of solid oxide fuel cell technologies. Germany's emphasis on reducing carbon emissions has also increased interest in fuel cell systems. Further, to improve energy efficiency and reduce dependence on conventional power sources, end users such as chemical and automotive facilities are exploring SOFC systems.
Key Solid Oxide Fuel Cell Market Players:
- Bloom Energy (U.S.)
- Ceres Power Holdings plc (UK)
- Doosan Fuel Cell Co., Ltd. (South Korea)
- Elcogen (Estonia)
- H2E Power (India)
- KYOCERA Corporation (Japan)
- Lentatek Uzay Havacılık ve Teknoloji A.Ş (Turkey)
- Mitsubishi Heavy Industries, Ltd. (Japan)
- Ningbo VET Energy Technology Co., Ltd (China)
- SolydEra GmbH (Italy)
- Taiyo Yuden Co., Ltd. (Japan)
- WATT Fuel Cell (U.S.)
- Delta Electronics, Inc. (Taiwan)
- Company Overview
- Business Strategy
- Key Product Offerings
- Financial Performance
- Key Performance Indicators
- Risk Analysis
- Recent Development
- Regional Presence
- SWOT Analysis
- Bloom Energy is a U.S.-based clean energy company that makes solid oxide fuel cell systems for local power generation. Based in San Jose, it serves data centers, hospitals, utilities, factories, and commercial customers around the world. Its work covers distributed power, fuel cell systems, energy services, hydrogen solutions, and microgrid use. So far, Bloom has deployed more than 1.4 GW of fuel cell capacity at over 1,000 sites worldwide, with growing use in AI data centers and other critical facilities.
- Ceres Power Holdings plc is a UK-based clean energy technology company that develops solid oxide fuel cell and electrolysis systems. Its technology supports local power generation and green hydrogen production, helping industries move toward lower carbon energy. The company mainly provides core technology for fuel cells, electrolysis, data centers, industrial power, and hydrogen uses rather than finished end-user systems.
- Doosan Fuel Cell is a clean energy company that develops fuel cell technology for local power generation, hydrogen energy, and lower-carbon solutions. It makes advanced fuel cell systems for industrial, commercial, and utility use. Its SOFC range includes power systems, stacks, marine fuel cell solutions, and distributed energy systems for data centers, office buildings, and industrial sites, supporting efficient power generation with lower emissions. The company also has manufacturing units, research centers, and international partnerships, while its Gunsan plant and global expansion efforts are helping it grow in Asia and other overseas markets.
- Elcogen is a European clean energy technology company that works on solid oxide fuel cell and electrolysis systems. It develops key components that support efficient power generation and green hydrogen production, helping lower carbon emissions and advance the energy transition. Its main offerings include SOFC cells, stacks, stack modules, and SOEC systems for hydrogen production. These technologies are used in stationary power, backup power, data centers, maritime, and industrial settings, and are designed to work in third-party systems with strong efficiency, fuel flexibility, and scalable use from small to large energy applications.
- H2E Power is an India-based clean energy company working on solid oxide fuel cell and electrolysis technologies. It develops efficient systems for local power generation and green hydrogen production, placing itself in the growing hydrogen energy sector. Its SOFC systems are used for telecom, industrial backup, and remote power needs, and can run on hydrogen, natural gas, and other fuels to provide steady on-site electricity. The company is also advancing SOEC technology to support green hydrogen output and cleaner hybrid energy solutions.
Below is the list of the key players, among several others, operating in the global solid oxide fuel cell market:
The strong presence of regional and international companies characterizes the market. The key players are investing heavily in R&D activities to introduce next-gen solutions. They are also entering into strategic collaborations with others to enhance their product offerings. Some gigantic companies are expanding their operations across high-potential economies to earn lucrative returns. Both organic and inorganic marketing strategies are projected to double the revenues of key players during the study period.
Corporate Landscape of the Global Solid Oxide Fuel Cell Market:
Recent Developments
- In May 2026, Elcogen launched its new elcoStack E3000 G2 platform for solid oxide fuel cells and electrolyser stacks. The new system offers better performance and supports lower costs for sustainable energy solutions.
- In April 2026, Delta Electronics, Inc. announced a partnership with Centrica to support data centres and energy-heavy industries in the UK and Europe. The first step in this collaboration is the use of solid oxide fuel cells for off-grid power generation. This setup can offer customers lower-cost power on-site and reduce their exposure to electricity price swings and grid limits.
- Report ID: 3514
- Published Date: Jul 09, 2026
- Report Format: PDF, PPT
- Explore a preview of key market trends and insights
- Review sample data tables and segment breakdowns
- Experience the quality of our visual data representations
- Evaluate our report structure and research methodology
- Get a glimpse of competitive landscape analysis
- Understand how regional forecasts are presented
- Assess the depth of company profiling and benchmarking
- Preview how actionable insights can support your strategy
Explore real data and analysis
Frequently Asked Questions (FAQ)
About this Report
Connect with our Expert


Report, 2027-2036


Copyright @ 2026 Research Nester. All Rights Reserved.
