Solar Updraft Tower Market Outlook:
Solar Updraft Tower Market size was over USD 22.64 billion in 2025 and is projected to reach USD 214.25 billion by 2035, growing at around 25.2% CAGR during the forecast period i.e., between 2026-2035. In the year 2026, the industry size of solar updraft tower is evaluated at USD 27.77 billion.
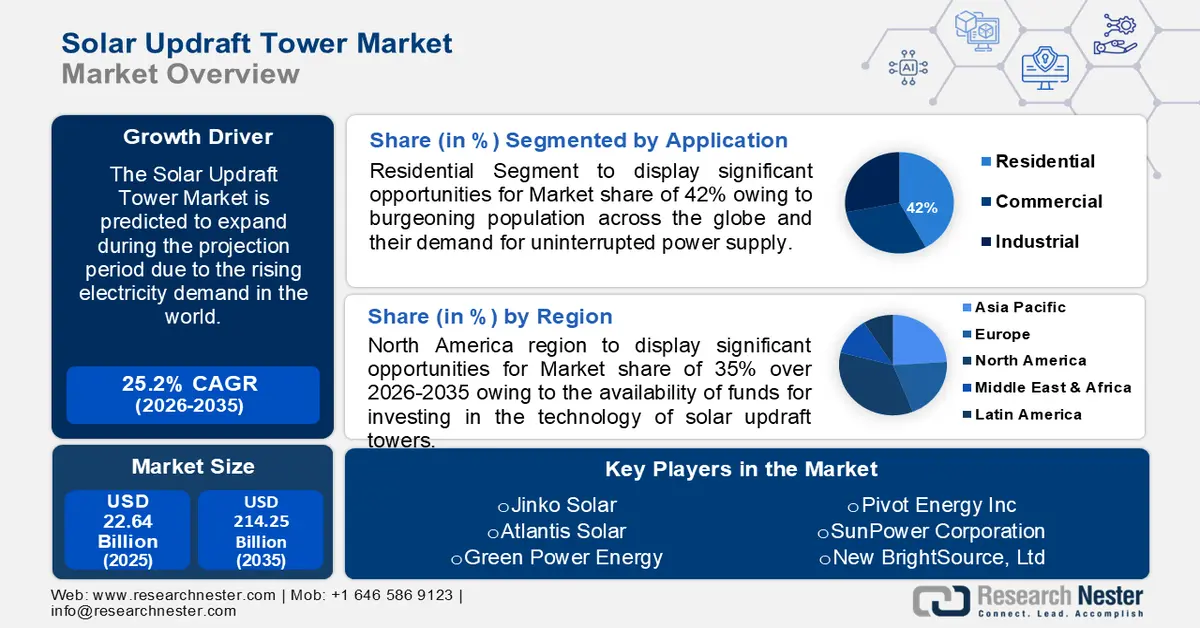
The rising electricity demand in the world has increased the utilization rate of solar updraft towers. The International Energy Agency (IEA) stated that global electricity demand grew by 6% in 2022 from the previous years.
A Solar Updraft Tower (SUT) is an advanced technology that produces sustainable energy using the natural convection of air heated by solar radiation. Major key players are investing hefty amounts in research and development activities to introduce more efficiency in the technology of solar updraft towers and reduce production costs. This factor is estimated to aid in attracting new opportunities for revenue generation in the upcoming years.
Key Solar Updraft Tower Market Insights Summary:
Regional Highlights:
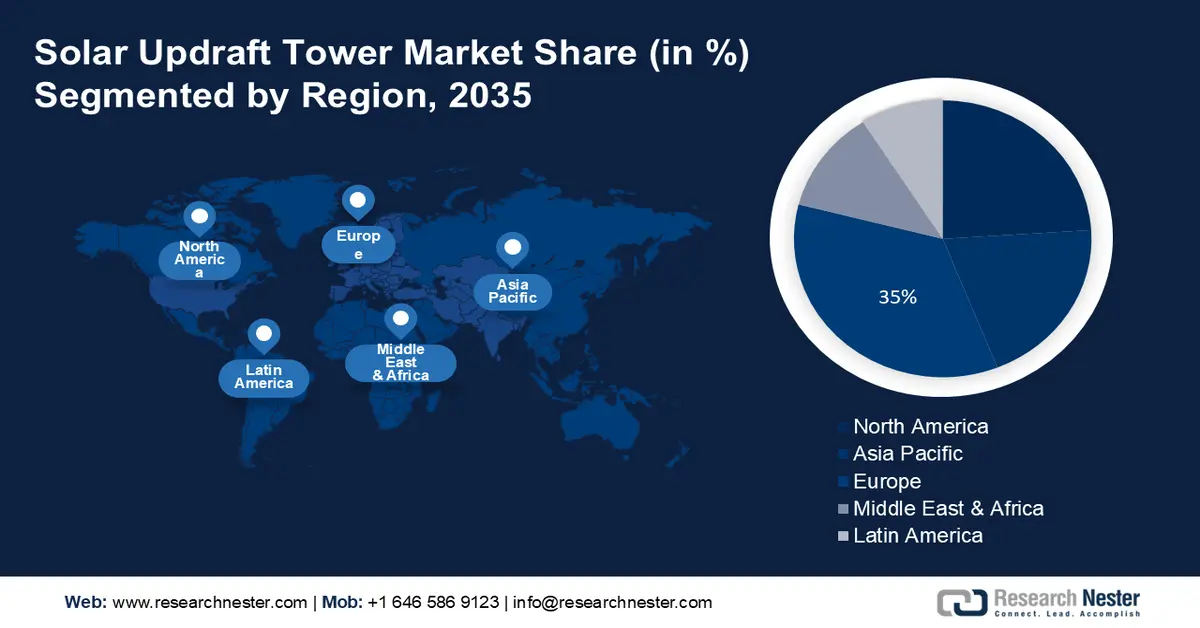
- North America is projected to hold 35% share by 2035 in the solar updraft tower market, fueled by strong research infrastructure, technological advancements, and availability of investment funds for efficient tower development.
- Asia Pacific is expected to secure around 24% share by 2035, driven by high solar radiation levels and growing governmental focus on clean energy initiatives in countries like China, India, and Australia.
Segment Insights:
- The wind turbine segment is forecasted to capture 32% share by 2035, supported by its essential function in converting thermal energy into electricity and rising wind power generation globally.
- The residential segment is expected to hold 42% share by 2035, propelled by population growth, increased demand for uninterrupted power supply, and favorable renewable energy incentives.
Key Growth Trends:
- Growing Demand for Renewable Energy Sources
- Increasing Adoption of Solar Equipment
Major Challenges:
- Requirement of Constant Maintenance and Construction
- High Investment and Funds Required
Key Players: Enviromission LimitedGreen Power EnergyHyperion Solar EnergyPivot Energy Inc.Atlantis SolarSunPower CorporationNew BrightSource, Ltd.Hanwha Q CELLS GmbHFirst Solar, Inc.Jinko Solar.
Global Solar Updraft Tower Market Forecast and Regional Outlook:
Market Size & Growth Projections:
- 2025 Market Size: USD 22.64 billion
- 2026 Market Size: USD 27.77 billion
- Projected Market Size: USD 214.25 billion by 2035
- Growth Forecasts: 25.2%
Key Regional Dynamics:
- Largest Region: North America (35% share by 2035)
- Fastest Growing Region: Asia Pacific
- Dominating Countries: United States, China, India, Germany, Australia
- Emerging Countries: Brazil, Mexico, South Africa, Indonesia, Turkey
Last updated on : 24 November, 2025
Solar Updraft Tower Market - Growth Drivers and Challenges
Growth Drivers
-
Growing Demand for Renewable Energy Sources–creates a positive environment that leads to the development and future demand for solar updraft towers. In 2021, global renewable electricity production rose by almost 7% from the previous years and recorded a 522 TWh increase.
-
Increasing Adoption of Solar Equipment – To reduce the dependency on fossil-based energy, the world has been adopting various solar equipment which includes solar panels, energy storage systems, power meters, and others. This is expected to bring lucrative growth opportunities for the market. The percentage of solar photovoltaic panels installed in the year 2022 in China was 100% and India was 50% as per the estimations.
-
The Need to Reduce Carbon Footprint – The rising use of non-renewable sources of electricity increases the carbon footprint across the world and adversely impacts the environment. This brings the need for solar updraft towers for energy production. It has been calculated that the global CO2 emissions from electricity production grew in 2022 by 0.9%, or 321 million tons, reaching a new high of more than 36.8 billion tons.
Challenges
-
Requirement of Constant Maintenance and Construction – Usually, the maintenance of solar updraft towers requires a specific amount of dedication and money. This process could be costlier in the longer run which is projected to hamper the market growth.
-
High Investment and Funds Required
-
Low Tower Output in Areas with Low Solar Radiation and Variable Weather Conditions
Solar Updraft Tower Market Size and Forecast:
| Report Attribute | Details |
|---|---|
|
Base Year |
2025 |
|
Forecast Year |
2026-2035 |
|
CAGR |
25.2% |
|
Base Year Market Size (2025) |
USD 22.64 billion |
|
Forecast Year Market Size (2035) |
USD 214.25 billion |
|
Regional Scope |
|
Solar Updraft Tower Market Segmentation:
Component Segment Analysis
The wind turbine segment value is poised to be the greatest among the others with a market share of 32% by the end of 2035. Wind turbines are an imperative component of solar updraft towers for converting the thermal energy of the air in the tower into mechanical energy which could be further used for generating electricity. Furthermore, the increased electricity generation capacity by wind is also slated to favor the expansion of segment size in the forecasted timeline. It has been calculated that the amount of wind power generation rose by almost 55% in 2020 and reached 270 TWh in 2021.
Application Segment Analysis
The residential segment is set to be the largest share in the market with a value of 42% by 2035. The burgeoning population across the globe and their demand for uninterrupted power supply is predicted to bring opportunities for extensive use of solar updraft towers. Additionally, favorable government incentives and subsidies for adopting renewable sources of energy are projected to help in generating a robust revenue income.
Our in-depth analysis of the market includes the following segments:
|
Component |
|
|
Application |
|

Vishnu Nair
Head - Global Business DevelopmentCustomize this report to your requirements — connect with our consultant for personalized insights and options.
Solar Updraft Tower Market - Regional Analysis
North America Market Insights
North America industry is predicted to dominate majority revenue share of 35% by 2035, owing to presence of numerous research institutions for the development of the latest technology in the region. The availability of funds for investing in the technology of solar updraft towers along with the presence of numerous research institutions for the development of the latest technology for building efficient solar updraft towers are considered to be major factors contributing positively to raising the market value in the future.
Asia Pacific Market Insights
The Asia Pacific solar updraft tower market is estimated to grow at a notable pace and holds almost 24% market share by the end of the forecast timeline. The Asia Pacific is the region with high solar radiation levels which aids in solar power generation and the high focus on producing clean energy in Australia, China, and India region is estimated to help in market size expansion.
Solar Updraft Tower Market Players:
- Enviromission Limited
- Company Overview
- Business Strategy
- Key Product Offerings
- Financial Performance
- Key Performance Indicators
- Risk Analysis
- Recent Development
- Regional Presence
- SWOT Analysis
- Green Power Energy
- Hyperion Solar Energy
- Pivot Energy Inc.
- Atlantis Solar
- SunPower Corporation
- New BrightSource, Ltd.
- Hanwha Q CELLS GmbH
- First Solar, Inc.
- Jinko Solar
Recent Developments
- Enviromission Limited has signed a joint venture agreement with Dewan International Limited and DP Solrenergy India Private Limited (SOLRE) that grants permission to SOLRE to develop EnviroMission’s Solar Cyclone Tower (SCT) renewable energy technology in the Republic of India.
- Green Power Energy has achieved a milestone of completing hundreds of residential solar power installations in Hunterdon County.
- Report ID: 4979
- Published Date: Nov 24, 2025
- Report Format: PDF, PPT
- Explore a preview of key market trends and insights
- Review sample data tables and segment breakdowns
- Experience the quality of our visual data representations
- Evaluate our report structure and research methodology
- Get a glimpse of competitive landscape analysis
- Understand how regional forecasts are presented
- Assess the depth of company profiling and benchmarking
- Preview how actionable insights can support your strategy
Explore real data and analysis
Frequently Asked Questions (FAQ)
Solar Updraft Tower Market Report Scope
Free Sample includes current and historical market size, growth trends, regional charts & tables, company profiles, segment-wise forecasts, and more.
Connect with our Expert


Copyright @ 2026 Research Nester. All Rights Reserved.
