Printed Batteries Market Outlook:
Printed Batteries Market size was valued at USD 330 million in 2025 and is projected to reach USD 8.46 billion by the end of 2035, rising at a CAGR of 38.32% during the forecast period, i.e., 2026-2035. In 2026, the industry size of printed batteries is evaluated at USD 285 million.
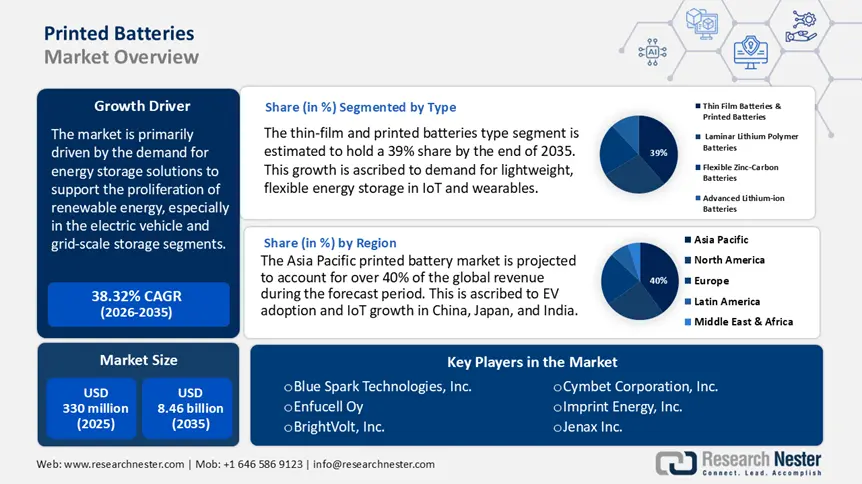
The printed batteries market is primarily driven by the demand for energy storage solutions to support the proliferation of renewable energy, especially in the electric vehicle and grid-scale storage segments. This market trend is further fostered by government policies, including the U.S. Inflation Reduction Act, which encourages investments in battery research and manufacturing activities. According to the U.S. Department of Energy, the U.S. energy storage capacity is on track to record 200 GW by 2050 as opposed to 25 GW in 2020, of which battery storage capacity alone is likely to constitute 175 GW. The established use case of batteries in stabilizing renewable energy grids encourages domestic production, innovation, assembly, and distribution of printed battery technologies, thereby offering flexibility for niche applications, including IoT devices and consumer wearables.
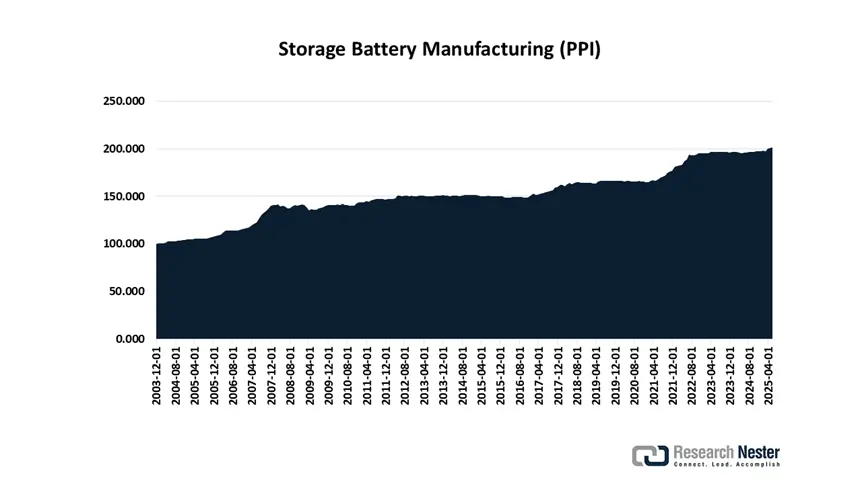
Producer Price Index by Industry: Storage Battery Manufacturing (June 2025)
Source: Fred
The raw material supply chain relies heavily on critical minerals comprising lithium, cobalt, and graphite. China dominates the overall trade scenario of these raw materials. The EIA states that in 2023, China imported 44% (12 million short tons) and exported 58% (11 million short tons) of the interregional battery mineral trade, controlling 85% of global battery cell production capacity. Manufacturing capacity is projected to triple by the end of 2030, considering the present project pipeline. Assembly lines are highly localized in the U.S. and Europe, with more investments in domestic facilities to decouple from import dependency. The Producer Price Index (PPI) for battery manufacturing reached 272.611 in June 2025 from 193.400 in June 2010, as per the U.S. Bureau of Labor Statistics.
Key Printed Batteries Market Insights Summary:
Regional Insights:
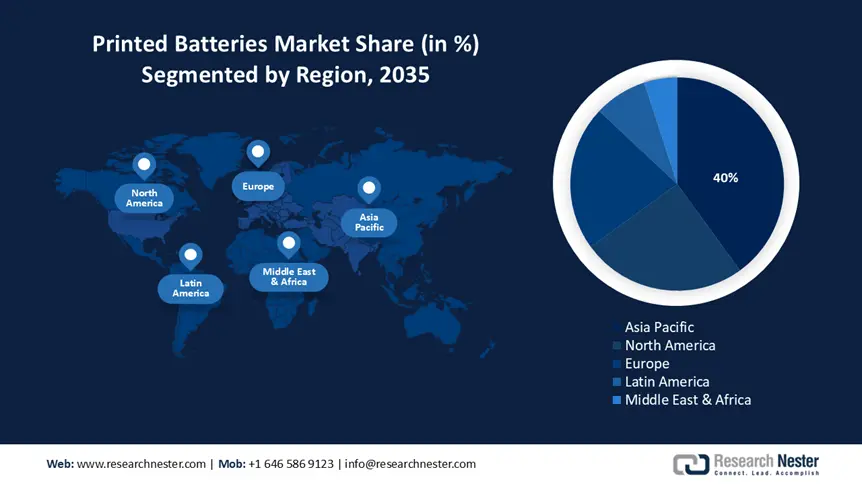
- Across 2026–2035, the Asia Pacific printed batteries market is projected to exceed a 40% revenue share, underpinned by accelerating EV adoption and IoT expansion in China, Japan, and India.
- By 2035, the North American printed batteries market is expected to capture over 25% share, supported by rising demand for IoT, wearables, and EVs in the region.
Segment Insights:
- By 2035, the thin-film and printed batteries type segment in the printed batteries market is projected to secure a 39% share, propelled by demand for lightweight, flexible energy storage in IoT and wearables.
- The consumer electronics segment is anticipated to command over 30% share by 2035, supported by high investments to satisfy high product demand.
Key Growth Trends:
- Electric Vehicle (EV) market expansion
- Renewable energy storage growth
Major Challenges:
- Lack of performance reliability in adverse conditions
Key Players: Blue Spark Technologies, Inc., Enfucell Oy, BrightVolt, Inc., Cymbet Corporation, Inc., Imprint Energy, Inc., Jenax Inc., Planar Energy Devices Inc., FlexEl LLC, Samsung SDI Co., Ltd., NEC Corporation, VARTA Microbattery GmbH, Ilika Plc, Excellatron Solid State, LLC, Ultralife Corporation, Thin Film Electronics ASA / Ensurge Micropower ASA
Global Printed Batteries Market Forecast and Regional Outlook:
Market Size & Growth Projections:
- 2025 Market Size: USD 330 million
- 2026 Market Size: USD 285 million
- Projected Market Size: USD 8.46 billion by 2035
- Growth Forecasts: 38.32% CAGR (2026-2035)
Key Regional Dynamics:
- Largest Region: Asia Pacific (40%+ Share by 2035)
- Fastest Growing Region: Asia Pacific
- Dominating Countries: United States, China, Japan, Germany, South Korea
- Emerging Countries: India, Vietnam, Indonesia, Mexico, Brazil
Last updated on : 11 August, 2025
Printed Batteries Market - Growth Drivers and Challenges
Growth Drivers
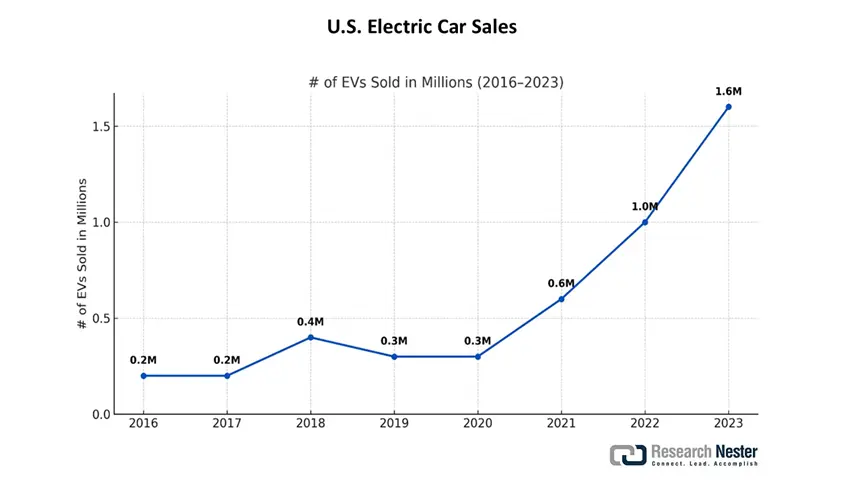
- Electric Vehicle (EV) market expansion: The rapid rise in EV adoption has created opportunities for printed batteries. Although lithium-ion is still a prevalent choice, printed batteries, especially 3D-printed solid-state and lithium-metal ones, are showcasing promising potential for electric vehicles. It allows customizable designs, in terms of shapes and sizes, which directly impacts manufacturing costs and environmental aftermath. EV deliveries surged by 48% in 2023 in the U.S. and reached 1.6 million BEV + PHEV units, as per OICA. Most EV manufacturers experienced a surge in sales between 2022 and 2023. The overall increase was calculated at 35% in this period. BYD launched 30 new models across 10 segments. This led to sales of 3 million units in 2023.
Leading Global EV Manufacturers
|
EV Manufacturer |
Plugin Vehicle Sales, Jan-Dec 2023 |
|
Tesla |
1,808,652 |
|
BYD Group |
1,570,388 |
|
SAIC |
748, 159 |
|
Volkswagen Group |
742,703 |
|
Geely-Volvo |
589,932 |
Source: OICA
U.S. Electric Car Sales
Source: OICA
- Renewable energy storage growth: Printed batteries are pivotal to facilitate renewable energy storage in solar and wind systems-based IoT devices and provide grid stability. According to the IEA, battery storage in the power industry emerged as the fastest-expanding energy technology in 2023, with deployment doubling year-on-year. The sustainable battery materials market is poised to reach USD 111 billion by 2037, owing to innovations in chemical production, including bio-based electrolytes and efficacy in terms of carbon footprint. Carbon emissions in battery production primarily arise from cathode and anode active material sourcing, mineral refining, production, and manufacturing processes. Printed batteries align with government policies around carbon emissions.
Global Installed Renewable Energy and Energy Storage Capacity by Scenario, 2022 and 2030
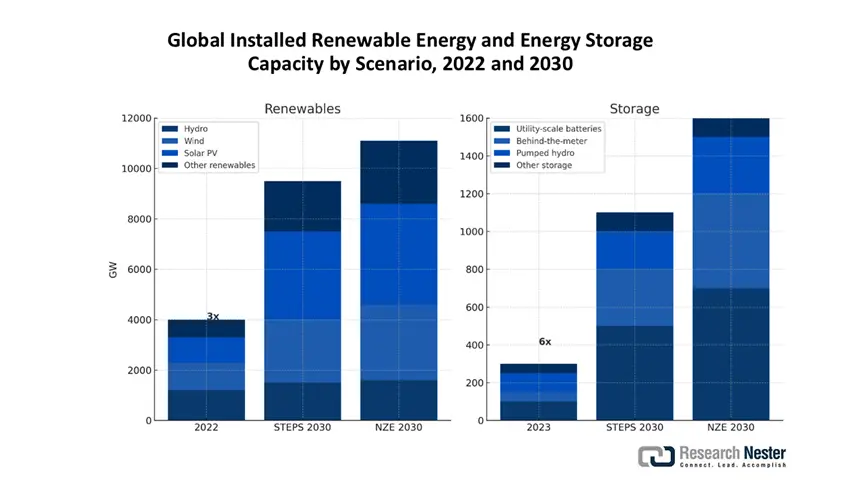
Energy storage capacity, led by battery storage, increases sixfold by 2030 in the NZE Scenario and supports the tripling of the renewables capacity goal
Source: IEA
Raw Material Supply Chain of Batteries
|
1 |
Mining |
Extraction of raw ores for battery materials |
|
2 |
Processing |
Raw material refining to form precursors of battery materials |
|
3 |
Cell component manufacturing |
Specialized battery component production: anode and cathode materials, separators, electrolytes, casings |
|
4 |
Pack production |
Development and integration of battery cells in battery packs, like sensors, electronics, and management systems |
|
5 |
Battery storage |
Storage in low-emission power systems |
|
6 |
Deployment |
Assemble and supply to end users |
|
7 |
Reuse/Recycle |
Recycling of minerals and materials for repurposing |
Geographical Distribution of the Global Battery Supply Chain
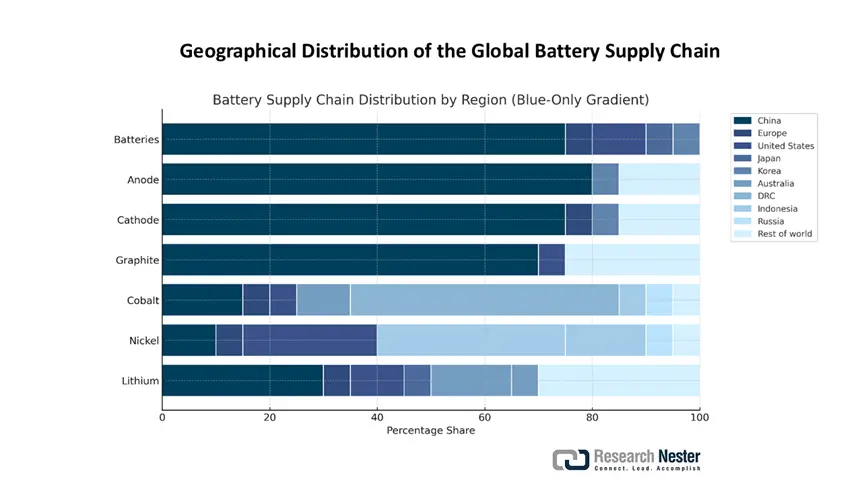
The raw material supply and extraction of battery metals are primarily concentrated in certain geographies and are susceptible to supply shocks and restrains. The IEA World Energy Outlook report suggests that Australia generates almost 45% of the total lithium, and the Democratic Republic of the Congo (DRC) contributes 65% of the world’s cobalt production. Furthermore, Indonesia supplies 55% of the total Nickel, much of which is in the form of lateritic deposits. This is then converted to intermediate chemicals such as battery-grade sulphate via the high-pressure acid leach method. Indonesia alone provides 60% of the worldwide battery-grade sulphate. Zinc offers potential advantages over lithium, ascribed to its accessibility, abundance, and affordability. Zinc concentrate is 52-83 ppm, and lithium concentrate is 22-32 ppm. Zinc price reached its highest – $4.43 per kg and dropped below $2.5 per kg in 2023, whereas lithium cost $426 per kg and slumped below $200 per kg in 2023.
The key reason for this price discrepancy lies in the supply/demand dynamics and manufacturing scales. According to a May 2024 study by NCBI, the current production of zinc is roughly 13,000 kt annually and proven reserves of 210,000 kt, which makes it the fourth most extracted element. Eight countries- China, Australia, Peru, India, the U.S., Mexico, Russia, and Bolivia contribute 77.2% of the cumulative zinc and own 78.5% of the global reserves. This approximately sums up to ~1,900,000 kt. Additionally, thin-film rechargeable zinc batteries are a sustainable and affordable alternative to lithium-ion counterparts for IoT devices and renewable energy storage.
Top Zinc Ores and Concentrates Trade Players, 2023
|
Exporter |
Export Value |
Importer |
Import Value |
|
Peru |
USD 1.73 billion |
China |
USD 3.71 billion |
|
Australia |
USD 1.45 billion |
South Korea |
USD 1.21 billion |
|
The U.S. |
USD 1.01 billion |
Spain |
USD 782 million |
Source: OEC
Global zinc mine production grew by 5% and reached 12.7 million metric tons (Mt) in 2020, and smelter manufacturing declined by 3%, valuing a gross weight of 13.4 Mt of zinc. As per the International Lead and Zinc Study Group (ILZSG), the worldwide zinc usage surged from 13.3 Mt in 2020 to 14.0 Mt in 2021, underscoring 6% CAGR. Zinc was listed by the Defense Logistics Agency Strategic Materials as a candidate for the Annual Materials Plan (AMP). The AMP ceiling disposal for zinc, in terms of quantity, was 7,250 t or 7,993 short tons for the fiscal year 2021. This suggests that the maximum quantity of zinc sold from the NDS in the fiscal year was the same quantity that remained in the stockpile. In the fiscal year 2021, the stockpile was at 7,250 t at year's end, and no zinc was disposed of.
Battery manufacturing capacity predominantly lies with China and amounts to 85% of present production capacity, marking a significant rise from 75% in 2020. Europe and the U.S. together account for 13% of the capacity. The world’s battery manufacturing capacity is projected to expand fourfold from current levels by the end of 2030, assuming all planned projects are materialized on time. This will facilitate decoupling from dependence on China, and the country's share is likely to reduce by 2030 as a result of these efforts. Furthermore, Korean companies are emerging as international investors in the assembly, distribution, and supply of batteries. They own more than 400 GWh of capacity outside Korea. Chinese and Japanese firms also own production capacity in other countries, 30 GWh of Chinese and 60 GWh of Japanese non-domestic capacity, which are much smaller volumes. In Europe, Korean companies dominate the scenario, with the LG Energy Solution plant in Poland alone contributing to half of Europe’s total battery manufacturing capacity.
Challenges
- Lack of performance reliability in adverse conditions: Printed batteries hold considerable promise for applications in flexible electronics and IoT technologies. However, several real-world obstacles have slowed their broader rollout. One major concern is the cost of production, which remains notably higher than that of standard battery options. This price gap makes it difficult for manufacturers to scale up operations or compete with established alternatives in the printed batteries market. Additionally, the limited energy storage capacity of these batteries restricts their application to low-power devices. Access to essential materials, especially conductive inks and specific substrates needed for production, is also limited, further complicating the supply chain. Moreover, these batteries often struggle to maintain stable performance in harsh conditions, such as changes in temperature and humidity, raising doubts about their long-term dependability in real-world environments.
Printed Batteries Market Size and Forecast:
| Report Attribute | Details |
|---|---|
|
Base Year |
2025 |
|
Forecast Year |
2026-2035 |
|
CAGR |
38.32% |
|
Base Year Market Size (2025) |
USD 330 million |
|
Forecast Year Market Size (2035) |
USD 8.46 billion |
|
Regional Scope |
|
Printed Batteries Market Segmentation:
Type Segment Analysis
The thin-film and printed batteries type segment is estimated to hold a 39% printed batteries market share by the end of 2035. This growth is ascribed to demand for lightweight, flexible energy storage in IoT and wearables. A substantial number of IoT manufacturers opt for flexible batteries for compact electronics. In the competitive landscape, several government strategies have propelled companies, comprising as Panasonic, to focus on R&D investments to facilitate dominance in potential applications. Moreover, technological advancements such as screen printing reduce costs and foster further adoption. Thin-film batteries have found widespread use in smart cards and wearables. The EU Batteries Regulation of 2023 mandates sustainability in recycling and production.
End user Segment Analysis
The consumer electronics segment is anticipated to garner over 30% of the share during the forecast period, owing to high investments to satisfy high product demand. According to a July 2025 Semiconductor Industry Association report, USD 3 billion was sanctioned for microelectronics manufacturing. Under the SIA program, GlobalFoundries was allocated USD 125 million for a high-volume and next-generation pipeline of Gallium Nitride on Silicon for power grid, EVs, and 5G and 6G smartphones. The U.S. domestic export value of electronic products increased by USD 15.1 billion or 10.3% to reach USD 161.5 billion in 2021. The exports in 2020 faced a hit of 8.2%. Semiconductor and ICs summed up to USD 5.0 billion in outbound trade, USD 3.0 billion in medical goods, and USD 2.1 billion in peripherals, computers, and components.
Our in-depth analysis of the global printed batteries market includes the following segments:
|
Segment |
Sub-segment |
|
Component |
|
|
Type |
|
|
End user |
|
|
Materials |
|
|
Chargeability |
|
|
Voltage Range |
|

Vishnu Nair
Head - Global Business DevelopmentCustomize this report to your requirements — connect with our consultant for personalized insights and options.
Printed Batteries Market - Regional Analysis
Asia Pacific Market Insights
The Asia Pacific printed batteries market is projected to account for over 40% of the global revenue during the forecast period. This is ascribed to EV adoption and IoT growth in China, Japan, and India. In terms of battery development, China dominates the world, whereas Japan’s METI funded ¥617 billion in 2021 for advanced semiconductors. China contributed to over 80% of the overall battery cell production, with 90% of the cathode and 97% of the anode material capacity.
India is set to dominate the Asia Pacific printed batteries market and exhibit a staggering CAGR in the assessed period. The Government of India is initiating initiatives, including Manthan Platform, NRF, to optimize battery R&D infrastructure through incentives, funding, and partnership efforts. State governments are issuing research grants and are establishing Centers of Excellence (CoE) under their specific EV policies to promote industry-led collaborations. India has showcased noteworthy potential in specific segments of the battery supply chain and is relevant for countries seeking to diversify their supply chains away from China. India already generates numerous ancillary raw materials as well as precursor materials for battery production. However, the country still faces some challenges, like limited resources of nickel, lithium, and cobalt. To propagate India's battery supply chain in the global landscape, India and the international community are increasingly collaborating on trade, financing, and research.
India Raw and Precursor Material Production and Proved Reserves, 2021-2022
|
Raw Material |
Production |
Proved Reserves |
|
Bauxite |
22,493,947 metric tons |
560,865,000 metric tons |
|
Copper ore |
3,569,632 metric tons |
128,267,000 metric tons |
|
Natural graphite |
57,264 metric tons |
4,386,467 metric tons |
|
Synthetic graphite |
>30,000 metric tons |
NA |
|
Fluorspar |
1.237 metric tons |
228,393 metric tons |
|
Phosphate rock |
1,395,079 metric tons |
27,103,158 metric tons |
|
Iron ore |
253,974,000 metric tons |
4,631,786,000 metric tons |
|
Lithium |
0 |
5,900,000 metric tons |
|
Nickel |
0 |
189,000,000 metric tons |
|
Cobalt |
0 |
44,910,000 metric tons |
|
Manganese |
2,695,991 metric tons |
61,510,000 metric tons |
Source: ORF America
North America Market Insights
The North American printed batteries market is expected to hold a share of over 25% during the assessment period. The growth scenario is ascribed to high demand for IoT, wearables, and EVs in the region. U.S. adoption of industry products is credited to a prominent end user share of consumer electronics, leading to a shifting preference to locally produce a high volume of flexible batteries. The battery manufacturing capacity in the U.S. has doubled since 2022, with the incorporation of tax credits for producers and surpassed 200 GWh in 2024. The IEA in its March 2025 report stated that 700 GWh of surplus production capacity is pipelined, and 40% of present capacity is collaboratively operated by established battery makers and automakers. Strategically deploying automation, supporting innovation, and digitization has a pivotal role to play in generating sufficient yields to decouple from dependency on China's companies and allow diversification of supplies.
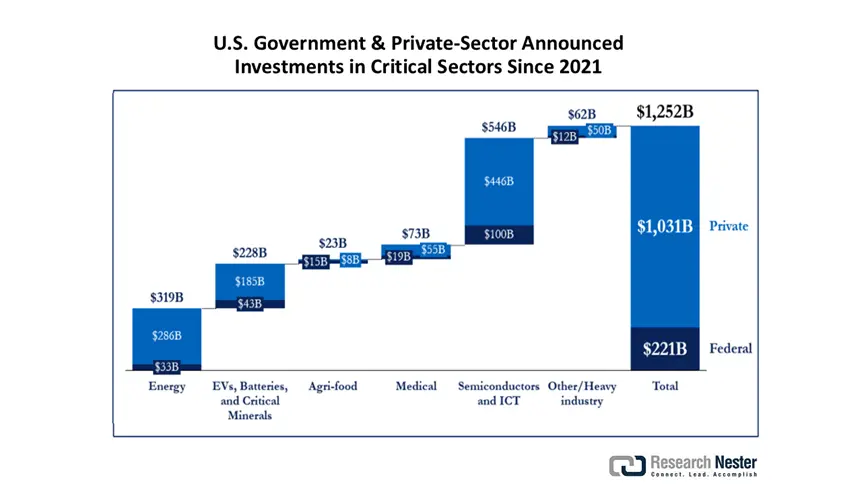
The U.S. printed batteries market is driven by a growing emphasis on domestic batteries. Over the past few years, the government has strategically allocated resources from federal investments, major legislation, comprising grants, loans, procurements, tax credits, and other mechanisms, primarily aided by the IRA, BIL, and the CHIPS and Science Act, that sanctioned USD 1 trillion in clean energy and manufacturing for the private sector since 2021. USD 796 billion of this fund was allocated for new American production capabilities. For instance, the CHIPS and Science Act announced an influx of USD 53 billion in the country’s semiconductor segment, R&D, and workforce development, leading to USD 446 billion in planned private investment. As part of it, Ultium Cells launched a battery cell manufacturing plant in Warren, Ohio, employing 2,200 employees and has delivered 100 million battery cells as of December 2024, according to the Quadrennial Supply Chain Review.
U.S. Government & Private-Sector Announced Investments in Critical Sectors Since 2021
Source: Trade.gov
Europe Market Insights
The European printed batteries market is projected to hold a lion's share in the forthcoming years. The region's regulatory protocols have shaped the battery manufacturing and deployment chain over the past several years it highlighting the procurement and usage of sustainable materials. For example, the REGULATION (EU) 2023/1542 issued by the parliament stressed heavily on recycling and the second life of batteries to help transition to a climate-neutral and circular economy. The Communication of the Commission introduced the Circular Economy Action Plan in March 2020 to streamline the recycling rates of batteries.
Germany is projected to capture the largest share by 2034, due to a robust battery storage scenario and IoT production. The country's thriving automotive sector is a potential end user of printed and flexible batteries for its small electronic devices. Battery storage is being deployed at a massive scale, and the IEA stated that the capacity reached 16 GW by the end of 2021, wherein 6 GW of grid-scale battery storage was added alone in 2021. The high-capacity factor in Germany is fueling the growth of the printed batteries market. Moreover, the emerging policies like the ETSI EN 303 645 released in June 2020 are supporting IoT devices innovation, which in turn, is aiding printed battery demand.
Key Printed Batteries Market Players:
- Blue Spark Technologies, Inc.
- Company Overview
- Business Strategy
- Key Product Offerings
- Financial Performance
- Key Performance Indicators
- Risk Analysis
- Recent Development
- Regional Presence
- SWOT Analysis
- Enfucell Oy
- BrightVolt, Inc.
- Cymbet Corporation, Inc.
- Imprint Energy, Inc.
- Jenax Inc.
- Planar Energy Devices Inc.
- FlexEl LLC
- Samsung SDI Co., Ltd.
- NEC Corporation
- VARTA Microbattery GmbH
- Ilika Plc
- Excellatron Solid State, LLC
- Ultralife Corporation
- Thin Film Electronics ASA / Ensurge Micropower ASA
The global printed batteries market is fragmented, showcasing an international portfolio of seasoned players and entrants driving innovation, scale, and diversity in applications. Leading firms are capitalizing on the anticipated opportunities in EV and prioritizing roll-to-roll scalable production, additive manufacturing, 3D printing, patent-backed material platforms, and cross-industry collaborations to proliferate their market presence. Below are a few prominent players operating in the global printed batteries market:
Recent Developments
- In November 2023, Western Michigan University announced the development of flexible printed batteries and lightweight sensing systems. They are integrating the Systec roll-to-roll screen printer to foster advances in flexible components for high-volume manufacturing.
- In May 2023, Brookhaven National Laboratory, in close collaboration with the U.S. DoE, launched the investigation of 3D printed batteries in water-in-salt gel polymer electrolyte. This novel 3D printable battery is environmentally sustainable and is customizable for future applications and technologies.
- Report ID: 2969
- Published Date: Aug 11, 2025
- Report Format: PDF, PPT
- Explore a preview of key market trends and insights
- Review sample data tables and segment breakdowns
- Experience the quality of our visual data representations
- Evaluate our report structure and research methodology
- Get a glimpse of competitive landscape analysis
- Understand how regional forecasts are presented
- Assess the depth of company profiling and benchmarking
- Preview how actionable insights can support your strategy
Explore real data and analysis
Frequently Asked Questions (FAQ)
Printed Batteries Market Report Scope
Free Sample includes current and historical market size, growth trends, regional charts & tables, company profiles, segment-wise forecasts, and more.
Connect with our Expert
Copyright @ 2026 Research Nester. All Rights Reserved.


