- Introduction
- Market Definition
- Market Segmentation
- Product Overview
- Assumptions and Acronyms
- Research Methodology
- Research Process
- Primary Research
- Secondary Research
- Market Size Estimation
- Executive Summary- Middle East & Africa Renewable Energy-as-a-Service Market
- Regulatory Landscape
- Market Dynamics
- Drivers
- Restraints
- Trends
- Opportunities
- Industry Risk Analysis
- Demand Risk Analysis
- Supply Risk Analysis
- Impact of Covid-19 on the Middle East & Africa Renewable Energy-as-a-Service Market
- Competitive Landscape
- Competitive Trends
- Competitive Benchmarking of the Key Middle East Market Players
- Competitive Benchmarking of the Key Africa Market Players
- Company Profiles
- QTM
- Smart4Power LLC
- Energy Savers FZE
- Enova (Veolia Environnement)
- Schneider Electric
- SGS
- Middle East & Africa Renewable Energy-as-a-Service Market Outlook
- 10.1. Market Size and Forecast, 2019-2028
- By Value (USD Million), 2019-2028F
- Macro-Economic Indicators
- Market Segmentation
- By Service Type
- Energy Procurement, Operations & Maintenance, Efficiency & Optimization, Equipment Upgrade and Refurbishment, Others, 2019-2028F (USD Million)
- By End-User
- Residential, Commercial, Industrial, 2019-2028F (USD Million)
- By Country/Region
- Israel, GCC (Saudi Arabia, UAE, Bahrain, Kuwait, Qatar, Oman), Egypt, Kenya, Ethiopia, Democratic Republic of Congo (DRC), Morocco, Nigeria, South Africa, Rest Of MEA, 2019-2028F (USD Million)
- Israel
- Pricing Analysis
- By Value (USD Million), 2019-2028F
- Market Segmentation
- By Service Type
- Energy Procurement, Operations & Maintenance, Efficiency & Optimization, Equipment Upgrade and Refurbishment, Others, 2019-2028F (USD Million)
- By End-User
- Residential, Commercial, Industrial, 2019-2028F (USD Million)
- GCC
- By Value (USD Million), 2019-2028F
- Market Segmentation
- By Service Type
- Energy Procurement, Operations & Maintenance, Efficiency & Optimization, Equipment Upgrade and Refurbishment, Others, 2019-2028F (USD Million)
- By End-User
- Residential, Commercial, Industrial, 2019-2028F (USD Million)
- Saudi Arabia
- Pricing Analysis
- By Service Type
- Energy Procurement, Operations & Maintenance, Efficiency & Optimization, Equipment Upgrade and Refurbishment, Others, 2019-2028F (USD Million)
- By End-User
- Residential, Commercial, Industrial, 2019-2028F (USD Million)
- UAE
- Pricing Analysis
- By Service Type
- Energy Procurement, Operations & Maintenance, Efficiency & Optimization, Equipment Upgrade and Refurbishment, Others, 2019-2028F (USD Million)
- By End-User
- Residential, Commercial, Industrial, 2019-2028F (USD Million)
- Bahrain
- Pricing Analysis
- By Service Type
- Energy Procurement, Operations & Maintenance, Efficiency & Optimization, Equipment Upgrade and Refurbishment, Others, 2019-2028F (USD Million)
- By End-User
- Residential, Commercial, Industrial, 2019-2028F (USD Million)
- Kuwait
- Pricing Analysis
- By Service Type
- Energy Procurement, Operations & Maintenance, Efficiency & Optimization, Equipment Upgrade and Refurbishment, Others, 2019-2028F (USD Million)
- By End-User
- Residential, Commercial, Industrial, 2019-2028F (USD Million)
- Qatar
- Pricing Analysis
- By Service Type
- Energy Procurement, Operations & Maintenance, Efficiency & Optimization, Equipment Upgrade and Refurbishment, Others, 2019-2028F (USD Million)
- By End-User
- Residential, Commercial, Industrial, 2019-2028F (USD Million)
- Oman
- Pricing Analysis
- By Service Type
- Energy Procurement, Operations & Maintenance, Efficiency & Optimization, Equipment Upgrade and Refurbishment, Others, 2019-2028F (USD Million)
- By End-User
- Residential, Commercial, Industrial, 2019-2028F (USD Million)
- Egypt
- Pricing Analysis
- By Value (USD Million), 2019-2028F
- Market Segmentation
- By Service Type
- Energy Procurement, Operations & Maintenance, Efficiency & Optimization, Equipment Upgrade and Refurbishment, Others, 2019-2028F (USD Million)
- By End-User
- Residential, Commercial, Industrial, 2019-2028F (USD Million)
- Kenya
- Pricing Analysis
- By Value (USD Million), 2019-2028F
- Market Segmentation
- By Service Type
- Energy Procurement, Operations & Maintenance, Efficiency & Optimization, Equipment Upgrade and Refurbishment, Others, 2019-2028F (USD Million)
- By End-User
- Residential, Commercial, Industrial, 2019-2028F (USD Million)
- Ethiopia
- Pricing Analysis
- By Value (USD Million), 2019-2028F
- Market Segmentation
- By Service Type
- Energy Procurement, Operations & Maintenance, Efficiency & Optimization, Equipment Upgrade and Refurbishment, Others, 2019-2028F (USD Million)
- By End-User
- Residential, Commercial, Industrial, 2019-2028F (USD Million)
- Democratic Republic of Congo (DRC)
- Pricing Analysis
- By Value (USD Million), 2019-2028F
- Market Segmentation
- By Service Type
- Energy Procurement, Operations & Maintenance, Efficiency & Optimization, Equipment Upgrade and Refurbishment, Others, 2019-2028F (USD Million)
- By End-User
- Residential, Commercial, Industrial, 2019-2028F (USD Million)
- Morocco
- Pricing Analysis
- By Value (USD Million), 2019-2028F
- Market Segmentation
- By Service Type
- Energy Procurement, Operations & Maintenance, Efficiency & Optimization, Equipment Upgrade and Refurbishment, Others, 2019-2028F (USD Million)
- By End-User
- Residential, Commercial, Industrial, 2019-2028F (USD Million)
- Nigeria
- Pricing Analysis
- By Value (USD Million), 2019-2028F
- Market Segmentation
- By Service Type
- Energy Procurement, Operations & Maintenance, Efficiency & Optimization, Equipment Upgrade and Refurbishment, Others, 2019-2028F (USD Million)
- By End-User
- Residential, Commercial, Industrial, 2019-2028F (USD Million)
- South Africa
- Pricing Analysis
- By Value (USD Million), 2019-2028F
- Market Segmentation
- By Service Type
- Energy Procurement, Operations & Maintenance, Efficiency & Optimization, Equipment Upgrade and Refurbishment, Others, 2019-2028F (USD Million)
- By End-User
- Residential, Commercial, Industrial, 2019-2028F (USD Million)
- Analyst’s Review
Middle East & Africa Renewable Energy-as-a-Service Market Highlights Over 2019 - 2028
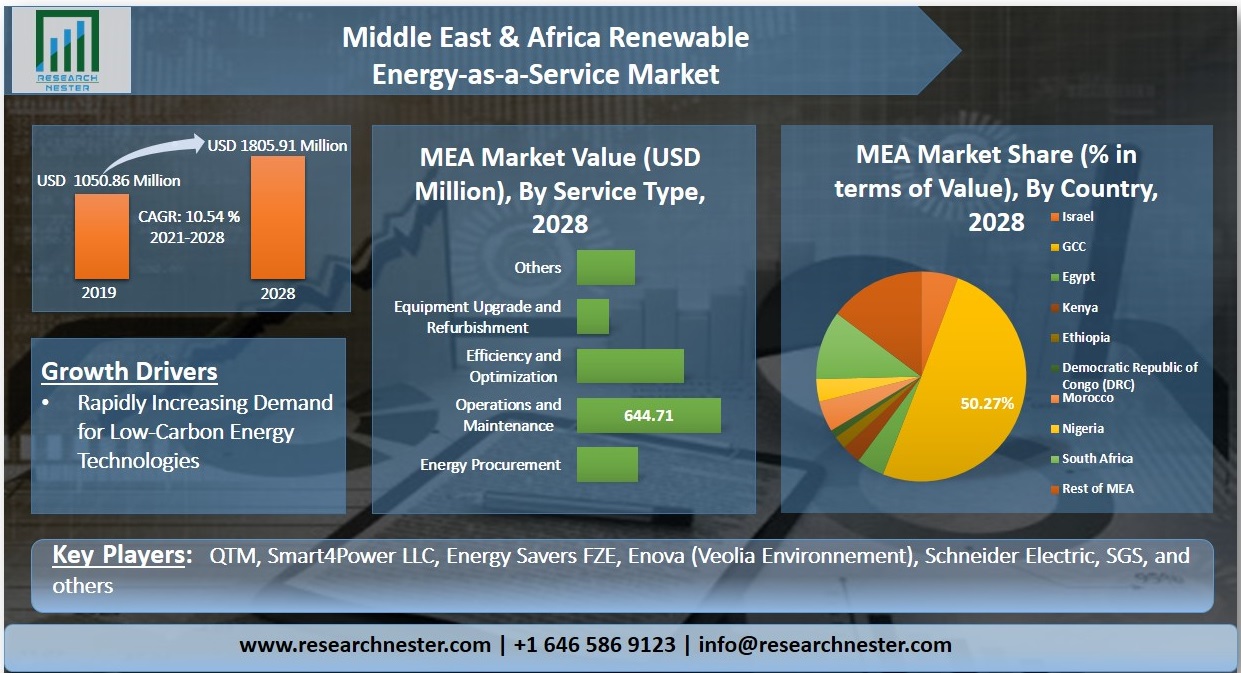
The Middle East & Africa renewable energy-as-a-service market is estimated to grow with a CAGR of 10.54% during the forecast period, i.e., 2021-2028. The market which registered USD 1050.86 Million in the year 2019, is further projected to reach USD 1805.91 Million by the end of 2028. The growth of the market can be attributed to the rapidly increasing demand for low-carbon energy technologies, along with the decreasing cost of renewable power generation process.
Get more information on this report: Download Sample PDF
Renewable energy is used across various industries such as power generation, transportation, and for energy requirements in residential and commercials buildings. However, widespread deployment of such low carbon technologies is still limited in the region. The adoption of renewable energy-as-a-service model provides a feasible solution in such a scenario. Renewable energy-as-a-service model not only provides regular energy services to the consumer but also simultaneously saves the consumers from capital constraints such as high upfront technology and maintenance costs. In addition, changing consumer demands in tandem with the gradual shift in the power paradigm into a renewable energy-based decentralized and digitalized system has also led to the development of new energy solutions and services. According to the statistics by the International Renewable Energy Agency (IRENA), the total installed renewable energy capacity during the period 2017-2018 in the GCC nations was 867MW.

The increased utilization of renewable energy sources on account of growing industrial demand in tandem with decreasing cost of technology has resulted in an increased adoption of these resources in the region. In the recent years, renewable energy resources have become strategic assets for countries in the Middle East & Africa region. Several countries in the region are abundant in resources such as solar, wind, geothermal, hydro, and biomass. In addition, these countries are also focused on the increased renewable energy investments, which in turn, is aimed at reducing overall energy cost along with providing enhanced energy security to the consumers. Moreover, increasing adoption of renewable energy targets, coupled with the growing awareness pertaining to the potential benefits associated with the utilization of renewable energy resources is also anticipated to strengthen the market growth during the forecast period.
Middle East & Africa Renewable Energy-as-a-Service Market Geographical Synopsis
Geographically, the Middle East & Africa renewable energy-as-a-service market is segmented into Israel, GCC, Egypt, Kenya, Ethiopia, Democratic Republic of Congo, Morocco, Nigeria, South Africa, and Rest of MEA. Amongst these countries, the market in GCC is anticipated to hold the largest market share of 50.27% and is further projected to reach USD 907.76 Million by the end of 2028. The adoption of renewable energy has witnessed a significant increase in the GCC countries over the last decade. Technological innovations in tandem with the region’s sustainable energy targets are among the key factors, which have resulted in the increased adoption of renewable sources of energy in the region. The region has witnessed a significant growth in the utilization of renewables, which in turn, is expected to strengthen the region’s power supply in the upcoming years. In addition, growing focus towards increased adoption of renewable forms of energy coupled with the increasing demand for primary energy in the region is also projected to greatly improve the utilization of renewable energy-as-a-service model in the forthcoming years. Amongst the countries in GCC, the market in Saudi Arabia is anticipated to grow with the highest CAGR of 12.32% during the forecast period.
Growth Drivers and Challenges Impacting the Growth of the Middle East & Africa Renewable Energy-as-a-Service Market
Growth Drivers
- Rapidly Increasing Demand for Low-Carbon Energy Technologies
- Decreasing Cost of Renewable Power Generation
Challenges
- Challenges Related to Integration and Deployment of the Service Model
- Probability of Lower Adoption in Residential Sector
Middle East & Africa Renewable Energy-as-a-Service Market Segmentation Synopsis
The Middle East & Africa renewable energy-as-a-service market is segmented on the basis of service type into energy procurement, operations & maintenance, efficiency & optimization, equipment upgrade & refurbishment, and others, out of which, the operations & maintenance segment is anticipated to hold the largest market share throughout the forecast period. The segment is further anticipated to record a market revenue of USD 644.71 Million by the end of 2028 and grow with a CAGR of 11.07% during the forecast period. The operations and maintenance services include continuous optimization of the operations in order to enhance the availability, efficiency, and output of renewable energy power plant and also increase the life of plant. A preventive and periodic maintenance services of the equipment ensures that the machinery operates efficiently, safely, and optimally in peak conditions. Some of the key O&M services include audit and analysis of complete O&M function, development and implementation of site-specific practices & procedures, integrated on-site services for O&M function, short-term O&M labor support, and others.
Top Featured Companies Dominating the Market
Our report has covered detailed company profiling comprising company overview, business strategies, key product offerings, financial performance, key performance indicators, risk analysis, recent developments, regional presence, and SWOT analysis among other notable indicators for competitive positioning. Some of the prominent industry leaders in the Middle East & Africa renewable energy-as-a-service market that are included in our report are QTM, Smart4Power LLC, Energy Savers FZE, Enova (Veolia Environnement), Schneider Electric, SGS, and others.
Key Reasons to Buy Our Report
- The report covers detailed analysis comprising market share attained by each market segment and its sub-segments.
- It covers market dynamics including growth drivers, trends, potential opportunities, price trend analysis and challenges that impact the market growth.
- The report includes detailed company profiles of the major players dominating the market.
- We use effective research methodologies to calculate the market numbers and provide value-added assessment for overall growth.
- We provide customized reports as per the clients’ requirement helping them to see possible and unexpected challenges and unforeseen opportunities in order to help them reach their goal.
Recent Developments
-
August 24, 2020: Enova (Veolia Environnement) announced that in partnership with Dubai International Academic City and Dubai Outsource City, it has successfully completed the two solar photovoltaic carports that is anticipated to generate around 4.25GWh of clean electricity annually.
- Report ID: 3190
- Published Date: Feb 09, 2023
- Report Format: PDF, PPT
- Explore a preview of key market trends and insights
- Review sample data tables and segment breakdowns
- Experience the quality of our visual data representations
- Evaluate our report structure and research methodology
- Get a glimpse of competitive landscape analysis
- Understand how regional forecasts are presented
- Assess the depth of company profiling and benchmarking
- Preview how actionable insights can support your strategy
Explore real data and analysis
Frequently Asked Questions (FAQ)
About this Report
Connect with our Expert


Copyright @ 2026 Research Nester. All Rights Reserved.
