Global Liquid Hydrocarbon
- An Outline of the Global Liquid Hydrocarbon Market
- Market Definition and Segmentation
- Study Assumptions and Abbreviations
- Research Methodology & Approach
- Primary Research
- Secondary Research
- Data Triangulation
- SPSS Methodology
- Executive Summary
- Growth Drivers
- Major Roadblocks
- Opportunities
- Prevalent Trends
- Government Regulation
- Growth Outlook
- Competitive White Space Analysis – Identifying Untapped Market Gaps
- Risk Overview
- SWOT
- Technological Advancement
- Technology Maturity Matrix for Liquid Hydrocarbon
- Recent News
- Regional Demand
- Global Liquid Hydrocarbon by Geography – Strategic Comparative Analysis
- Strategic Segment Analysis: Liquid Hydrocarbon Demand Landscape
- Global Liquid Hydrocarbon Demand Trends Driven by Construction, Sustainability and Petrochemicals 2026-2035)
- Root Cause Analysis (RCA) for discovering problems of the Liquid Hydrocarbon Porter Five Forces
- PESTLE
- Comparative Positioning
- Liquid Hydrocarbon– Key Player Analysis (2035)
- Competitive Landscape: Key Suppliers/Players
- Competitive Model: A Detailed Inside View for Investors
- Company Market Share, 2035 (%)
- Business Profile of Key Enterprise
- ExxonMobil Corporation
- Chevron Corporation
- Royal Dutch Shell plc
- BP plc
- TotalEnergies SE
- Sinopec Group
- Rosneft
- Kuwait Petroleum Corporation
- ONGC
- Business Profile of Key Enterprise
- Global Liquid Hydrocarbon Market Outlook
- Market Overview
- Market Revenue by Value (USD Trillion), Volume (Trillion Tons), and Compound Annual Growth Rate (CAGR)
- Global Segmentation Liquid Hydrocarbon Analysis (2026-2035)
- By Type
- Crude Oil, Market Value (USD Trillion), and CAGR, 2026-2035F
- Refined Products, Market Value (USD Trillion), and CAGR, 2026-2035F
- Natural Gas Liquids, Market Value (USD Trillion), and CAGR, 2026-2035F
- Synthetic & Bio-Based Hydrocarbons, Market Value (USD Trillion), and CAGR, 2026-2035F
- By Application
- Fuel & Energy, Market Value (USD Trillion), and CAGR, 2026-2035F
- Petrochemical Feedstock, Market Value (USD Trillion), and CAGR, 2026-2035F
- Specialty Fluids & Solvents, Market Value (USD Trillion), and CAGR, 2026-2035F
- By End-user
- Transportation, Market Value (USD Trillion), and CAGR, 2026-2035F
- Industrial, Market Value (USD Trillion), and CAGR, 2026-2035F
- Residential & Commercial, Market Value (USD Trillion), and CAGR, 2026-2035F
- Government & Military, Market Value (USD Trillion), and CAGR, 2026-2035F
- Regional Synopsis, Value (USD Trillion), 2026-2035
- North America Market Value (USD Trillion) and CAGR & Y-o-Y Growth Trend, 2026-2035F
- Europe Market Value (USD Trillion) and CAGR & Y-o-Y Growth Trend, 2026-2035F
- Asia Pacific Market Value (USD Trillion) and CAGR & Y-o-Y Growth Trend, 2026-2035F
- Latin America Market Value (USD Trillion) and CAGR & Y-o-Y Growth Trend, 2026-2035F
- Middle East and Africa Market Value (USD Trillion) and CAGR & Y-o-Y Growth Trend, 2026-2035F
- By Type
- Market Overview
- North America Market
- Overview
- Market Value (USD Trillion), Current and Future Projections, 2026-2035
- Increment $ Opportunity Assessment, 2026-2035
- Segmentation (USD Trillion), 2026-2035,
- By Type
- Crude Oil, Market Value (USD Trillion), and CAGR, 2026-2035F
- Refined Products, Market Value (USD Trillion), and CAGR, 2026-2035F
- Natural Gas Liquids, Market Value (USD Trillion), and CAGR, 2026-2035F
- Synthetic & Bio-Based Hydrocarbons, Market Value (USD Trillion), and CAGR, 2026-2035F
- By Application
- Fuel & Energy, Market Value (USD Trillion), and CAGR, 2026-2035F
- Petrochemical Feedstock, Market Value (USD Trillion), and CAGR, 2026-2035F
- Specialty Fluids & Solvents, Market Value (USD Trillion), and CAGR, 2026-2035F
- By End-user
- Transportation, Market Value (USD Trillion), and CAGR, 2026-2035F
- Industrial, Market Value (USD Trillion), and CAGR, 2026-2035F
- Residential & Commercial, Market Value (USD Trillion), and CAGR, 2026-2035F
- Government & Military, Market Value (USD Trillion), and CAGR, 2026-2035F
- Country Level Analysis, Value (USD Trillion)
- U.S. Market Value (USD Trillion) and CAGR & Y-o-Y Growth Trend, 2026-2035F
- Canada Market Value (USD Trillion) and CAGR & Y-o-Y Growth Trend, 2026-2035F
- By Type
- Overview
- Europe Market
- Overview
- Market Value (USD Trillion), Current and Future Projections, 2026-2035
- Increment $ Opportunity Assessment, 2026-2035
- Segmentation (USD Trillion), 2026-2035, B
- By Type
- Crude Oil, Market Value (USD Trillion), and CAGR, 2026-2035F
- Refined Products, Market Value (USD Trillion), and CAGR, 2026-2035F
- Natural Gas Liquids, Market Value (USD Trillion), and CAGR, 2026-2035F
- Synthetic & Bio-Based Hydrocarbons, Market Value (USD Trillion), and CAGR, 2026-2035F
- By Application
- Fuel & Energy, Market Value (USD Trillion), and CAGR, 2026-2035F
- Petrochemical Feedstock, Market Value (USD Trillion), and CAGR, 2026-2035F
- Specialty Fluids & Solvents, Market Value (USD Trillion), and CAGR, 2026-2035F
- By End-user
- Transportation, Market Value (USD Trillion), and CAGR, 2026-2035F
- Industrial, Market Value (USD Trillion), and CAGR, 2026-2035F
- Residential & Commercial, Market Value (USD Trillion), and CAGR, 2026-2035F
- Government & Military, Market Value (USD Trillion), and CAGR, 2026-2035F
- Country Level Analysis, Value (USD Trillion)
- UK Market Value (USD Trillion) and CAGR & Y-o-Y Growth Trend, 2026-2035F
- Germany Market Value (USD Trillion) and CAGR & Y-o-Y Growth Trend, 2026-2035F
- France Market Value (USD Trillion) and CAGR & Y-o-Y Growth Trend, 2026-2035F
- Italy Market Value (USD Trillion) and CAGR & Y-o-Y Growth Trend, 2026-2035F
- Spain Market Value (USD Trillion) and CAGR & Y-o-Y Growth Trend, 2026-2035F
- Netherlands Market Value (USD Trillion) and CAGR & Y-o-Y Growth Trend, 2026-2035F
- Russia Market Value (USD Trillion) and CAGR & Y-o-Y Growth Trend, 2026-2035F
- Switzerland Market Value (USD Trillion) and CAGR & Y-o-Y Growth Trend, 2026-2035F
- Poland Market Value (USD Trillion) and CAGR & Y-o-Y Growth Trend, 2026-2035F
- Belgium Market Value (USD Trillion) and CAGR & Y-o-Y Growth Trend, 2026-2035F
- Rest of Europe Market Value (USD Trillion) and CAGR & Y-o-Y Growth Trend, 2026-2035F
- By Type
- Overview
- Asia Pacific Market
- Overview
- Market Value (USD Trillion), Current and Future Projections, 2026-2035
- Increment $ Opportunity Assessment, 2026-2035
- Segmentation (USD Trillion), 2026-2035,
- By Type
- Crude Oil, Market Value (USD Trillion), and CAGR, 2026-2035F
- Refined Products, Market Value (USD Trillion), and CAGR, 2026-2035F
- Natural Gas Liquids, Market Value (USD Trillion), and CAGR, 2026-2035F
- Synthetic & Bio-Based Hydrocarbons, Market Value (USD Trillion), and CAGR, 2026-2035F
- By Application
- Fuel & Energy, Market Value (USD Trillion), and CAGR, 2026-2035F
- Petrochemical Feedstock, Market Value (USD Trillion), and CAGR, 2026-2035F
- Specialty Fluids & Solvents, Market Value (USD Trillion), and CAGR, 2026-2035F
- By End-user
- Transportation, Market Value (USD Trillion), and CAGR, 2026-2035F
- Industrial, Market Value (USD Trillion), and CAGR, 2026-2035F
- Residential & Commercial, Market Value (USD Trillion), and CAGR, 2026-2035F
- Government & Military, Market Value (USD Trillion), and CAGR, 2026-2035F
- Country Level Analysis, Value (USD Trillion)
- China Market Value (USD Trillion) and CAGR & Y-o-Y Growth Trend, 2026-2035F
- India Market Value (USD Trillion) and CAGR & Y-o-Y Growth Trend, 2026-2035F
- South Korea Market Value (USD Trillion) and CAGR & Y-o-Y Growth Trend, 2026-2035F
- Australia Market Value (USD Trillion) and CAGR & Y-o-Y Growth Trend, 2026-2035F
- Indonesia Market Value (USD Trillion) and CAGR & Y-o-Y Growth Trend, 2026-2035F
- Malaysia Market Value (USD Trillion) and CAGR & Y-o-Y Growth Trend, 2026-2035F
- Vietnam Market Value (USD Trillion) and CAGR & Y-o-Y Growth Trend, 2026-2035F
- Thailand Market Value (USD Trillion) and CAGR & Y-o-Y Growth Trend, 2026-2035F
- Singapore Market Value (USD Trillion) and CAGR & Y-o-Y Growth Trend, 2026-2035F
- New Zeeland Market Value (USD Trillion) and CAGR & Y-o-Y Growth Trend, 2026-2035F
- Rest of Asia Pacific Excluding Japan Market Value (USD Trillion) and CAGR & Y-o-Y Growth Trend, 2026-2035F
- By Type
- Overview
- Latin America Market
- Overview
- Market Value (USD Trillion), Current and Future Projections, 2026-2035
- Increment $ Opportunity Assessment, 2026-2035
- Year-on-Year Growth Forecast (%)
- Segmentation (USD Trillion), 2026-2035, By
- By Type
- Crude Oil, Market Value (USD Trillion), and CAGR, 2026-2035F
- Refined Products, Market Value (USD Trillion), and CAGR, 2026-2035F
- Natural Gas Liquids, Market Value (USD Trillion), and CAGR, 2026-2035F
- Synthetic & Bio-Based Hydrocarbons, Market Value (USD Trillion), and CAGR, 2026-2035F
- By Application
- Fuel & Energy, Market Value (USD Trillion), and CAGR, 2026-2035F
- Petrochemical Feedstock, Market Value (USD Trillion), and CAGR, 2026-2035F
- Specialty Fluids & Solvents, Market Value (USD Trillion), and CAGR, 2026-2035F
- By End-user
- Transportation, Market Value (USD Trillion), and CAGR, 2026-2035F
- Industrial, Market Value (USD Trillion), and CAGR, 2026-2035F
- Residential & Commercial, Market Value (USD Trillion), and CAGR, 2026-2035F
- Government & Military, Market Value (USD Trillion), and CAGR, 2026-2035F
- Country Level Analysis, Value (USD Trillion)
- Brazil Market Value (USD Trillion) and CAGR & Y-o-Y Growth Trend, 2026-2035F
- Argentina Market Value (USD Trillion) and CAGR & Y-o-Y Growth Trend, 2026-2035F
- Mexico Market Value (USD Trillion) and CAGR & Y-o-Y Growth Trend, 2026-2035F
- Rest of Latin America Market Value (USD Trillion) and CAGR & Y-o-Y Growth Trend, 2026-2035F
- By Type
- Overview
- Middle East & Africa Market
- Overview
- Market Value (USD Trillion), Current and Future Projections, 2026-2035
- Increment $ Opportunity Assessment, 2026-2035
- Year-on-Year Growth Forecast (%)
- By Type
- Crude Oil, Market Value (USD Trillion), and CAGR, 2026-2035F
- Refined Products, Market Value (USD Trillion), and CAGR, 2026-2035F
- Natural Gas Liquids, Market Value (USD Trillion), and CAGR, 2026-2035F
- Synthetic & Bio-Based Hydrocarbons, Market Value (USD Trillion), and CAGR, 2026-2035F
- By Application
- Fuel & Energy, Market Value (USD Trillion), and CAGR, 2026-2035F
- Petrochemical Feedstock, Market Value (USD Trillion), and CAGR, 2026-2035F
- Specialty Fluids & Solvents, Market Value (USD Trillion), and CAGR, 2026-2035F
- By End-user
- Transportation, Market Value (USD Trillion), and CAGR, 2026-2035F
- Industrial, Market Value (USD Trillion), and CAGR, 2026-2035F
- Residential & Commercial, Market Value (USD Trillion), and CAGR, 2026-2035F
- Government & Military, Market Value (USD Trillion), and CAGR, 2026-2035F
- Country Level Analysis, Value (USD Trillion)
- Saudi Arabia Market Value (USD Trillion) and CAGR & Y-o-Y Growth Trend, 2026-2035F
- UAE Market Value (USD Trillion) and CAGR & Y-o-Y Growth Trend, 2026-2035F
- Israel Market Value (USD Trillion) and CAGR & Y-o-Y Growth Trend, 2026-2035F
- Qatar Market Value (USD Trillion) and CAGR & Y-o-Y Growth Trend, 2026-2035F
- Kuwait Market Value (USD Trillion) and CAGR & Y-o-Y Growth Trend, 2026-2035F
- Oman Market Value (USD Trillion) and CAGR & Y-o-Y Growth Trend, 2026-2035F
- South Africa Market Value (USD Trillion) and CAGR & Y-o-Y Growth Trend, 2026-2035F
- Rest of Middle East & Africa Market Value (USD Trillion) and CAGR & Y-o-Y Growth Trend, 2026-2035F
- Overview
- Global Economic Scenario
- World Economic Outlook
- About Research Nester
- Our Global Clientele
- We Serve Clients Across World
Global Liquid Hydrocarbon Market
- An Outline of the Global Liquid Hydrocarbon Market
- Market Definition and Segmentation
- Study Assumptions and Abbreviations
- Research Methodology & Approach
- Primary Research
- Secondary Research
- Data Triangulation
- SPSS Methodology
- Executive Summary
- Growth Drivers
- Major Roadblocks
- Opportunities
- Prevalent Trends
- Government Regulation
- Growth Outlook
- Competitive White Space Analysis – Identifying Untapped Market Gaps
- Risk Overview
- SWOT
- Technological Advancement
- Technology Maturity Matrix for Liquid Hydrocarbon
- Recent News
- Regional Demand
- Global Liquid Hydrocarbon by Geography – Strategic Comparative Analysis
- Strategic Segment Analysis: Liquid Hydrocarbon Demand Landscape
- Global Liquid Hydrocarbon Demand Trends Driven by Safety, Vessel Management and Technological Advancements (2026-2035)
- Root Cause Analysis (RCA) for discovering problems of the Liquid Hydrocarbon Porter Five Forces
- PESTLE
- Comparative Positioning
- Liquid Hydrocarbon– Key Player Analysis (2035)
- Competitive Landscape: Key Suppliers/Players
- Competitive Model: A Detailed Inside View for Investors
- Company Market Share, 2035 (%)
- Business Profile of Key Enterprise
- ABB Marine & Ports
- Kongsberg Gruppen
- ORBCOMM
- Marine Traffic
- Navis
- Inmarsat
- Maersk Line
- Business Profile of Key Enterprise
- Global Liquid Hydrocarbon Market Outlook
- Market Overview
- Market Revenue by Value (USD Trillion), Volume (Trillion Tons), and Compound Annual Growth Rate (CAGR)
- Global Segmentation Liquid Hydrocarbon Analysis (2026-2035)
- By Component
- Hardware, Market Value (USD Trillion), and CAGR, 2026-2035F
- Software, Market Value (USD Trillion), and CAGR, 2026-2035F
- Service, Market Value (USD Trillion), and CAGR, 2026-2035F
- By Deployment Moel
- On-board, Market Value (USD Trillion), and CAGR, 2026-2035F
- Cloud based, Market Value (USD Trillion), and CAGR, 2026-2035F
- Hybrid, Market Value (USD Trillion), and CAGR, 2026-2035F
- By Technology
- Satellite and Communication, Market Value (USD Trillion), and CAGR, 2026-2035F
- Wireless Sensor Network, Market Value (USD Trillion), and CAGR, 2026-2035F
- Cloud Computing, Market Value (USD Trillion), and CAGR, 2026-2035F
- Machine Learning & Analytics, Market Value (USD Trillion), and CAGR, 2026-2035F
- Blockchain Technology, Market Value (USD Trillion), and CAGR, 2026-2035F
- By Application
- Vessel Tracking, Market Value (USD Trillion), and CAGR, 2026-2035F
- Predictive Maintenance, Market Value (USD Trillion), and CAGR, 2026-2035F
- Fleet Management, Market Value (USD Trillion), and CAGR, 2026-2035F
- Inventory Management, Market Value (USD Trillion), and CAGR, 2026-2035F
- Safety & Surveillance, Market Value (USD Trillion), and CAGR, 2026-2035F
- Others, Market Value (USD Trillion), and CAGR, 2026-2035F
- Regional Synopsis, Value (USD Trillion), 2026-2035
- North America Market Value (USD Trillion) and CAGR & Y-o-Y Growth Trend, 2026-2035F
- Europe Market Value (USD Trillion) and CAGR & Y-o-Y Growth Trend, 2026-2035F
- Asia Pacific Market Value (USD Trillion) and CAGR & Y-o-Y Growth Trend, 2026-2035F
- Latin America Market Value (USD Trillion) and CAGR & Y-o-Y Growth Trend, 2026-2035F
- Middle East and Africa Market Value (USD Trillion) and CAGR & Y-o-Y Growth Trend, 2026-2035F
- By Component
- Market Overview
- North America Market
- Overview
- Market Value (USD Trillion), Current and Future Projections, 2026-2035
- Increment $ Opportunity Assessment, 2026-2035
- Segmentation (USD Trillion), 2026-2035, By
-
- By Component
- Hardware, Market Value (USD Trillion), and CAGR, 2026-2035F
- Software, Market Value (USD Trillion), and CAGR, 2026-2035F
- Service, Market Value (USD Trillion), and CAGR, 2026-2035F
- By Deployment Moel
- On-board, Market Value (USD Trillion), and CAGR, 2026-2035F
- Cloud based, Market Value (USD Trillion), and CAGR, 2026-2035F
- Hybrid, Market Value (USD Trillion), and CAGR, 2026-2035F
- By Technology
- Satellite and Communication, Market Value (USD Trillion), and CAGR, 2026-2035F
- Wireless Sensor Network, Market Value (USD Trillion), and CAGR, 2026-2035F
- Cloud Computing, Market Value (USD Trillion), and CAGR, 2026-2035F
- Machine Learning & Analytics, Market Value (USD Trillion), and CAGR, 2026-2035F
- Blockchain Technology, Market Value (USD Trillion), and CAGR, 2026-2035F
- By Application
- Vessel Tracking, Market Value (USD Trillion), and CAGR, 2026-2035F
- Predictive Maintenance, Market Value (USD Trillion), and CAGR, 2026-2035F
- Fleet Management, Market Value (USD Trillion), and CAGR, 2026-2035F
- Inventory Management, Market Value (USD Trillion), and CAGR, 2026-2035F
- Safety & Surveillance, Market Value (USD Trillion), and CAGR, 2026-2035F
- Others, Market Value (USD Trillion), and CAGR, 2026-2035F
- Country Level Analysis, Value (USD Trillion)
- U.S. Market Value (USD Trillion) and CAGR & Y-o-Y Growth Trend, 2026-2035F
- Canada Market Value (USD Trillion) and CAGR & Y-o-Y Growth Trend, 2026-2035F
- By Component
- Overview
- Europe Market
- Overview
- Market Value (USD Trillion), Current and Future Projections, 2026-2035
- Increment $ Opportunity Assessment, 2026-2035
- Segmentation (USD Trillion), 2026-2035, By
-
- By Component
- Hardware, Market Value (USD Trillion), and CAGR, 2026-2035F
- Software, Market Value (USD Trillion), and CAGR, 2026-2035F
- Service, Market Value (USD Trillion), and CAGR, 2026-2035F
- By Deployment Moel
- On-board, Market Value (USD Trillion), and CAGR, 2026-2035F
- Cloud based, Market Value (USD Trillion), and CAGR, 2026-2035F
- Hybrid, Market Value (USD Trillion), and CAGR, 2026-2035F
- By Technology
- Satellite and Communication, Market Value (USD Trillion), and CAGR, 2026-2035F
- Wireless Sensor Network, Market Value (USD Trillion), and CAGR, 2026-2035F
- Cloud Computing, Market Value (USD Trillion), and CAGR, 2026-2035F
- Machine Learning & Analytics, Market Value (USD Trillion), and CAGR, 2026-2035F
- Blockchain Technology, Market Value (USD Trillion), and CAGR, 2026-2035F
- By Application
- Vessel Tracking, Market Value (USD Trillion), and CAGR, 2026-2035F
- Predictive Maintenance, Market Value (USD Trillion), and CAGR, 2026-2035F
- Fleet Management, Market Value (USD Trillion), and CAGR, 2026-2035F
- Inventory Management, Market Value (USD Trillion), and CAGR, 2026-2035F
- Safety & Surveillance, Market Value (USD Trillion), and CAGR, 2026-2035F
- Others, Market Value (USD Trillion), and CAGR, 2026-2035F
- Country Level Analysis, Value (USD Trillion)
- UK Market Value (USD Trillion) and CAGR & Y-o-Y Growth Trend, 2026-2035F
- Germany Market Value (USD Trillion) and CAGR & Y-o-Y Growth Trend, 2026-2035F
- France Market Value (USD Trillion) and CAGR & Y-o-Y Growth Trend, 2026-2035F
- Italy Market Value (USD Trillion) and CAGR & Y-o-Y Growth Trend, 2026-2035F
- Spain Market Value (USD Trillion) and CAGR & Y-o-Y Growth Trend, 2026-2035F
- Netherlands Market Value (USD Trillion) and CAGR & Y-o-Y Growth Trend, 2026-2035F
- Russia Market Value (USD Trillion) and CAGR & Y-o-Y Growth Trend, 2026-2035F
- Switzerland Market Value (USD Trillion) and CAGR & Y-o-Y Growth Trend, 2026-2035F
- Poland Market Value (USD Trillion) and CAGR & Y-o-Y Growth Trend, 2026-2035F
- Belgium Market Value (USD Trillion) and CAGR & Y-o-Y Growth Trend, 2026-2035F
- Rest of Europe Market Value (USD Trillion) and CAGR & Y-o-Y Growth Trend, 2026-2035F
- By Component
- Overview
- Asia Pacific Market
- Overview
- Market Value (USD Trillion), Current and Future Projections, 2026-2035
- Increment $ Opportunity Assessment, 2026-2035
- Segmentation (USD Trillion), 2026-2035, By
-
- By Component
- Hardware, Market Value (USD Trillion), and CAGR, 2026-2035F
- Software, Market Value (USD Trillion), and CAGR, 2026-2035F
- Service, Market Value (USD Trillion), and CAGR, 2026-2035F
- By Deployment Moel
- On-board, Market Value (USD Trillion), and CAGR, 2026-2035F
- Cloud based, Market Value (USD Trillion), and CAGR, 2026-2035F
- Hybrid, Market Value (USD Trillion), and CAGR, 2026-2035F
- By Technology
- Satellite and Communication, Market Value (USD Trillion), and CAGR, 2026-2035F
- Wireless Sensor Network, Market Value (USD Trillion), and CAGR, 2026-2035F
- Cloud Computing, Market Value (USD Trillion), and CAGR, 2026-2035F
- Machine Learning & Analytics, Market Value (USD Trillion), and CAGR, 2026-2035F
- Blockchain Technology, Market Value (USD Trillion), and CAGR, 2026-2035F
- By Application
- Vessel Tracking, Market Value (USD Trillion), and CAGR, 2026-2035F
- Predictive Maintenance, Market Value (USD Trillion), and CAGR, 2026-2035F
- Fleet Management, Market Value (USD Trillion), and CAGR, 2026-2035F
- Inventory Management, Market Value (USD Trillion), and CAGR, 2026-2035F
- Safety & Surveillance, Market Value (USD Trillion), and CAGR, 2026-2035F
- Others, Market Value (USD Trillion), and CAGR, 2026-2035F
- Country Level Analysis, Value (USD Trillion)
- China Market Value (USD Trillion) and CAGR & Y-o-Y Growth Trend, 2026-2035F
- India Market Value (USD Trillion) and CAGR & Y-o-Y Growth Trend, 2026-2035F
- South Korea Market Value (USD Trillion) and CAGR & Y-o-Y Growth Trend, 2026-2035F
- Australia Market Value (USD Trillion) and CAGR & Y-o-Y Growth Trend, 2026-2035F
- Indonesia Market Value (USD Trillion) and CAGR & Y-o-Y Growth Trend, 2026-2035F
- Malaysia Market Value (USD Trillion) and CAGR & Y-o-Y Growth Trend, 2026-2035F
- Vietnam Market Value (USD Trillion) and CAGR & Y-o-Y Growth Trend, 2026-2035F
- Thailand Market Value (USD Trillion) and CAGR & Y-o-Y Growth Trend, 2026-2035F
- Singapore Market Value (USD Trillion) and CAGR & Y-o-Y Growth Trend, 2026-2035F
- New Zeeland Market Value (USD Trillion) and CAGR & Y-o-Y Growth Trend, 2026-2035F
- Rest of Asia Pacific Excluding Japan Market Value (USD Trillion) and CAGR & Y-o-Y Growth Trend, 2026-2035F
- By Component
- Overview
- Latin America Market
- Overview
- Market Value (USD Trillion), Current and Future Projections, 2026-2035
- Increment $ Opportunity Assessment, 2026-2035
- Year-on-Year Growth Forecast (%)
- Segmentation (USD Trillion), 2026-2035, By
-
- By Component
- Hardware, Market Value (USD Trillion), and CAGR, 2026-2035F
- Software, Market Value (USD Trillion), and CAGR, 2026-2035F
- Service, Market Value (USD Trillion), and CAGR, 2026-2035F
- By Deployment Moel
- On-board, Market Value (USD Trillion), and CAGR, 2026-2035F
- Cloud based, Market Value (USD Trillion), and CAGR, 2026-2035F
- Hybrid, Market Value (USD Trillion), and CAGR, 2026-2035F
- By Technology
- Satellite and Communication, Market Value (USD Trillion), and CAGR, 2026-2035F
- Wireless Sensor Network, Market Value (USD Trillion), and CAGR, 2026-2035F
- Cloud Computing, Market Value (USD Trillion), and CAGR, 2026-2035F
- Machine Learning & Analytics, Market Value (USD Trillion), and CAGR, 2026-2035F
- Blockchain Technology, Market Value (USD Trillion), and CAGR, 2026-2035F
- By Application
- Vessel Tracking, Market Value (USD Trillion), and CAGR, 2026-2035F
- Predictive Maintenance, Market Value (USD Trillion), and CAGR, 2026-2035F
- Fleet Management, Market Value (USD Trillion), and CAGR, 2026-2035F
- Inventory Management, Market Value (USD Trillion), and CAGR, 2026-2035F
- Safety & Surveillance, Market Value (USD Trillion), and CAGR, 2026-2035F
- Others, Market Value (USD Trillion), and CAGR, 2026-2035F
- Country Level Analysis, Value (USD Trillion)
- Brazil Market Value (USD Trillion) and CAGR & Y-o-Y Growth Trend, 2026-2035F
- Argentina Market Value (USD Trillion) and CAGR & Y-o-Y Growth Trend, 2026-2035F
- Mexico Market Value (USD Trillion) and CAGR & Y-o-Y Growth Trend, 2026-2035F
- Rest of Latin America Market Value (USD Trillion) and CAGR & Y-o-Y Growth Trend, 2026-2035F
- By Component
- Overview
- Middle East & Africa Market
- Overview
- Market Value (USD Trillion), Current and Future Projections, 2026-2035
- Increment $ Opportunity Assessment, 2026-2035
- Year-on-Year Growth Forecast (%)
-
- By Component
- Hardware, Market Value (USD Trillion), and CAGR, 2026-2035F
- Software, Market Value (USD Trillion), and CAGR, 2026-2035F
- Service, Market Value (USD Trillion), and CAGR, 2026-2035F
- By Deployment Moel
- On-board, Market Value (USD Trillion), and CAGR, 2026-2035F
- Cloud based, Market Value (USD Trillion), and CAGR, 2026-2035F
- Hybrid, Market Value (USD Trillion), and CAGR, 2026-2035F
- By Technology
- Satellite and Communication, Market Value (USD Trillion), and CAGR, 2026-2035F
- Wireless Sensor Network, Market Value (USD Trillion), and CAGR, 2026-2035F
- Cloud Computing, Market Value (USD Trillion), and CAGR, 2026-2035F
- Machine Learning & Analytics, Market Value (USD Trillion), and CAGR, 2026-2035F
- Blockchain Technology, Market Value (USD Trillion), and CAGR, 2026-2035F
- By Application
- Vessel Tracking, Market Value (USD Trillion), and CAGR, 2026-2035F
- Predictive Maintenance, Market Value (USD Trillion), and CAGR, 2026-2035F
- Fleet Management, Market Value (USD Trillion), and CAGR, 2026-2035F
- Inventory Management, Market Value (USD Trillion), and CAGR, 2026-2035F
- Safety & Surveillance, Market Value (USD Trillion), and CAGR, 2026-2035F
- Others, Market Value (USD Trillion), and CAGR, 2026-2035F
- Country Level Analysis, Value (USD Trillion)
- Saudi Arabia Market Value (USD Trillion) and CAGR & Y-o-Y Growth Trend, 2026-2035F
- UAE Market Value (USD Trillion) and CAGR & Y-o-Y Growth Trend, 2026-2035F
- Israel Market Value (USD Trillion) and CAGR & Y-o-Y Growth Trend, 2026-2035F
- Qatar Market Value (USD Trillion) and CAGR & Y-o-Y Growth Trend, 2026-2035F
- Kuwait Market Value (USD Trillion) and CAGR & Y-o-Y Growth Trend, 2026-2035F
- Oman Market Value (USD Trillion) and CAGR & Y-o-Y Growth Trend, 2026-2035F
- South Africa Market Value (USD Trillion) and CAGR & Y-o-Y Growth Trend, 2026-2035F
- Rest of Middle East & Africa Market Value (USD Trillion) and CAGR & Y-o-Y Growth Trend, 2026-2035F
- By Component
- Overview
- Global Economic Scenario
- World Economic Outlook
- About Research Nester
- Our Global Clientele
- We Serve Clients Across World
Liquid Hydrocarbon Market Outlook:
Liquid Hydrocarbon Market size is valued at USD 5.9 trillion in 2025 and is expected to grow to USD 10.2 trillion by 2035, registering a CAGR of 5.7% through the forecast period, i.e., 2026-2035. In 2026, the industry size of liquid hydrocarbon is assessed at USD 6.2 trillion.
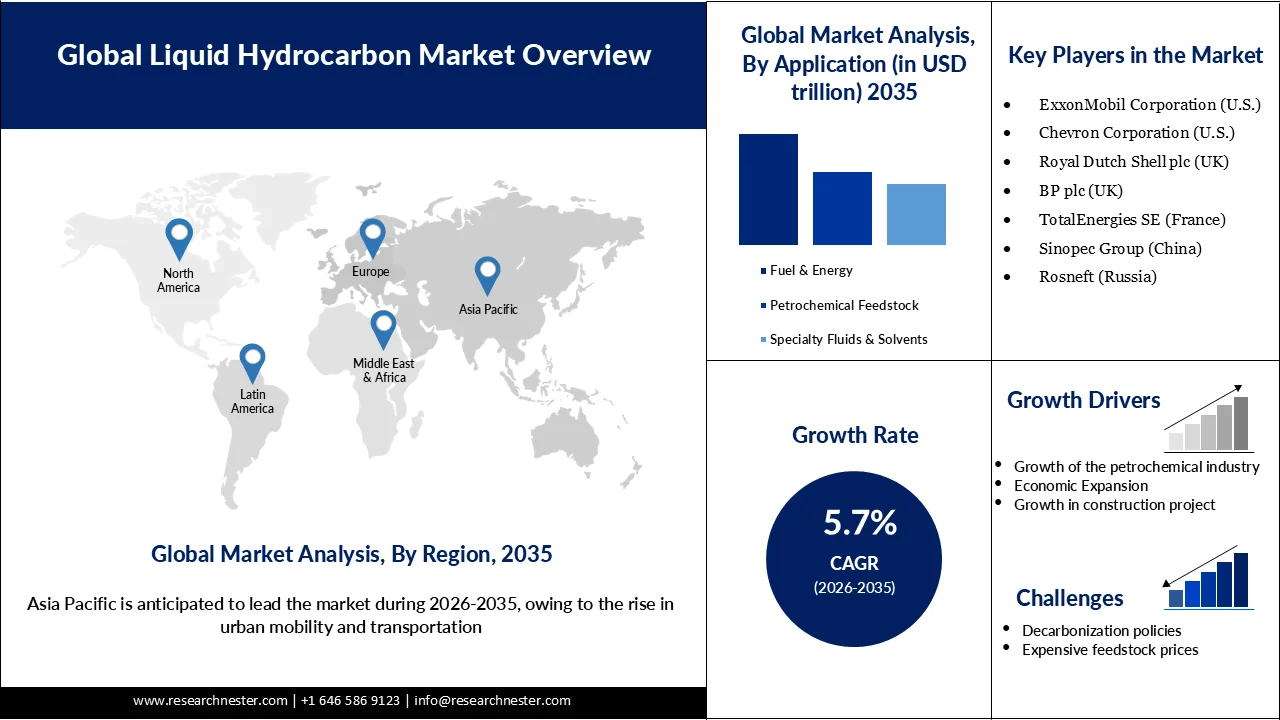
The rising demand for urban mobility and transportation is a major driver of growth in the market. As urban populations expand, mobility needs intensify, leading to higher consumption of transport fuels. According to the UN Environment Program, 95% of the world’s transport energy still comes from fossil fuels, underscoring the sector’s dependence on liquid hydrocarbons despite advances in electrification. The International Energy Forum highlights that global transportation demand is projected to grow significantly due to urbanization and economic expansion, requiring vast infrastructure and energy inputs. The International Energy Agency reports that transport emissions grew at an average of 1.7% annually from 1990 to 2022, faster than most other sectors, reflecting the surge in fuel use. This steady increase in passenger and freight activity directly accelerates demand for gasoline, diesel, and jet fuel, reinforcing the central role of liquid hydrocarbons in meeting urban mobility needs. While electrification is advancing, the scale of urban transport growth ensures hydrocarbons remain dominant in the near term.
Key Liquid Hydrocarbon Market Insights Summary:
Regional Highlights:
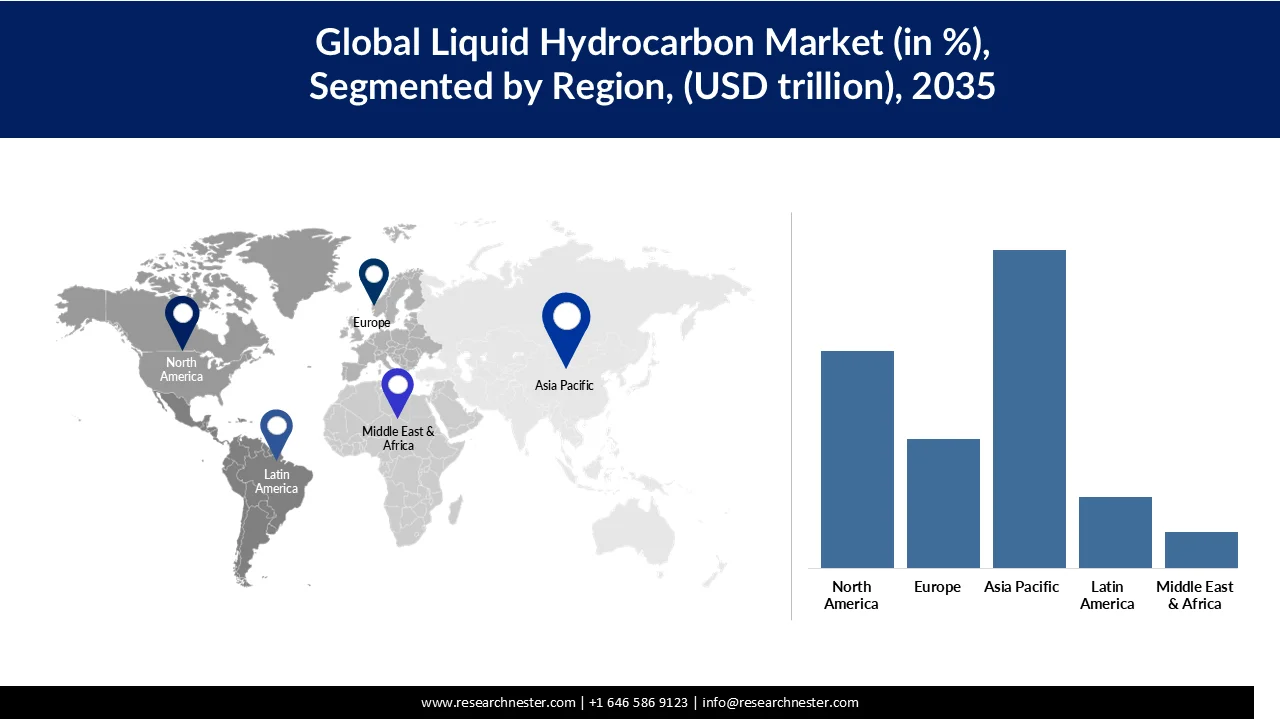
- Asia Pacific is projected to command a 44.7% share of the liquid hydrocarbon market by 2035, propelled by rising urban mobility and rapid infrastructural development.
- North America is anticipated to account for a 30.5% share by 2035, attributed to rising population growth and increasing demand for residential housing.
Segment Insights:
- In the liquid hydrocarbon market, the crude oil segment is expected to hold a dominant 60% share by 2035, driven by its use in various chemicals.
- The fuel & energy segment is projected to capture around 45% share by 2035, impelled by sustained demand for petroleum and diesel in vehicles and grid generators.
Key Growth Trends:
- Growth of the petrochemical industry
- Economic expansion
Major Challenges:
- Decarbonization policies
- Expensive feedstock prices
Key Players: ExxonMobil Corporation (U.S.), Chevron Corporation (U.S.), Royal Dutch Shell plc (UK), BP plc (UK), TotalEnergies SE (France), Sinopec Group (China), Rosneft (Russia), Kuwait Petroleum Corporation (Kuwait), ONGC (India), PetroChina (China).
Global Liquid Hydrocarbon Market Forecast and Regional Outlook:
Market Size & Growth Projections:
- 2025 Market Size: USD 5.9 trillion
- 2026 Market Size: USD 6.2 trillion
- Projected Market Size: USD 10.2 trillion by 2035
- Growth Forecasts: 5.7% CAGR (2026-2035)
Key Regional Dynamics:
- Largest Region: Asia Pacific (44.7% Share by 2035)
- Fastest Growing Region: North America
- Dominating Countries: United States, China, India, Russia, Saudi Arabia
- Emerging Countries: Brazil, Indonesia, Vietnam, Mexico, United Arab Emirates
Last updated on : 25 February, 2026
Liquid Hydrocarbon Market - Growth Drivers and Challenges
Growth Drivers
- Growth of the petrochemical industry: The petrochemical industry is expanding rapidly across regions, fueling the growth of the liquid hydrocarbon market. Petrochemicals, derived largely from natural gas and crude oil, are essential feedstocks for plastics, synthetic rubbers, and countless industrial chemicals. According to the International Energy Agency (IEA), global petrochemical capacity is projected to increase by more than 15 million tons per year between 2019 and 2024, with China and the Middle East leading the surge. The U.S. Energy Information Administration (EIA) notes that petrochemicals already account for about 14% of global oil demand, and this share is expected to rise as demand for plastics and synthetic materials grows. In automotive manufacturing, synthetic rubbers used in tires, seals, and door stoppers are key drivers of consumption, while packaging and consumer goods industries further amplify demand. India’s petrochemical sector, for example, is highlighted by government-backed initiatives to meet rising domestic consumption of plastics and chemicals, reinforcing hydrocarbons’ central role in industrial growth, according to IBEF. Together, these trends show how petrochemical expansion is tightly linked to liquid hydrocarbon demand worldwide.
Growth in Regional Petrochemicals Capacity, 2019-2024 (Mt/Year)
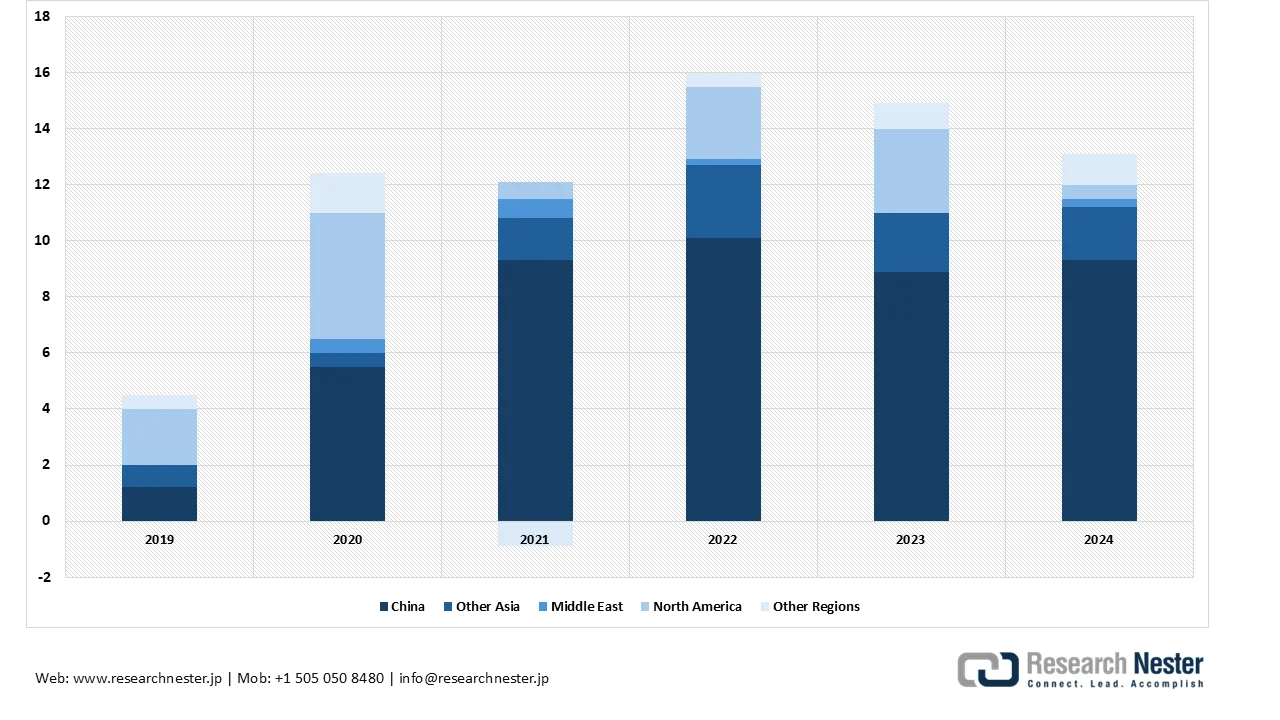
Source: iea.org
- Economic expansion: As economies grow, energy-intensive sectors such as manufacturing, petrochemicals, and logistics expand, requiring more oil and gas inputs. The U.S. Energy Information Administration (EIA) notes that global oil demand is projected to rise by 1.2 million barrels per day in 2026 and 1.3 million barrels per day in 2027, largely due to economic growth in emerging markets. Similarly, the United Nations’ World Economic Situation and Prospects report highlights that rising GDP in developing regions correlates strongly with higher energy consumption, especially hydrocarbons, which remain the backbone of industrial and transport systems. Expanding middle classes also drive demand for automobiles, plastics, and consumer goods, all of which rely on petrochemical derivatives. This cycle of growth, more production, more transport, more consumption, creates a reinforcing loop that accelerates the expansion of the market worldwide.
- Growth in construction projects: Construction activity acts as a powerful catalyst for the liquid hydrocarbon market because the sector consumes large amounts of energy and petrochemical-derived materials. The UN Environment Program’s Global Status Report for Buildings and Construction 2024/2025 highlights that the construction sector accounts for over 32% of global energy demand and nearly 34% of energy-related CO₂ emissions, much of which comes from fossil fuels used in materials production and transport. Expanding infrastructure projects increase the need for plastics, paints, adhesives, and synthetic rubbers, all of which are derived from hydrocarbons. The International Energy Agency emphasizes that cement, steel, and petrochemical-based products remain central to construction growth, reinforcing hydrocarbons’ role as feedstocks. As urbanization accelerates in regions such as Asia and Africa, the surge in housing, commercial buildings, and infrastructure projects amplifies hydrocarbon consumption, both directly (fuel for machinery and transport) and indirectly (materials manufacturing), making construction growth a key driver of market expansion.
Challenges
- Decarbonization policies: Government-led sustainability frameworks are increasingly restricting the adoption of liquid hydrocarbons, even though they are relatively lower in emissions compared to some alternatives. Regulatory measures encourage manufacturers to innovate by developing processes that capture or substitute carbon with safer alternatives. However, the high cost of research and the complexity of innovation often slow progress, creating barriers to adoption in certain regions. This regulatory pressure is reshaping market dynamics, pushing companies toward greener solutions while limiting traditional hydrocarbon growth.
- Expensive feedstock prices: Volatility in essential feedstocks such as naphtha and ethane poses a significant challenge for liquid hydrocarbon producers. Rising natural gas prices further constrain production capacity, leading to higher costs across the supply chain. As production slows and prices rise, consumers increasingly explore alternatives such as non-gasoline-based vehicles, which offer both cost savings and sustainability benefits. This shift not only impacts demand for hydrocarbons but also accelerates the transition toward cleaner energy sources, reshaping the competitive landscape of the market.
Liquid Hydrocarbon Market Size and Forecast:
| Report Attribute | Details |
|---|---|
|
Base Year |
2025 |
|
Forecast Year |
2026-2035 |
|
CAGR |
5.7% |
|
Base Year Market Size (2025) |
USD 5.9 trillion |
|
Forecast Year Market Size (2035) |
USD 10.2 trillion |
|
Regional Scope |
|
Liquid Hydrocarbon Market Segmentation:
Type Segment Analysis
The crude oil segment is expected to hold a share of 60% by the end of 2035, owing to its use in various chemicals. Data from the U.S. Energy Information Administration (EIA) shows that U.S. crude oil production averaged 12.9 million barrels per day in 2023, making the country the world’s largest producer. This steady output feeds into refining operations that supply gasoline, diesel, jet fuel, and petrochemical feedstocks, all of which are critical components of the broader liquid hydrocarbon market. Moreover, rising production volumes combined with resilient pricing ensure that crude oil remains the dominant input, supporting downstream growth in fuels and chemicals. As transportation, petrochemicals, and industrial sectors continue to expand, the crude oil sub‑segment sustains momentum for the entire type segment, reinforcing its central role in U.S. hydrocarbon market growth.
Application Segment Analysis
The fuel & energy segment is projected to hold the largest share of around 45% by 2035, driven by the sustained demand for petroleum and diesel in vehicles and grid generators. Rising ownership of personal mobility has expanded the scope of this segment, as transportation systems remain heavily dependent on gasoline and diesel. In addition, the aviation industry is experiencing rapid growth, supported by increasing middle‑class travel, which has boosted flight frequencies and created strong demand for refined petroleum products such as jet fuel. Alongside this, the specialty fluids and solvents segment is expected to capture a significant share due to its critical applications in the pharmaceutical and agrochemical industries, where hydrocarbons serve as essential inputs for production. Together, these factors highlight how diverse end‑use sectors reinforce the expansion of the liquid hydrocarbon market.
End-user Segment Analysis
The transportation segment is projected to capture about 45% of the market by 2035, supported by rising urban mobility and population growth. In emerging economies, the rapid adoption of personal vehicles is fueling demand for advanced-grade petroleum products, which in turn accelerates market expansion. Manufacturing and logistics activities add further momentum, as both sectors rely heavily on hydrocarbon-based fuels for operations and distribution. At the same time, the military and defense segment is expected to grow significantly, driven by increased investments in defense equipment and armored vehicles that require high-quality gasoline and diesel. With governments prioritizing defense modernization, the need for reliable, refined fuels will remain persistent, reinforcing hydrocarbons’ role in sustaining both civilian and defense-related energy demands.
Our in-depth analysis of the global liquid hydrocarbons market includes the following segments:
|
Segments |
Subsegments |
|
Type |
|
|
Application |
|
|
End-user |
|

Vishnu Nair
Head - Global Business DevelopmentCustomize this report to your requirements — connect with our consultant for personalized insights and options.
Liquid Hydrocarbon Market - Regional Analysis
Asia Pacific Market Insights
The Asia Pacific market is projected to hold a share of 44.7% by 2035, driven by rising urban mobility and rapid infrastructural development. The region’s strong automotive base, with manufacturers continuing to prioritize traditional gasoline engines, further supports hydrocarbon demand. Asia Pacific’s dominance in the petrochemical industries enables low‑cost refining, which boosts exports and increases reliance on imports by other regions. With the highest global consumption of liquid fuels, the region’s expanding transportation networks and construction projects requiring raw material movement are key growth drivers.
China’s petrochemical industry is globally recognized for its scale and cost efficiency, making it a cornerstone of the Asia Pacific liquid hydrocarbon market. The country’s refining capacity is among the largest in the world, enabling low‑cost production that supports both domestic consumption and exports. Heavy reliance on liquid fuels such as gasoline and diesel continues due to the country’s vast transportation networks and growing urban mobility needs. With a population exceeding 1.4 billion, the demand for personal vehicles, public transit, and freight logistics places immense pressure on fuel consumption. Additionally, China’s industrial expansion, particularly in construction and manufacturing, requires significant volumes of petrochemical feedstocks, further reinforcing hydrocarbons’ role. Government initiatives to strengthen energy security and maintain refining competitiveness ensure that liquid hydrocarbons remain central to China’s economic growth, even as the country gradually explores cleaner alternatives.
India is rapidly emerging as a key growth driver in the liquid hydrocarbon market, propelled by its expanding manufacturing base and infrastructure development. New facilities and industrial hubs are being established across the country, creating strong demand for fuels used in both production and the transportation of raw materials. According to the Ministry of Statistics, India’s real GDP grew 7.4% in FY 2025‑26, up from 6.5% in FY 2024‑25, underscoring the rising contribution of manufacturing and construction to the economy. This economic momentum directly translates into higher consumption of petroleum products, particularly diesel and gasoline, which are essential for logistics and mobility. India’s growing population and urbanization trends further amplify demand for personal vehicles and public transport, both heavily dependent on hydrocarbons. At the same time, the government’s push for industrialization and infrastructure expansion, such as highways, housing, and smart cities, creates sustained demand for petrochemical derivatives like plastics, paints, and synthetic rubbers. Together, these factors position India as a critical market for liquid hydrocarbons in the region.
North America Market Insights
The region is expected to hold a 30.5% market share by the end of the forecast period, supported by rising population growth and increasing demand for residential housing. Government initiatives to accelerate public housing development are amplifying new building construction, which in turn drives logistics demand for raw material transportation and fuels hydrocarbon consumption. The region’s large‑scale petrochemical industry further boosts demand for high‑quality petroleum products, particularly aviation fuel. With numerous airports and extensive flight connectivity, the aviation sector adds another strong layer of demand for refined hydrocarbons.
The U.S. petrochemical industry is highly technology‑driven, with continuous innovation ensuring the production of high‑quality petrochemical products. Liquid hydrocarbons serve as a critical catalyst in this process, forming the backbone of plastics, solvents, and specialty chemicals. The steady demand for fine petroleum products from the petrochemical sector directly supports the expansion of the liquid hydrocarbon market. Moreover, the U.S. refining capacity and advanced infrastructure allow for efficient production and distribution, reinforcing hydrocarbons’ role in both domestic and global supply chains. As industrial activity and consumer demand remain strong, the petrochemical industry’s reliance on hydrocarbons will continue to propel market growth.
Canada is experiencing steady population growth, which is driving urban mobility and increasing reliance on hydrocarbon‑based fuels. Rising sustainability concerns have also amplified the adoption of liquid hydrocarbons, as they are perceived to be less polluting compared to certain chemical alternatives, making them attractive for industrial and transportation applications. Expanding industries within the country are boosting trade volumes, which directly increases demand for logistics and transportation. This heightened activity requires significant amounts of liquid fuel derived from hydrocarbons, reinforcing their importance in Canada’s economic and industrial landscape. The combination of population growth, sustainability considerations, and industrial expansion positions Canada as a key contributor to regional market growth.
Europe Market Insights
The Europe market is expected to hold a 18.1% share by 2035, supported by the region’s strong petrochemical industries that are innovating chemical processes to minimize emissions and align with sustainability goals. Europe’s robust regulatory frameworks are pushing manufacturers to enhance product quality and adopt cleaner technologies, which is driving innovation within liquid hydrocarbons. Vehicle manufacturers continue to retain gasoline and diesel engines to keep vehicles affordable for a wide consumer base, sustaining demand for fine petroleum. Rising urban mobility, fueled by population growth and expanding infrastructure, further strengthens the market outlook.
The UK has experienced steady population growth, which has increased the need for efficient transportation networks and diverse mobility options. Despite the government’s push toward electrification, gasoline and diesel-powered vehicles remain widely used, particularly in commercial fleets where the high upfront cost of electric vehicles limits adoption. Gasoline engines are favored for their lower maintenance requirements and simpler configurations, making them more accessible to consumers. Additionally, the country is witnessing a rise in construction projects to meet housing and infrastructure needs, which in turn drives demand for logistics and transportation services powered by liquid hydrocarbons. This combination of affordability, practicality, and expanding construction activity ensures hydrocarbons remain integral to the UK’s energy mix.
Germany, home to globally renowned automotive manufacturers, continues to rely heavily on gasoline-based engines due to challenges in transitioning to electric vehicles. Poor charging infrastructure and the added expense of home or public chargers increase the overall cost of EV ownership, discouraging widespread adoption. In contrast, gasoline-powered vehicles offer reduced maintenance costs and easy fuel availability, making them more attractive to consumers. Beyond transportation, Germany is also experiencing growth in public building projects to accommodate its rising population and address housing shortages. These developments increase demand for construction materials and logistics, both of which depend on liquid hydrocarbons. As a result, Germany’s automotive and construction sectors together reinforce the country’s reliance on hydrocarbons, supporting the broader European market expansion.
Key Liquid Hydrocarbon Market Players:
- ExxonMobil Corporation (U.S.)
- Chevron Corporation (U.S.)
- Royal Dutch Shell plc (UK)
- BP plc (UK)
- TotalEnergies SE (France)
- Sinopec Group (China)
- Rosneft (Russia)
- Kuwait Petroleum Corporation (Kuwait)
- ONGC (India)
- PetroChina (China)
- Company Overview
- Business Strategy
- Key Product Offerings
- Financial Performance
- Key Performance Indicators
- Risk Analysis
- Recent Development
- Regional Presence
- SWOT Analysis
- ExxonMobil Corporation is one of the largest crude oil producers across the globe, which also operates an extensive refinery plant for petrochemical products. It is also one of the major suppliers of refined fuel, base oil, and chemical feedstock. The firm further holds a global network of refineries, enabling a broader supply of its products.
- Chevron Corporation is one of the largest suppliers of crude oil, NGLs, and refined products. They operate as a major supplier of fuel for aviation and transportation. The refinery bases are located across the U.S., Kazakhstan, and the Middle East. It is also one of the largest suppliers of fuel for the energy sector
- Royal Dutch Shell plc, recognized as one of the largest fuel markets that also produces crude oil and refined fuels. It is a major supplier of advanced synthetic fuel for aviation and transportation. The business also plays a major role in connecting liquid hydrocarbon producers with end-user markets.
- BP plc is a leading producer of crude oil and liquid hydrocarbons that holds a strong position in the transportation fuel market. The business is a key player in Europe and Asia. It also ensures fuel trading and supply optimization of liquid fuel. It is also an active producer of petrochemical feedstock and specialty products.
Below is the list of the key players operating in the liquid hydrocarbon market:
The players operating in the global liquid hydrocarbon market are expected to face intense competition during the forecast period. The market is associated with both established key players and new entrants. However, the market is moderately fragmented. New entrants impose immense competition for the existing players, prohibiting them from acquiring the majority of the revenue share. Specialised manufacturers maintain a competitive landscape in the market. Key players in the market are significantly supported by the governments for research and innovation.
Competitive Landscape of the Liquid Hydrocarbon Market
Recent Developments
- In September 2025, ExxonMobil expanded its capacity in the seventh offshore development in Guyana. Hammerhead, the seventh project, Stabroek block, is expected to come into use by 2029. The Stabroek block development will increase the production capacity to 1500 barrels a day.
- In January 2026, ONGC and Reliance Industries agreed in collaboration to use an offshore asset. The initiative was primarily made to increase operational efficiency and enhance the energy security of India, and to accelerate the growth of hydrocarbon resources.
- Report ID: 8404
- Published Date: Feb 25, 2026
- Report Format: PDF, PPT
- Explore a preview of key market trends and insights
- Review sample data tables and segment breakdowns
- Experience the quality of our visual data representations
- Evaluate our report structure and research methodology
- Get a glimpse of competitive landscape analysis
- Understand how regional forecasts are presented
- Assess the depth of company profiling and benchmarking
- Preview how actionable insights can support your strategy
Explore real data and analysis
Frequently Asked Questions (FAQ)
About this Report
Connect with our Expert

Report, 2026-2035


Copyright @ 2026 Research Nester. All Rights Reserved.
