Industrial Power System Market Outlook:
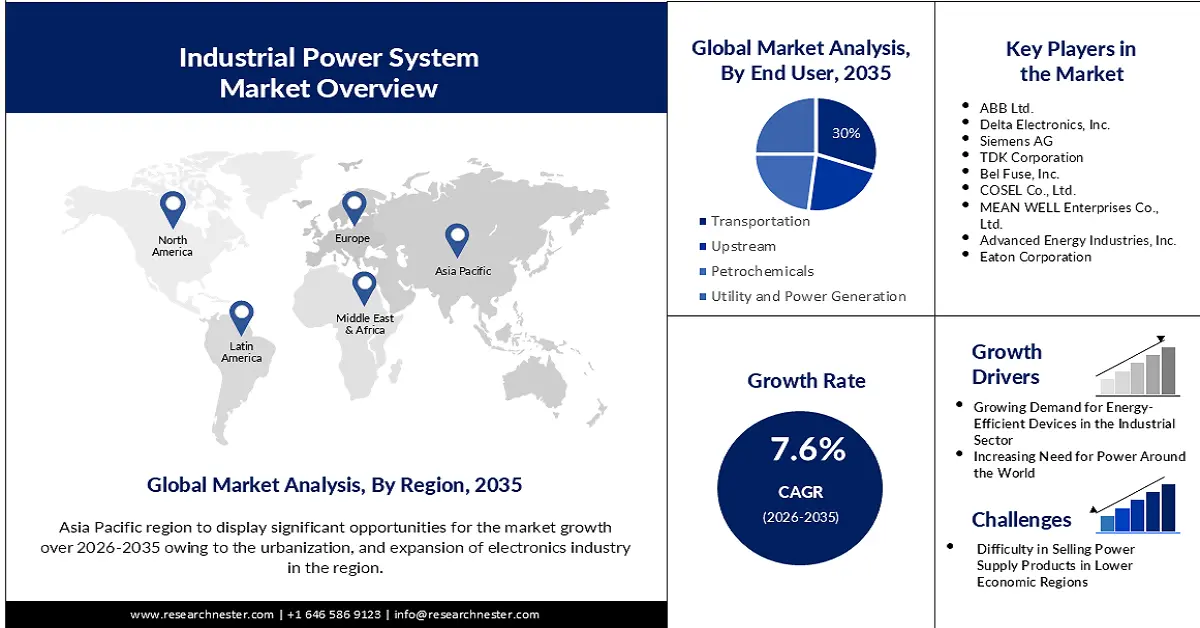
Industrial Power System Market size was over USD 13.54 billion in 2025 and is projected to reach USD 28.17 billion by 2035, growing at around 7.6% CAGR during the forecast period i.e., between 2026-2035. In the year 2026, the industry size of industrial power system is assessed at USD 14.47 billion.
The growth of the market can be attributed to the increasing energy supply, and energy management systems worldwide over the upcoming decades. In 2019, the world’s total energy supply was 606EJ, wherein the highest share in terms of the source was captured by oil, accounting for 30.9%, followed by coal (26.8%), natural gas (23.2%), biofuels and waste (9.4%), nuclear (5.0%), hydro (2.5%), and other (2.2%).
Moreover, rising environmental degradation and awareness related to climate change are motivating many key players to employ sustainable energy strategies and invest significantly in environment-friendly power generation technologies with an aim to promote sustainable development among various nations around the world. Such factors are anticipated to promote the growth of the market in the upcoming years.
Key Industrial Power System Market Insights Summary:
Regional Highlights:
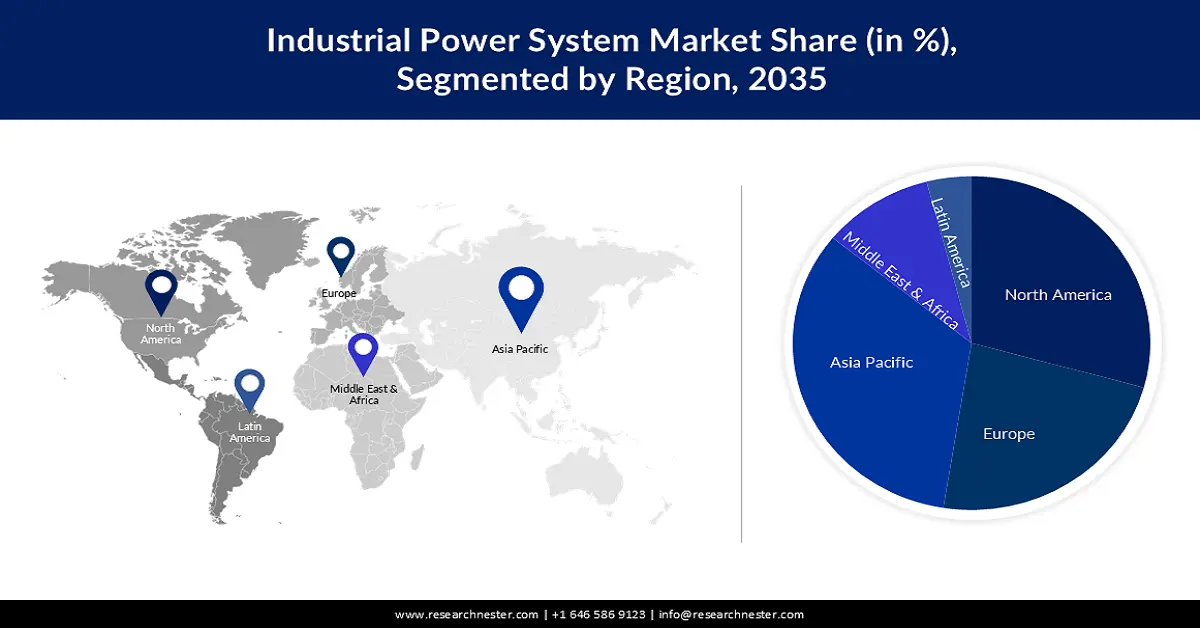
- Asia Pacific is anticipated to command a 33% share by 2035 in the industrial power system market, supported by surging industrialization, rapid urbanization, and expanding consumer electronics industries across the region.
- North America is projected to secure a substantial share by 2035, fueled by rising demand for industrial power supply and the robust presence of leading market participants.
Segment Insights:
- The transportation segment in the industrial power system market is poised to capture a 30% share by 2035, underpinned by the increasing reliance on a wide spectrum of energy sources for transportation.
- The SCADA segment is expected to witness notable expansion through 2035, bolstered by its essential role in enabling real-time monitoring and coordinated operation of complex energy systems.
Key Growth Trends:
- Growing Demand for Energy Efficient Devices in the Industrial Sector
- Rising Expenditure in Energy Efficient Projects and Initiatives
Major Challenges:
- Difficulty in Selling Power Supply Products in Lower Economic Regions
- Harmful Gases Release When Heated
Key Players: XP Power, ABB Ltd., Delta Electronics, Inc., Siemens AG, TDK Corporation, Bel Fuse, Inc., COSEL Co., Ltd., MEAN WELL Enterprises Co., Ltd., Advanced Energy Industries, Inc., Eaton Corporation.
Global Industrial Power System Market Forecast and Regional Outlook:
Market Size & Growth Projections:
- 2025 Market Size: USD 13.54 billion
- 2026 Market Size: USD 14.47 billion
- Projected Market Size: USD 28.17 billion by 2035
- Growth Forecasts: 7.6%
Key Regional Dynamics:
- Largest Region: Asia Pacific (33% Share by 2035)
- Fastest Growing Region: Asia Pacific
- Dominating Countries: United States, China, Germany, Japan, South Korea
- Emerging Countries: India, Brazil, Indonesia, Mexico, UAE
Last updated on : 20 November, 2025
Industrial Power System Market - Growth Drivers and Challenges
Growth Drivers
- Growing Demand for Energy-Efficient Devices in the Industrial Sector- The development of energy-efficient equipment is projected to drive market expansion in the future decades. For instance, Israel's Minister of Energy and Infrastructure, Israel Katz, posed an appeal to the Knesset's Economy Committee to implement the European standard as the sole rule for the arrival of electric equipment into Israel in May 2023.
- Rising Expenditure in Energy Efficient Projects and Initiatives- New requirements are expected to result in USD 80 billion in energy efficiency expenditures every year through 2020, saving between $40 billion and $190 billion in fuel expenses.
- Expanding Growth in the Gas and Oil Industry- The overall revenue of the United States' oil and gas sector in 2021 was approximately 211.9 billion US dollars, a rise from the year before when the industry was hit by the coronavirus epidemic.
- Rising Revenue in Petrochemical Sector- According to Statista, petrochemicals accounted for approximately 16 percent of OECD oil demand in 2020. The market revenues for petrochemicals surpassed 556 billion US dollars in 2021. It is anticipated to increase greatly by 2030, with China, India, and Iran having declared or set up the most substantial petrochemical potential expansions.
Challenges
- Difficulty in Selling Power Supply Products in Lower Economic Regions
- Harmful Gases Release When Heated
- The Accessibility of Inexpensive Items- The market for industrial power system is extremely competitive with numerous local and foreign companies. Product quality is a key factor in differentiating one's company from the competition. Most countries' domestic manufacturers compete fiercely with worldwide providers in their individual markets by producing low-cost, low-quality power supply equipment that produces hazardous emissions when heated or subjected to fire.
Industrial Power System Market Size and Forecast:
| Report Attribute | Details |
|---|---|
|
Base Year |
2025 |
|
Forecast Year |
2026-2035 |
|
CAGR |
7.6% |
|
Base Year Market Size (2025) |
USD 13.54 billion |
|
Forecast Year Market Size (2035) |
USD 28.17 billion |
|
Regional Scope |
|
Industrial Power System Market Segmentation:
End User Segment Analysis
The transportation segment in the industrial power system market is projected to have the largest share of 30% in 2035. Globally, a broad range of energy sources (or fuels) are employed for transportation, which is likely to drive the market expansion of the transportation segment in the future decades. As per the report published by U.S. Energy Information Administration, petroleum-derived goods accounted for almost 90% of total transportation sector power consumption in the United States in 2021. Biofuels made for around 6% of the total. Natural gas comprised roughly 4%, with the majority of it employed in natural gas pipeline compressors. Electricity consumption by mass transit systems accounted for less than 1% of the overall transportation business energy consumption.
Technology Segment Analysis
The SCADA segment is expected to increase significantly in the industrial power system market. This is mostly owing to the fact that it offers a snapshot of plant processes and allows for the cooperation of functioning amongst low-level controllers. Furthermore, the system necessitates a continuous source of power and a safe atmosphere in order to monitor the status of complex energy systems in real time. It is also necessary for monitoring and controlling remote systems.
Our in-depth analysis of the global market includes the following segments:
|
Type |
|
|
Technology
|
|
|
End User |
|

Vishnu Nair
Head - Global Business DevelopmentCustomize this report to your requirements — connect with our consultant for personalized insights and options.
Industrial Power System Market - Regional Analysis
APAC Market Insights
Asia Pacific industry is anticipated to hold largest revenue share of 33% by 2035, on the back of the rapidly growing industrialization, urbanization, and expansion of the consumer electronics industry in the region. For instance, more than 77 percent of the total population of Malaysia lived in urban areas in 2020, up from about 76 percent in the year 2019. In addition, an increasing number of government initiatives to raise the efficiency of industrial processes are also expected to bolster market growth in the region in the coming years. According to an action plan for energy cooperation, Asia aims to increase the share of renewable sources of energy in its energy combination to 23% by 2025. Furthermore, by early 2020, renewable energy accounted for approximately 40% of China's total installed electric power output and 26% of total power production. It had expanded to 29.4% of the overall power generation by 2021.
North American Market Insights
Moreover, the industrial power system market in North America is projected to grab the largest share during the forecast period ascribing to the growing demand for industrial power supply for delivering power to the strong presence of major market players in the region. Also, as a result of higher expenditures in automotive projects and the emergence of power generation sectors, North America is predicted to be the second-fastest expanding market. According to the Energy Information Administration, natural gas was the primary source of power generation in the United States in 2021, accounting for around 38% of total generation. Natural gas is utilized to create energy in steam turbines and gas turbines. Coal was the second-biggest energy source for US power generation in 2021, accounting for around 22% of total production.
Industrial Power System Market Players:
- XP Power
- Company Overview
- Business Strategy
- Key Product Offerings
- Financial Performance
- Key Performance Indicators
- Risk Analysis
- Recent Development
- Regional Presence
- SWOT Analysis
- ABB Ltd.
- Delta Electronics, Inc.
- Siemens AG
- TDK Corporation
- Bel Fuse, Inc.
- COSEL Co., Ltd.
- MEAN WELL Enterprises Co., Ltd.
- Advanced Energy Industries, Inc.
- Eaton Corporation
Recent Developments
-
ABB Ltd. India announced that it will deliver next-generation digital technology for power supply in Indore that is predicted to enable the continuous supply of electricity to businesses and homes
-
Siemens AG declared to build an industrial power plant for a combined cycle power facility for Evonik in North Rhine-Westphalia, Germany.
- Report ID: 3843
- Published Date: Nov 20, 2025
- Report Format: PDF, PPT
- Explore a preview of key market trends and insights
- Review sample data tables and segment breakdowns
- Experience the quality of our visual data representations
- Evaluate our report structure and research methodology
- Get a glimpse of competitive landscape analysis
- Understand how regional forecasts are presented
- Assess the depth of company profiling and benchmarking
- Preview how actionable insights can support your strategy
Explore real data and analysis
Frequently Asked Questions (FAQ)
About this Report
Connect with our Expert

Report, 2026-2035


Copyright @ 2026 Research Nester. All Rights Reserved.
