Coal Tar Pitch Market Outlook:
Coal Tar Pitch Market was valued at USD 4.4 billion in 2025 and is projected to reach USD 5.4 billion by 2035, growing at a CAGR of 5.5% during the forecast period from 2026 to 2035. In 2026, the industry size of coal tar pitch is assessed at USD 4.7 billion.
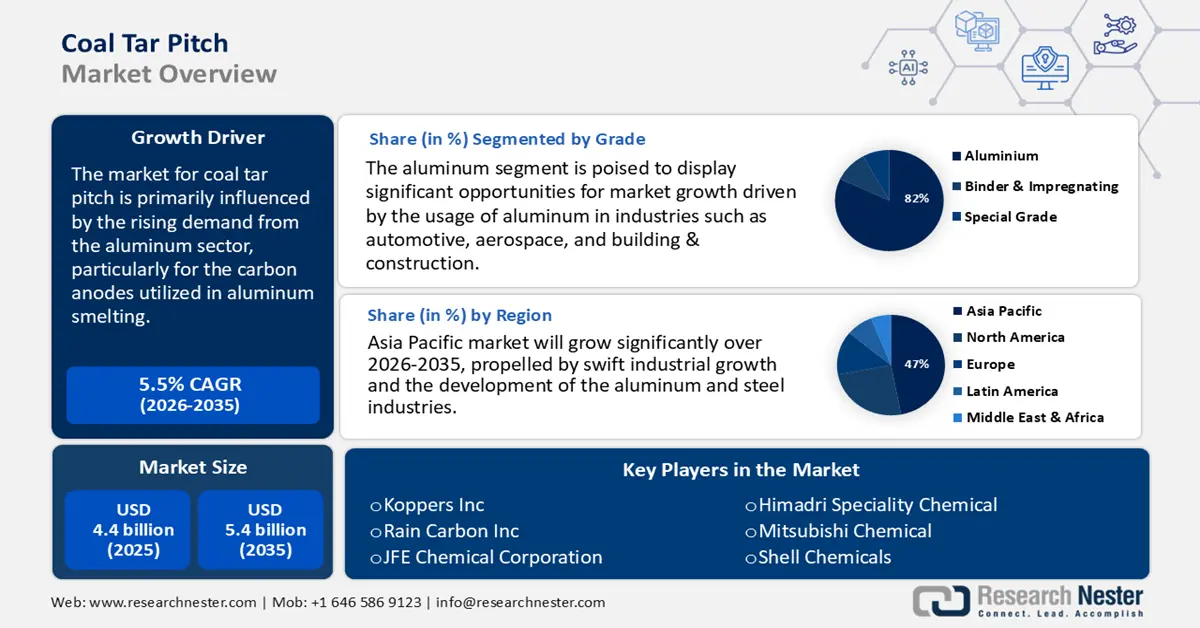
The market for coal tar pitch is primarily influenced by the rising demand from the aluminum sector, particularly for the carbon anodes utilized in aluminum smelting. In 2020, China remained the world's highest producer and consumer of aluminum, accounting for 36.7 million tons, or roughly 56.7% of the world's total production. The demand for primary aluminum worldwide reached record highs in 2021 and is expected to reach 67.4 million tons for the year. The government of India has several initiatives that will increase the country's metal consumption, including Make in India, Housing for All, Smart Cities, a national infrastructure pipeline worth Rs 100 lakh crore, renewable energy, FAME (Faster adoption of manufacturing of Hybrid and EV) schemes for electric vehicles, increased foreign direct investment, and more.
The supply chain for coal tar pitch was thriving, featuring a variety of producers and consumers involved in the coal tar pitch market. In the year 2023, India exported around 114,406 kilograms of coal tar pitch, whereas Indonesia emerged as the largest consumer with an approximate consumption of 27,845,900 kg. Producers are now investing in production capacity. For instance, Epsilon Carbon strengthened its global specialty carbon and carbon black presence with a Bellary plant producing 200,000 metric tons of specialty carbon and 115,000 metric tons of carbon black, aiming to raise carbon black capacity to 215,000 metric tons in December 2024. In addition, there is also significant R&D investment, which offers growth opportunities and sustainability opportunities for future carbon products, in addition to meeting regulatory conditions.
Key Coal Tar Pitch (CTP) Market Insights Summary:
Regional Highlights:
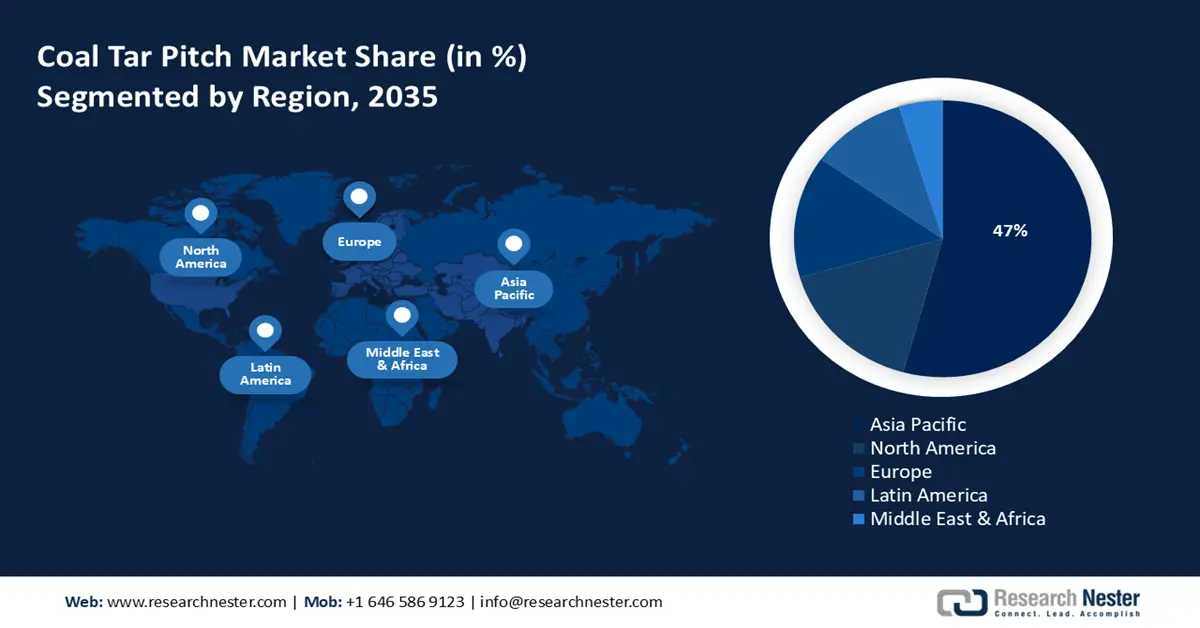
- The Asia Pacific coal tar pitch market is projected to command a 47% revenue share by 2035, fueled by the region’s rapid industrialization, expansion of aluminum and steel industries, and supportive government policies promoting cleaner technologies.
- North America is expected to secure a 27% share of the market by 2035, owing to strong demand from aluminum and steel manufacturing and government-backed initiatives encouraging carbon reduction and sustainable production practices.
Segment Insights:
- The aluminum segment of the coal tar pitch market is forecasted to hold an 82% share by 2035, propelled by the expanding use of aluminum in automotive, aerospace, and construction industries alongside rising production levels in China and India.
- The graphite electrodes segment is anticipated to account for a 42% share by 2035, bolstered by the growing adoption of electric arc furnaces and the increasing utilization of coal tar pitch as a vital binder in steelmaking.
Key Growth Trends:
- Expanding graphite electrode market
- Rising demand from refractories industry
Major Challenges:
- Complex pricing structures
- Trade barriers and export restrictions
Key Players: BASF SE, Eastman Chemical Company, Mitsubishi Chemical Corporation, Wanhua Chemical Group, Shin-Etsu Chemical Co., Ltd., Indian Oil Corporation Limited, Shell Chemicals, Dow Chemical Company, LG Chem, Petronas Chemicals Group, Covestro AG, Sabic, Linde plc, Incitec Pivot Limited, Reliance Industries Limited
Global Coal Tar Pitch (CTP) Market Forecast and Regional Outlook:
Market Size & Growth Projections:
- 2025 Market Size: USD 4.4 billion
- 2026 Market Size: USD 4.7 billion
- Projected Market Size: USD 5.4 billion by 2035
- Growth Forecasts: 5.5% CAGR (2026-2035)
Key Regional Dynamics:
- Largest Region: Asia Pacific (47% Share by 2035)
- Fastest Growing Region: Asia Pacific
- Dominating Countries: China, India, United States, Germany, Japan
- Emerging Countries: Indonesia, Vietnam, Canada, Norway, South Korea
Last updated on : 6 October, 2025
Coal Tar Pitch Market - Growth Drivers and Challenges
Growth Drivers
- Expanding graphite electrode market: Graphite electrodes are critical components of electric arc furnaces (EAF) in the steel sector. A coal tar pitch is also used to bond these electrodes together in the manufacturing process. Demand for electrodes is rising because the global steel sector is making large shifts away from blast furnaces and toward EAF for lower emissions. For instance, the World Steel Association reports that in April 2024, the 71 nations produced 155.7 million tonnes (Mt) of crude steel, a 5.0% drop from April 2023. Demand for steel is also increasing as a result of increased investments in infrastructure development and renewable energy projects. All of this is leading to a growing demand for coal tar pitch in steel production, especially in the Asia-Pacific region, where rapid industrialization and increasing scrap-based steel production are driving steady demand growth.
- Rising demand from refractories industry: Refractories, which are used in furnaces and kilns, require coal tar pitch to bond together carbon and graphite products. Coal tar pitch is a common binder. The growth of the steel, cement, and glass manufacturing industries is associated with the demand for refractory products. Steel production is expected to grow in all regions of the Asia-Pacific region, with particularly high growth expected in China and India. From 109.137 million tons (MT) in 2019–20 to 144.299 MT in 2023–24, crude steel output increased. Production of crude steel increased 13.4% in 2023–24 compared to 127.197 MT in 2022–23. Coal tar pitch will remain an essential part of the production of both shaped and unshaped refractories, and continued development of new applications for high-temperature, high-performance materials indicates the reinforcements of market demand that align with industrial and metallurgical growth.
- Energy transition & EV battery supply chain: The use of coal tar pitch is being explored more frequently as an agent in the production of needle coke for graphite electrodes and lithium-ion battery anodes. Due to the global energy transition accelerating, the number of electric vehicles (EVs) and the development of renewable energy storage systems are expanding. By 2030, there will be 250 million EVs in the STEPS, four times as many as there were at the end of 2024, across all modes except for 2/3Ws. Over 90% of vehicles are electric, as compared to the percentage in 2024. As governments encourage the adoption of EVs and increase funding for clean energy storage materials, the coal tar pitch industry benefits from developing and emerging applications in the energy transition and battery manufacturing supply chains.
1. Global Trade Dynamics of Steel
Crude Steel Production by Region
|
Region |
Apr 2024 (Mt) |
% change Apr 24/23 |
Jan-Apr2024 (Mt) |
% change Jan-Apr 24/23 |
|
Africa |
1.8 |
1.4 |
7.4 |
6.6 |
|
Asia and Oceania |
114.8 |
-5.8 |
461.8 |
-1.6 |
|
EU (27) |
11.3 |
1.1 |
44.4 |
-0.6 |
|
Europe, Other |
3.4 |
-2.6 |
14.7 |
13.9 |
|
Middle East |
4.6 |
-8.2 |
18.3 |
6.2 |
|
North America |
8.9 |
-5.2 |
35.8 |
-3.7 |
|
Russia & other CIS + Ukraine |
7.4 |
-3.5 |
29.0 |
-0.6 |
|
South America |
3.4 |
-3.9 |
14.0 |
1.2 |
|
Total 71 countries |
155.7 |
-5.0 |
625.4 |
-0.9 |
Source: World Steel
Top 10 Steel-Producing Countries
|
Country |
Apr 2024 (Mt) |
% change Apr 24/23 |
Jan-Apr 2024 (Mt) |
% change Jan-Apr 24/23 |
|
China |
85.9 |
-7.2 |
343.7 |
-3.0 |
|
India |
12.1 |
3.6 |
49.5 |
8.5 |
|
Japan |
7.1 |
-2.5 |
28.5 |
-1.2 |
|
United States |
6.7 |
-2.8 |
26.5 |
-2.2 |
|
Russia |
6.2e |
-5.7 |
24.6 |
-2.5 |
|
South Korea |
5.1 |
-10.4 |
21.2 |
-5.1 |
|
Germany |
3.4e |
6.4 |
13.1 |
6.1 |
|
Türkiye |
2.8 |
4.5 |
12.3 |
22.1 |
|
Brazil |
2.7e |
-2.1 |
11.0 |
4.0 |
|
Iran |
2.7e |
-12.3 |
10.3 |
7.2 |
Source: World Steel
2. Emerging Trade Dynamics of Graphite
The explosive demand for synthetic graphite, driven by the global EV battery boom, is directly fueling the coal tar pitch (CTP) market. As new trade policies force the creation of graphite supply chains outside China, new anode plants require secure, long-term CTP contracts. These shifts demand geographically and create intense competition for high-quality "needle-grade" pitch. Consequently, CTP is transformed from an industrial commodity into a critical, strategic material for the energy transition.
Export and Import of Graphite in 2023
|
Top Exporter |
Value USD |
Top Importers |
Value USD |
|
China |
$402M |
United States |
$160M |
|
Mozambique |
$71M |
South Korea |
$109M |
|
Madagascar |
$48.3M |
Japan |
$95.4M |
Source: OEC
Challenges
- Complex pricing structures: The price of coal tar pitch is influenced by various elements, including the costs of raw materials, the production techniques employed, and the market demand. Fluctuations in the costs of upstream commodities, such as coal and oil, may lead to price volatility. Any slowdown in the steel sector, especially in China and India, leads to reduced coal tar generation, constraining pitch supply. Furthermore, the absence of uniform pricing models across different regions adds complexity to market dynamics, posing difficulties for suppliers in sustaining stable profit margins.
- Trade barriers and export restrictions: As stated by the World Trade Organization (WTO), the imposition of export restrictions and duties by nations abundant in raw materials can disrupt market access. Recent shipping disruptions and higher freight costs have further challenged cross-border supply. For instance, the United States has contested China's export limitations on raw materials because of their effects on worldwide supply chains. These trade barriers may restrict the availability of crucial inputs necessary to produce coal tar pitch, thereby influencing global supply and pricing.
Coal Tar Pitch Market Size and Forecast:
| Report Attribute | Details |
|---|---|
|
Base Year |
2025 |
|
Forecast Year |
2026-2035 |
|
CAGR |
5.5% |
|
Base Year Market Size (2025) |
USD 4.4 billion |
|
Forecast Year Market Size (2035) |
USD 5.4 billion |
|
Regional Scope |
|
Coal Tar Pitch Market Segmentation:
Grade Segment Analysis
The aluminum segment is projected to account for an 82% share of the coal tar pitch market by 2035. The increasing utilization of aluminum across various sectors, including automotive, aerospace, and building & construction, is a significant factor propelling this segment. In the aluminum industry, coal tar pitch is used as a binder for anodes in the manufacture of aluminum electrolysis. This app is a must for aluminum smelters, as aluminum grade coal tar pitch is what you need. The Aluminum Association represents 70% of North America’s aluminum shipments, driving $228 billion in U.S. economic activity and nearly 700,000 jobs. Over the past decade, aluminum companies invested $10 billion in U.S. manufacturing for future growth. A rise in the production of aluminum, particularly in China and India, is anticipated to continue to accentuate demand for aluminum grade coal tar pitch.
Application Segment Analysis
The graphite electrodes segment are anticipated to hold a 42% share in the market in 2035, primarily used in electric arc furnaces for steel production. The transition from blast to electric arc furnaces, which are more environmentally friendly and energy efficient, is increasing the demand for graphite electrodes. This binder consists of coal tar pitch, which serves as a crucial component in the production of graphite electrodes that are essential for steel manufacturing. Graphite is the dominating material used for tool electrodes in the USA, and approximately 95% of the electrodes are constructed of this material. The increasing adoption of electric arc furnaces globally is expected to propel the graphite electrodes sub-segment.
Type Segment Analysis
The high-temperature coal tar pitch segment is projected to hold a significant share of the coal tar pitch market by 2035. Mainly due to its superior binding properties, thermal stability, and established utilization in the aluminum smelting, graphite electrodes, and refractory industries. High-temperature coal tar pitch continues to be used in industries due to its stability at elevated temperatures in energy-intensive industries allowing for continued demand for the material allowing for a larger market share in those industries than medium and low temperature counterparts.
Our in-depth analysis of the market includes the following segments:
| Segment | Subsegment |
|
Grade |
|
|
Application |
|
|
End-Use |
|
|
Type |
|

Vishnu Nair
Head - Global Business DevelopmentCustomize this report to your requirements — connect with our consultant for personalized insights and options.
Coal Tar Pitch Market - Regional Analysis
Asia Pacific Market Insights
The coal tar pitch market within the Asia Pacific area is expected to secure a 47% revenue share by 2035, driven by rapid industrial expansion and the advancement of the aluminum and steel sectors. Government policies that emphasize environmental sustainability and the advancement of green chemical technologies play a crucial role in shaping market demand. Expansion results from the development of industrial infrastructures and increases in energy demand. Environmental regulations are prompting manufacturers to employ cleaner technologies. The region continues to be highly competitive, with integrated players realizing their supply capacities through economies of scale and technological advancement.
China is projected to lead the APAC market, capturing the largest revenue share by 2035. This growth is fueled by its extensive aluminum and steel manufacturing sectors, along with substantial government investments in green chemical production. China was the world’s largest crude steel producer in 2024 with a production of 1,005.1 MT. Technological upgrades are improving efficiency, while government-driven policies promote industrial modernization and environmental sustainability. Despite regulatory pressures, China remains a key global supplier, leveraging its scale to maintain cost advantages. Expansion of downstream applications continues to strengthen the country’s market position internationally.
India’s coal tar pitch market is being driven by the country’s progress in steel, aluminum, and construction. Significant construction developments and government support for industrialization are boosting demand for electrodes and refractories. There is also a heightened focus on domestic manufacturing, which has resulted in increased consumption in core heavy industry. Environmental compliance, sustainability requirements, and waste management are challenging for manufacturers. Investments in processing technology and partnerships are shaping the market’s long-term outlook, with opportunities in both domestic and export markets.
Crude and Finished Steel Production Between 2019-2024 in Million Tons
|
Item |
2019-20 |
2020-21 |
2021-22 |
2022-23 |
2023-24 |
|
Crude Production |
109.137 |
103.545 |
120.293 |
127.197 |
144.299 |
|
Finished Production |
102.621 |
96.204 |
113.597 |
123.196 |
139.153 |
|
Consumption |
100.171 |
94.891 |
105.752 |
119.893 |
136.291 |
|
Import |
6.768 |
4.752 |
4.669 |
6.022 |
8.320 |
|
Export |
8.355 |
10.784 |
13.494 |
6.716 |
7.487 |
Source: Steel.gov
North America Market Insights
By the year 2035, it is anticipated that North America will represent a 27% share of the coal tar pitch market, with notable contributions from both the United States and Canada. The primary drivers of this demand are the aluminum and steel sectors, which employ coal tar pitches in the production of electrodes and during the aluminum smelting process. Furthermore, governmental initiatives aimed at reducing carbon emissions and promoting sustainable manufacturing practices are influencing the market dynamics.
In 2025, the development of the aluminum industry, notably the trend of electric vehicle production and green infrastructure, will have a significant influence on the coal tar pitch market in the United States. The imposition of tough environmental regulations compels firms to invest in equipment for emission control and other measures to ensure compliance, thus increasing their operating costs. U.S. synthetic graphite production rose to 319,000 metric tons (t), valued at $1.45 billion in 2022. This compares to 259,000 t, valued at $1.16 billion in 2021. U.S. exports (limited to natural graphite) and imports of natural graphite were 9,500 and 89,200 t. This information represented an increase in exports of 10% and imports of 68% from those in 2021. U.S. exports and imports of synthetic graphite were 38,700 and 151,000 t, respectively. U.S. apparent consumption of synthetic graphite and natural graphite was 431,000 and 79,700 t, respectively. World production of natural graphite was estimated to be 1.68 million metric tons (Mt).
The coal tar pitch market in Canada is heavily dependent on the aluminum industry, particularly in Quebec, where most of the smelting activities take place. Investments in smelters are being driven by the growing need for aluminum in green infrastructure and electric vehicles. Primary aluminum smelting consumes about 70 GJ per tonne, making it highly energy-intensive, accounts for 4 % of global electricity use, with up to 70 % sourced from fossil fuels, mainly coal. Manufacturers are adopting emission control technologies as a result of strict environmental regulations. To ensure a steady supply of high-quality coal tar pitch, strategic alliances between pitch producers and aluminum manufacturers are growing more common.
Europe Market Insights
Europe is expected to hold approximately 11% market share of the market by 2035. Important factors are demand for graphite electrodes, rising aluminum production, and uses in the carbon fiber and construction sectors. Germany and Norway are significant contributors, utilizing coal tar pitch in aluminum smelting and carbon products. While environmental laws are calling for sustainable manufacturing methods, countries like Germany and Norway are important supporters.
Trade of Natural Graphite in Powder or in Flakes in 2023
|
Country / Region |
Trade Value (1,000 USD) |
Quantity (Kg) |
|
United Kingdom |
2,415.57 |
1,168,280 |
|
Germany |
25,167.88 |
12,193,500 |
|
France |
161.77 |
90,965 |
|
Italy |
316.45 |
176,682 |
|
Spain |
204.94 |
143,504 |
Source: WITS
Germany growth is driven by aluminum production, graphite electrodes for steel manufacturing, and applications in roofing and coatings. Germany's focus on sustainable manufacturing practices and environmental regulations encourages the development of eco-friendly production methods. Sustainability initiatives are prompting shifts toward eco-friendly production processes. The European Union produces 166.2 MT of crude steel overall, with Germany producing the most at 42.7 MT. Key players include Rheinbraun Brennstoff GmbH and Nexans, who are focusing on innovation and compliance with environmental standards.
The U.K. coal tar pitch market is driven by demand in aluminum production, graphite electrodes, and specialty applications. The market is influenced by environmental policies promoting sustainable practices and reducing emissions. Companies are investing in cleaner technologies and exploring alternative materials to meet regulatory requirements and market demands. In 2023, the UK exported 27,636 kg of coal tar pitch globally, valued at USD 38.15. The U.K.'s emphasis on green initiatives presents opportunities for innovation and growth in the coal tar pitch sector. Companies are adopting advanced manufacturing technologies to meet the evolving demands of these sectors.
Key Coal Tar Pitch Market Players:
- BASF SE
- Company Overview
- Business Strategy
- Key Product Offerings
- Financial Performance
- Key Performance Indicators
- Risk Analysis
- Recent Development
- Regional Presence
- SWOT Analysis
- Eastman Chemical Company
- Mitsubishi Chemical Corporation
- Wanhua Chemical Group
- Shin-Etsu Chemical Co., Ltd.
- Indian Oil Corporation Limited
- Shell Chemicals
- Dow Chemical Company
- LG Chem
- Petronas Chemicals Group
- Covestro AG
- Sabic
- Linde plc
- Incitec Pivot Limited
- Reliance Industries Limited
The market for coal tar pitch chemicals is primarily controlled by well-established multinational companies, mainly located in the USA, Europe, and Asia. Major participants concentrate on strategic investments aimed at sustainable production, R&D for environmentally friendly technologies, and expanding their capacities to comply with increasing environmental regulations. Partnerships and mergers are frequently employed strategies to enhance market presence and foster innovation in cleaner applications of coal tar pitch. The table below describes the global manufacturers and the share they hold in the coal tar pitch market.
Some of the key players operating in the market are listed below:
Recent Developments
- In January 2024, CarbonCure Technologies, a prominent carbon utilization solutions company, has announced it has successfully incorporated coal tar pitch into its carbonation technology and the application potential of coal tar pitch in construction.
- In March 2024, Chevron Phillips Chemical Company LLC and INEOS Styrolution, the global leader in styrenics supply, have established a strategic alliance to co-develop and commercialize new coal tar pitch derivatives for the polymer industry.
- Report ID: 2321
- Published Date: Oct 06, 2025
- Report Format: PDF, PPT
- Explore a preview of key market trends and insights
- Review sample data tables and segment breakdowns
- Experience the quality of our visual data representations
- Evaluate our report structure and research methodology
- Get a glimpse of competitive landscape analysis
- Understand how regional forecasts are presented
- Assess the depth of company profiling and benchmarking
- Preview how actionable insights can support your strategy
Explore real data and analysis
Frequently Asked Questions (FAQ)
About this Report
Connect with our Expert

Report, 2026-2035


Copyright @ 2026 Research Nester. All Rights Reserved.
