Aminobenzoic Acid Market Outlook:
Aminobenzoic Acid Market size was over USD 214.1 million in 2025 and is anticipated to exceed USD 387 million by the end of 2035, growing at over 6.8% CAGR during the forecast period, i.e., between 2026-2035. In 2026, the industry size of aminobenzoic acid is assessed at USD 228.6 million.
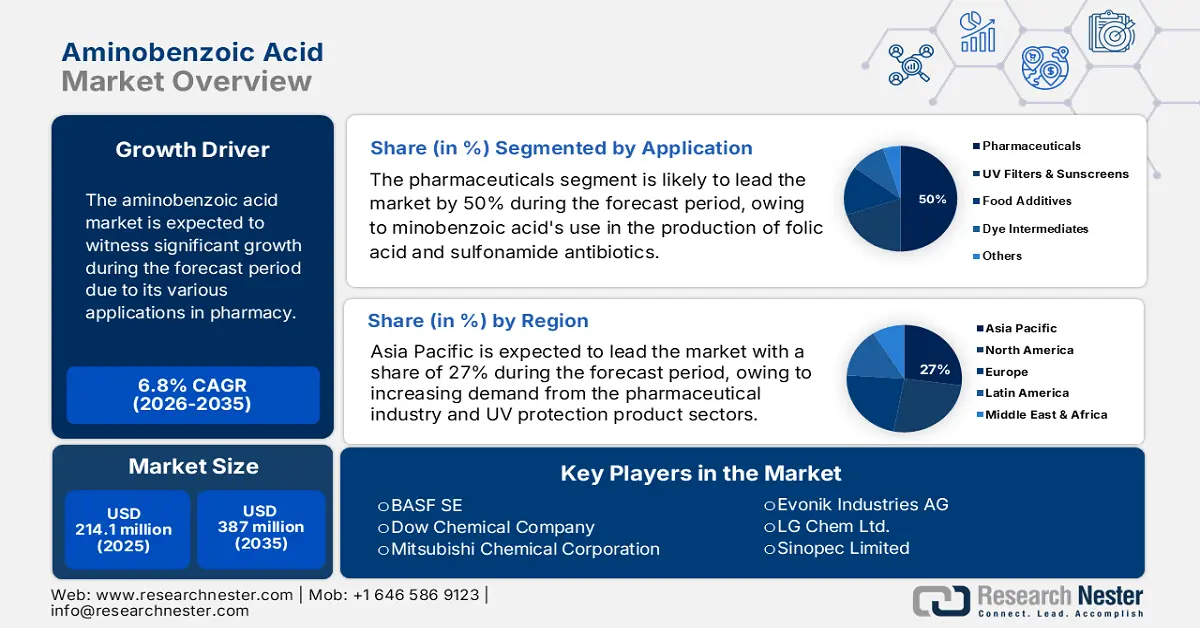
The market is growing primarily due to its various applications in pharmacy. Aminobenzoic acids serve as necessary raw materials in the manufacturing of local anesthetics and medicines for skin conditions. The pharmaceutical-grade reagent aminobenzoic acid is required to meet strict quality standards since it is used as a critical precursor in drug development. As per a report by IFPMA January 2023, as thousands of medicines are in development across the top therapeutic areas, including 3,148 drugs for cancer treatment, 1,668 drugs for neurology, 1,677 drugs for immunology, 1,336 drugs for respiratory tract, 1,460 drugs for the digestive system, 586 drugs for musculoskeletal, and 451 drugs for diabetes, it increased the demand for important pharmaceutical precursors such as aminobenzoic acid.
Continuous medical applications are being discovered, which is expected to contribute to the still-growing demand in market in the future. As per a report by IFPMA in January 2023, the biopharmaceutical industry contributes USD 1,838 billion worth of GDP to the world. The growth is further bolstered by health trends and increasing demand for natural products. Along with the slowdown in China, investments in the India-based supply chain have become a much bigger issue. Meanwhile, price stability has been observed among producers in the US, pointing towards a balanced supply and demand scenario. Altogether, sustainable production and R&D investments continue to sustain the market.
Key Aminobenzoic Acid Market Insights Summary:
Regional Highlights:
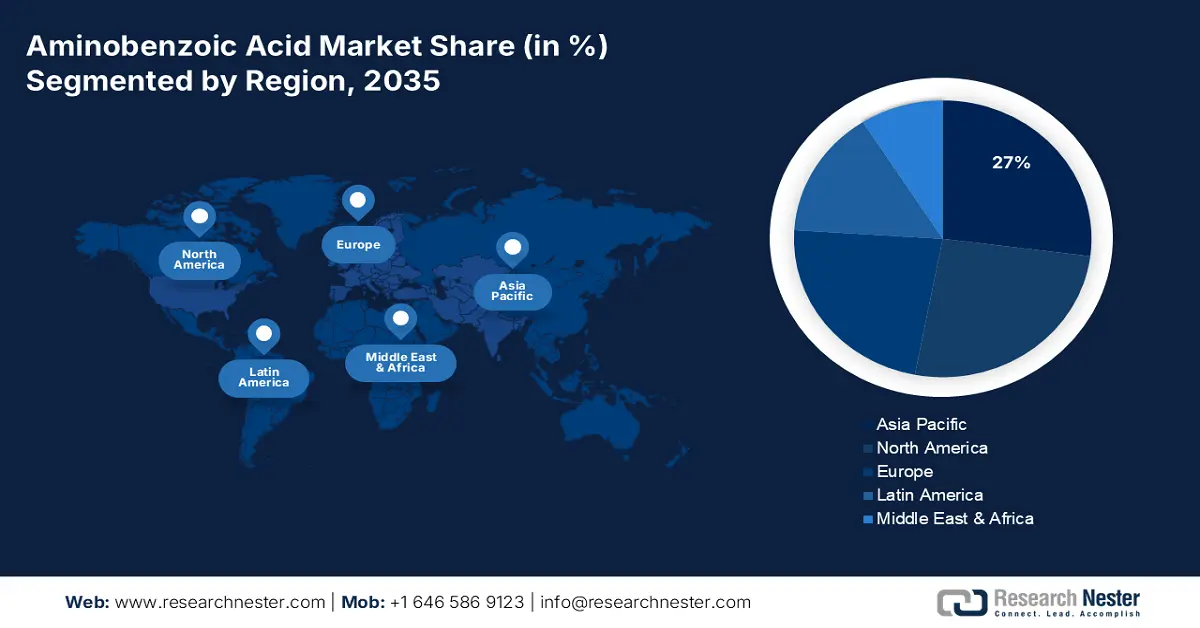
- The Asia Pacific region is anticipated to command 27% of the Aminobenzoic Acid Market share by 2035, supported by escalating pharmaceutical demand and the surging need for UV protection products in China, India, and Japan.
- Europe is projected to emerge as the fastest-growing region during 2026–2035, fueled by stringent pharmaceutical standards and rising demand for high-purity intermediates in drug and skincare formulations.
Segment Insights:
- The pharmaceuticals segment is projected to account for 50% of the Aminobenzoic Acid Market share by 2035, propelled by its vital role as an intermediate in folic acid and sulfonamide antibiotic synthesis alongside increasing global health and R&D demand.
- The para-aminobenzoic acid (PABA) segment is expected to capture the largest share by 2035, impelled by its extensive industrial utilization and versatility across pharmaceutical and personal care applications.
Key Growth Trends:
- Rising demand for topical and dermatological formulations
- Expansion in pharmaceutical applications
Major Challenges:
- Infrastructure and technology limitations in emerging markets
Key Players: BASF SE, Dow Chemical Company, Mitsubishi Chemical Corporation, Evonik Industries AG, LG Chem Ltd., Sinopec Limited, Celanese Corporation, Sumitomo Chemical Co., Ltd., AkzoNobel N.V., Wanhua Chemical Group Co., Ltd., Merck KGaA, Eastman Chemical Company, Solvay S.A., LANXESS AG, Tokyo Chemical Industry Co., Ltd.
Global Aminobenzoic Acid Market Forecast and Regional Outlook:
Market Size & Growth Projections:
- 2025 Market Size: USD 214.1 million
- 2026 Market Size: USD 228.6 billion
- Projected Market Size: USD 387 million by 2035
- Growth Forecasts: 6.8% CAGR (2026-2035)
Key Regional Dynamics:
- Largest Region: Asia Pacific (27% Share by 2035)
- Fastest Growing Region: Europe
- Dominating Countries: China, United States, India, Germany, Japan
- Emerging Countries: South Korea, Brazil, Indonesia, Mexico, Italy
Last updated on : 24 September, 2025
Aminobenzoic Acid Market - Growth Drivers and Challenges
Growth Drivers
- Rising demand for topical and dermatological formulations: Aminobenzoic acid is generally utilized in the subscreen preparation, ointments, and other external pharmaceuticals as they are great in UV-absorbing and skin-soothing activities. Owing to increased awareness about prevention and care of the skin, particularly in dermatology and cosmetic medicine, demand for effective and safe agents such as aminobenzoic acid has increased manyfold. Its ability to be combined with most drug preparations makes it an attractive option in the preparation of non-irritating and hypoallergenic skin care products, thereby suitable for uplifting the market.
- Expansion in pharmaceutical applications: The demand for the market has very high growth possibilities due to its applications in the pharmaceutical industry. Increase in demand for organic, health-based, and natural products is another cause of this trend. Supporting this shift, the U.S. Department of Energy's March 2024 report states that the chemicals industry, on which the aminobenzoic acid and other chemicals are based, represents more than 25% of U.S. GDP and contributes 513 million metric tons of energy-related CO₂ emissions in 2024, showing the scope and extent of demand for legacy and new biobased chemicals in market.
- Sustainability initiatives and carbon footprint reduction: Businesses investing in sustainable processes and bio-based raw materials to keep carbon emissions low and to avoid taxes, fines, and new legislation. As per a report by NLM in April 2025, the Biden Administration aims for the U.S. to achieve a 61% reduction in aggregate GHG emissions by 2035. This target includes healthcare and pharmaceutical emissions, thereby pressuring manufacturers to adopt greener methods of production. Biodegradable and low-impact compounds such as aminobenzoic acid are now preferred as an alternative in drug formulation, which is fueling the market.
Aminobenzoic Acid Market: 2023 Global Imports and Exports of Benzoic Acid, Its Salts and Esters
Exports and Imports of Benzoic Acid, Its Salts and Esters (2023):
|
Country |
Exports (USD) |
Imports (USD) |
|
Netherlands |
202 million |
17.6 million |
|
Estonia |
52.1 million |
- |
|
China |
188 million |
12.2 million |
|
India |
21.6 million |
43.2 million |
|
U.S. |
45.6 million |
70.3 million |
|
Canada |
3.8 million |
9.5 million |
|
Brazil |
- |
28.2 million |
Source: OEC, August 2025
Challenges
- Infrastructure and technology limitations in emerging markets: A lack of advanced manufacturing infrastructure and technical skills in many developing regions stands as the main challenge for the market. Logistical inefficiencies and supply chain disruptions worked against consistent and reliable distribution in under-industrialized geographic locations. Without support from local and governmental bodies willing to improve the infrastructure and guarantee a steady supply, the market value of aminobenzoic acid in these regions essentially remains undertipped. These impediments could pose challenges to international trading and could restrict the availability of pharmaceutical ingredients.
Aminobenzoic Acid Market Size and Forecast:
| Report Attribute | Details |
|---|---|
|
Base Year |
2025 |
|
Forecast Year |
2026-2035 |
|
CAGR |
6.8% |
|
Base Year Market Size (2025) |
USD 214.1 million |
|
Forecast Year Market Size (2035) |
USD 387 million |
|
Regional Scope |
|
Aminobenzoic Acid Market Segmentation:
Application Segment Analysis
The pharmaceuticals sub-segment is expected to account for the highest revenue share of 50% in the market by 2035, owing to aminobenzoic acid's extensive use as an intermediate in the production of folic acid and sulfonamide antibiotics. The demand is further fueled by sustained global health requirements and rising drug R&D. The FDA categorizes aminobenzoic acid (PABA) as an active sun-screen ingredient, based on its established pharmaceutical and topical application, though no longer GRASE due to allergy issues. Its two-sided use in the pharmaceuticals and dermatology discipline makes it inescapable. With increasing medical R&D, demand for high-purity pharmaceutical intermediates increases as well.
Product Type Segment Analysis
Para-aminobenzoic acid (PABA) is expected to hold the largest projected market share in the product type segment by 2035 due to its widespread use in the industry and multi-purpose uses. PABA is also used in peptidomimetic drugs. According to statistical analysis results in the NLM September 2023 report, it is a building block drug used in over 184 drugs in the commercial database of drugs and holds the status of a building block drug. With its chemical flexibility, PABA continues to be a market leader in pharmaceutical and personal care markets. Formulation innovation keeps advancing through leveraging established safety and regulatory history, underpinning continued demand in the market.
Grade Segment Analysis
The industrial grade sub-segment is likely to capture the highest revenue share in the grade segment within the forecast period, due to the stringent requirements for purity, safety, and consistency in pharmaceutical production. There are strict regulations, and healthcare manufacturers need the guaranteed quality of raw materials for the sale of aminobenzoic acid by grade. The pharmaceutical-grade aminobenzoic acid either needs to comply with cGMP (current good manufacturing practices) and pharmacopeial requirements or satisfy the same in other jurisdictions. Foreign manufacturing of pharmaceuticals and changes in the quality control paradigms necessitate the demand for superior antibiotics. Due to growing legal pressures, manufacturers focus on reliable and certified suppliers in the market.
Our in-depth analysis of the global aminobenzoic acid market includes the following segments:
|
Segment |
Sub-Segments |
|
Product Type |
|
|
Application |
|
|
Grade |
|
|
End user |
|
|
Distribution Channel |
|

Vishnu Nair
Head - Global Business DevelopmentCustomize this report to your requirements — connect with our consultant for personalized insights and options.
Aminobenzoic Acid Market - Regional Analysis
Asia Pacific Market Insights
The global market in the Asia Pacific is expected to hold the highest market share of 27% within the forecast period due to increasing demand from the pharmaceutical industry and UV protection product sector in China, India, and Japan. Awareness of skincare and sun protection remains a strong driver for demand for UV filter ingredients such as aminobenzoic acid. Direct consumption and exports are supporting the rapid growth of the pharmaceutical sector in the area. Investments into health infrastructure and R&D pertaining to personal care are also aiding demand of market from these regions.
The global market in China is growing due to a strong manufacturing base with low production costs and increasing pharmaceutical exports. As per a report by NLM in April 2023, 79% of domestic first medicines has been applied for their first IND as of 2022. Over the past five years, domestic chemical drugs grew at a compound annual rate of 15%, while domestic biological drugs grew at a rate of 26%. This growth opportunity is evidence of a maturing ecosystem for drug innovation and a burgeoning demand for high-purity intermediates such as aminobenzoic acid. The market would remain long-term stable under government support for the biopharma's self-reliance and export competitiveness.
Exports and Imports of Benzoic Acid, its Salts & Esters in Asia Pacific (2023):
|
Country |
Exports (USD) |
Imports (USD) |
|
China |
188 million |
12.2 million |
|
India |
21.6 million |
43.2 million |
|
Singapore |
3.7 million |
8.4 million |
|
Japan |
3.2 million |
11.3 million |
|
Turkey |
1.2 million |
18.5 million |
Source: OEC, August 2025
Europe Market Insights
The global aminobenzoic acid market in Europe is expected to be the fastest-growing market within the forecast period due to high standards that drive the pharmaceutical-grade application. The drug safety, efficacy, and traceability aspects have become the region's backbone, and as such came the demand for higher purity chemical intermediates such as aminobenzoic acid. Additionally, growing awareness of UV-related skin diseases has promoted the increased usage of aminobenzoic acid for UV sunscreens and dermatological preparations. Furthermore, the supportive legislative trends for clean label and sustainability ingredients in the pharma and cosmetic industries will keep on helping the market growth in those key countries in Europe.
The global market in the UK is growing due to strong R&D investment going into drug development and clean-label skincare products. This industry witnessed many innovations. As per a report by the European Union December 2022, the UK spends a large amount of pharmaceutical supplies, with over 30% of its share on OTC medicines, which points toward the strong self-care demand coming from consumers. Aminobenzoic acid is used as a precursor in manufacturing topical anesthetics and skin treatments and is hence a very important ingredient in many OTC products. The UK maintains its focus on accessible healthcare and options for preventive care, driving up demand for economical, functional ingredients such as aminobenzoic acid in the pharma and cosmetic industries.
North America Market Insights
The global aminobenzoic acid market in North America is expected to grow steadily within the forecast period due to a mature infrastructure in pharmaceuticals and consistent demand for personal care. It has been a bastion of many innovations. Technological innovations and rising awareness of product safety are the very drivers of the region. Steady consumption of aminobenzoic acid by both medical and cosmetic industries is sustained by the widespread use of topical anesthetics and UV-blocking agents. Demand for pharmaceutical-grade inputs thus increases, following the established regulatory standards such as those of the FDA.
The global aminobenzoic acid market in the U.S. is growing due to the country’s leadership in drug formulation and large-scale cosmetic consumption. As per a report by NLM May 2023, there was a decline in the total number of drugs approved by the FDA in the year 2022, with only 37 drugs being approved against an average of approximately 50 in earlier years. This might be a temporary factor slowing demand for innovation, but it has very little influence on common pharmaceutical and OTC formulations using aminobenzoic acid as a core intermediate. Demand exists in topical anesthesia, UV blockers, and skincare specifying aminobenzoic acid.
Key Aminobenzoic Acid Market Players:
- BASF SE
- Company Overview
- Business Strategy
- Key Product Offerings
- Financial Performance
- Key Performance Indicators
- Risk Analysis
- Recent Development
- Regional Presence
- SWOT Analysis
- Dow Chemical Company
- Mitsubishi Chemical Corporation
- Evonik Industries AG
- LG Chem Ltd.
- Sinopec Limited
- Celanese Corporation
- Sumitomo Chemical Co., Ltd.
- AkzoNobel N.V.
- Wanhua Chemical Group Co., Ltd.
- Merck KGaA
- Eastman Chemical Company
- Solvay S.A.
- LANXESS AG
- Tokyo Chemical Industry Co., Ltd.
The market shows high competition. The large players, such as BASF SE, Dow Chemical Company, and Mitsubishi Chemical Corporation, are largely responsible for production capacity and market share. These companies are expanding manufacturing units and optimizing production efficiency to keep up with growing demands from the pharmaceutical, cosmetic, and chemical industries. Strategies comprise investment toward sustainable manufacturing processes, research and development for new applications, along with the development of distribution channels to maximize market reach. Following partnership and collaboration for technological advancement and regulatory compliance shall provide competitive advantages in the global market of aminobenzoic acid.
Here is a list of key players operating in the global market:
Recent Developments
- In December 2024, Cambrex announced the new agreement signed with Eli Lilly and Company to provide accelerated access to clinical development capabilities for Lilly’s biotech collaborators.
- In June 2022, Spectrum Chemical announced its distribution arrangement with ANGUS Chemical Company, which will focus on expanding Spectrum Chemical’s product offerings for research and development and production in the biopharmaceutical and life sciences industries in the U.S. and Canada
- Report ID: 7745
- Published Date: Sep 24, 2025
- Report Format: PDF, PPT
- Explore a preview of key market trends and insights
- Review sample data tables and segment breakdowns
- Experience the quality of our visual data representations
- Evaluate our report structure and research methodology
- Get a glimpse of competitive landscape analysis
- Understand how regional forecasts are presented
- Assess the depth of company profiling and benchmarking
- Preview how actionable insights can support your strategy
Explore real data and analysis
Frequently Asked Questions (FAQ)
Aminobenzoic Acid Market Report Scope
Free Sample includes current and historical market size, growth trends, regional charts & tables, company profiles, segment-wise forecasts, and more.
Connect with our Expert


Copyright @ 2026 Research Nester. All Rights Reserved.
