Water Clarifiers Market Outlook:
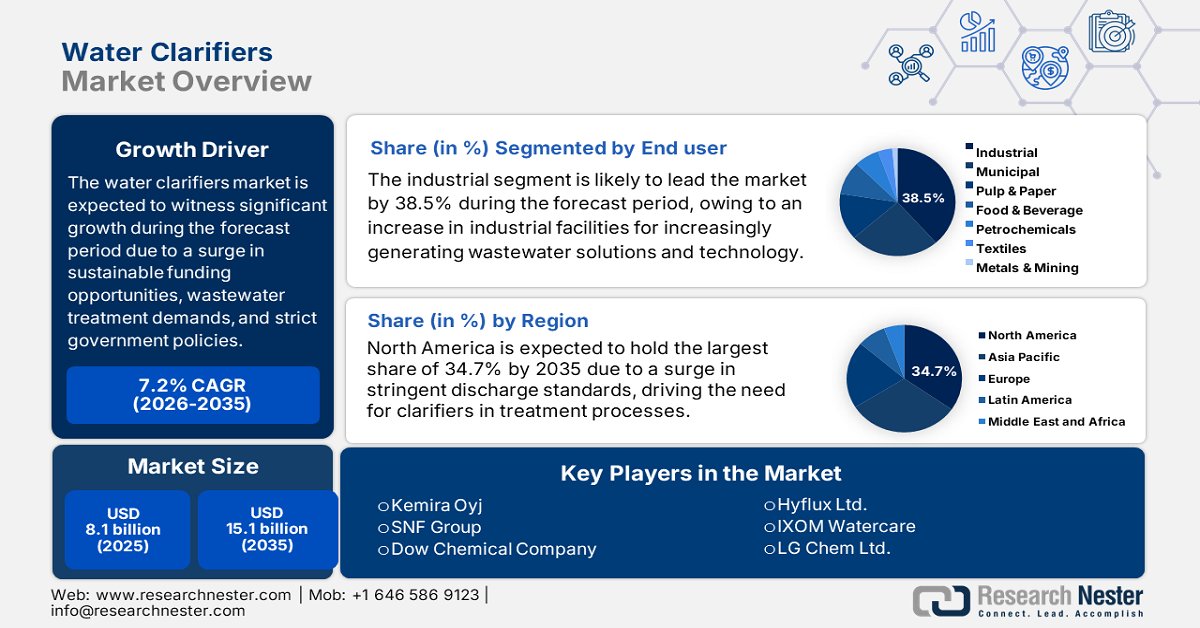
Water Clarifiers Market size was over USD 8.1 billion in 2025 and is estimated to reach USD 15.1 billion by the end of 2035, expanding at a CAGR of 7.2% during the forecast timeline, i.e., 2026-2035. In 2026, the industry size of water clarifiers is evaluated at USD 8.6 billion.
The international water clarifiers market is continuously growing, owing to the availability of sustainable-based investments, a rise in industrial wastewater treatment requirements, and the existence of stringent environmental regulations. According to official statistics published by the World Health Organization in June 2023, there has been the absence of safe drinking water, hygiene, and sanitation that could have combated almost 1.4 million deaths, along with 74 million disability-based life years globally. However, to overcome this, the organization has urged governments to radically escalate action for making safe WASH a realistic strategy, along with focusing on efforts, and adapting national monitoring systems to optimize data on the population. Besides, as per the July 2025 CDC article, more than 2 billion people still lack clean drinking water at home, 1.5 billion are devoid of basic sanitation facilities, and 2 billion lack basic hygiene services, thereby denoting a huge demand for the water clarifiers market.
Furthermore, green chemistry, sustainability, smart water solutions, digitalized integration, expansion of industrial wastewater treatment, an increase in infrastructure investments, government regulations, and regional growth focus are other drivers fueling the water clarifiers market. As per an article published by NLM in August 2022, for the purpose of smart water solution, the water flow transducer is regarded as the hall effect sensor with a digitalized output, suitable for detecting water flow between 1 and 30 L/min. Additionally, this constitutes a maximum pressure of 1.7 MPa, and at the same time, the pressure sensor can also measure pressures ranging from 0 to 1.2 MPa. Besides, as stated in the August 2024 UN Water Organization article, the international status on wastewater acceleration and treatment is required to gain target of 6.3 by the end of 2030, thus suitable for boosting the market’s growth.
Key Water Clarifiers Market Insights Summary:
Regional Highlights:
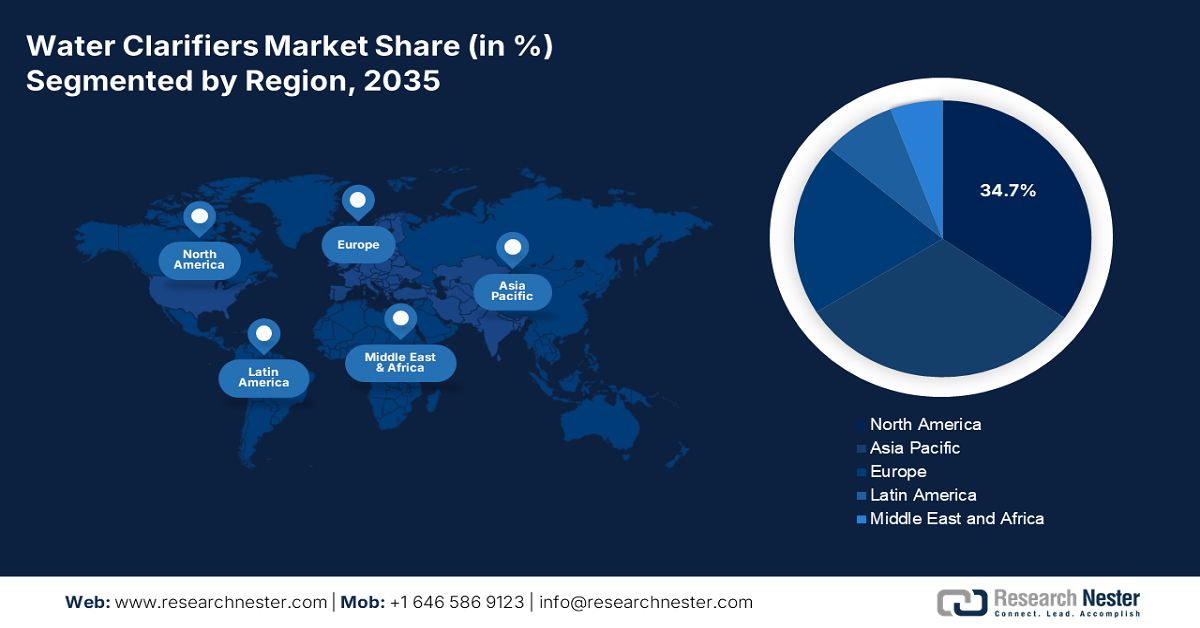
- North America is projected to dominate the water clarifiers market with a 34.7% share by 2035, underpinned by stringent clean water act enforcement, substantial federal and state funding, and sustained investments in industrial and municipal wastewater infrastructure.
- Europe is anticipated to register the fastest growth through 2026-2035, reinforced by green deal sustainability mandates, large-scale public funding programs, and intensifying industrial wastewater treatment requirements.
Segment Insights:
- Industrial end user segment is projected to command the largest 38.5% share of the water clarifiers market by 2035, supported by widespread deployment across petrochemicals, textiles, pulp and paper, food and beverage, and mining facilities for regulatory-compliant wastewater pre-treatment and sustainability alignment, underpinned by stringent environmental discharge mandates and zero liquid discharge objectives.
- Wastewater treatment application segment is expected to secure the second-largest share by the end of 2035, benefiting from extensive adoption in municipal and industrial treatment plants for sedimentation and turbidity reduction, reinforced by expanding urban infrastructure investments and escalating regulatory enforcement worldwide.
Key Growth Trends:
- Rise in industrialization and urbanization
- Increase of sustainability investments
Major Challenges:
- Increased capital and operational expenses:
- Regulatory complexity across different regions:
Key Players: BASF SE (Germany), Ecolab Inc. (U.S.), SUEZ Water Technologies & Solutions (France), Veolia Environnement S.A. (France), Xylem Inc. (U.S.), Kurita Water Industries Ltd. (Japan), Evoqua Water Technologies LLC (U.S.), Aries Chemical Inc. (U.S.), Parkson Corporation (U.S.), Murugappa Organo Water Solutions Pvt. Ltd. (India), Kemira Oyj (Finland), SNF Group (France), Dow Chemical Company (U.S.), Solvay S.A. (Belgium), Hitachi Zosen Corporation (Japan), Hyflux Ltd. (Singapore), IXOM Watercare (Australia), LG Chem Ltd. (South Korea), Petronas Chemicals Group Berhad (Malaysia), and Akzo Nobel N.V. (Netherlands).
Global Water Clarifiers Market Forecast and Regional Outlook:
Market Size & Growth Projections:
- 2025 Market Size: USD 8.1 billion
- 2026 Market Size: USD 8.6 billion
- Projected Market Size: USD 15.1 billion by 2035
- Growth Forecasts: 7.2% CAGR (2026-2035)
Key Regional Dynamics:
- Largest Region: North America (34.7% Share by 2035)
- Fastest Growing Region: Europe
- Dominating Countries: United States, Germany, China, United Kingdom, Japan
- Emerging Countries: India, China, Brazil, South Korea, Indonesia
Last updated on : 16 January, 2026
Water Clarifiers Market - Growth Drivers and Challenges
Growth Drivers
- Rise in industrialization and urbanization: The aspect of rapid industrial development in Latin America and the Asia Pacific is upsurging wastewater volumes, which is positively driving the water clarifiers market globally. According to official statistics published by the International Monetary Fund in November 2024, the growth of industrial services already caters to almost half of the Asia Pacific’s workers in industries, denoting a rise by only 22%, since millions of workers moved into factories from farms. Besides, just like Asia’s increased tariffs on agriculture, which readily average 12% in comparison to 7.5% internationally, foreign organizations are entering into service industries. Besides, as per the 2024 Our World In Data Organization article, over 4 billion people reside in urban locations, thus bolstering the market’s exposure.
- Increase of sustainability investments: The presence of governmental reforms has been successful in allocating generous investments for ensuring sustainable chemical advancements, catering to the water clarifiers market’s upliftment. As per official statistics published by Europe Commission in September 2024, Horizon Europe has provided €188.6 million, which is readily available to sustainable energy utilization and energy supply-based research projects. Moreover, according to an article published by the SOCI Organization in August 2022, the government in Europe has significantly invested over €1.8 billion across 17 major clean tech projects. Regarding this, three chemical projects have offered €135 million to Finland’s Neste to bolster organizational chemical recycling capacity, thus denoting a huge growth opportunity for the water clarifiers market.
- Focus on sustainability innovation: The transformational power of science, technology, and innovation (STI) is essential to expand economic development, while catering to the majority of international environmental risks, including biodiversity loss and pollution. As per an article published by the OECD Organization in June 2025, China is considered one of the largest contributors to scientific and energy-based technologies, accounting for 40% internationally. Besides, relevant research and development budgets in OECD-specific areas surged by 29% as of 2023, along with standing at 7% on average. Out of this, less than 5% is significantly dedicated to ensuring low-carbon energy research, development, and demonstration, thus creating an optimistic outlook for the water clarifiers market.
Challenges
- Increased capital and operational expenses: One of the most significant roadblocks for the water clarifiers market is the high capital investment required for advanced clarifier systems, particularly those integrated with digital monitoring and eco-friendly formulations. Municipalities in developing regions often struggle to allocate sufficient budgets for large-scale clarifier installations, limiting adoption. Operational costs, including chemical dosing, maintenance, and skilled labor, further add to the financial burden. For industries, compliance with strict effluent discharge standards requires continuous monitoring and optimization, which increases costs. Smaller enterprises and municipalities may opt for cheaper alternatives, slowing market penetration and negatively impacting the market’s expansion.
- Regulatory complexity across different regions: The water clarifiers market is heavily influenced by regulatory frameworks, which vary significantly across regions. In the U.S., the EPA Clean Water Act enforces strict effluent discharge standards, while Europe’s ECHA directives emphasize sustainability and chemical safety. In contrast, regulations in the Asia Pacific and Latin America are less harmonized, creating uncertainty for manufacturers. Companies must adapt formulations and technologies to meet diverse compliance requirements, increasing R&D and certification costs. Regulatory delays in approvals also hinder market entry, particularly for innovative clarifier solutions. Moreover, evolving sustainability mandates, such as Europe’s Green Deal and carbon neutrality targets, require continuous adaptation of product portfolios.
Water Clarifiers Market Size and Forecast:
| Report Attribute | Details |
|---|---|
|
Base Year |
2025 |
|
Forecast Year |
2026-2035 |
|
CAGR |
7.2% |
|
Base Year Market Size (2025) |
USD 8.1 billion |
|
Forecast Year Market Size (2035) |
USD 15.1 billion |
|
Regional Scope |
|
Water Clarifiers Market Segmentation:
End user Segment Analysis
The industrial segment, which is part of the end user, is anticipated to garner the largest share of 38.5% in the water clarifiers market by the end of 2035. The segment’s upliftment is highly driven by the aspect of industrial facilities, including petrochemicals, textiles, pulp and paper, food and beverage, and mining, which generate vast volumes of wastewater containing suspended solids, heavy metals, and organic contaminants. Clarifiers are essential for pre-treatment and compliance with strict discharge regulations. The U.S. EPA effluent guidelines, Europe ECHA directives, and China’s Ministry of Ecology and Environment standards mandate advanced wastewater treatment, compelling industries to adopt clarifiers. Industrial users also face increasing pressure to align with sustainability goals, such as carbon neutrality and zero liquid discharge (ZLD), which require efficient clarifier systems.
Application Segment Analysis
Based on the application segment, the wastewater treatment sub-segment in the water clarifiers market is projected to account for the second-largest share by the end of the forecast period. The sub-segment’s growth is highly fueled by rising urbanization, industrialization, and regulatory enforcement. Wastewater treatment plants rely on clarifiers to remove suspended solids, reduce turbidity, and prepare water for biological or advanced treatment stages. Municipal demand is strong, supported by government initiatives such as the Europe Green Deal, and the U.S. EPA Clean Water State Revolving Fund, which finances clarifier adoption in municipal plants. In the Asia Pacific, rapid urban growth in India and China has led to large-scale wastewater treatment projects, with clarifiers forming the backbone of sedimentation processes.
Product Type Segment Analysis
By the end of the stipulated timeline, the coagulants segment, part of the product type, is expected to account for the third-largest share in the water clarifiers market. The segment’s development is highly propelled by the aspect of neutralizing negative charges of suspended and tiny particles, including bacteria, organic matter, and clay. These tend to naturally repel each other, resulting in clumping together into heavy and large masses. According to official statistics published by MDPI in October 2025, the efficiency of traditional aluminum as well as iron-specific coagulants usually ranges from 30% to 90% for pesticides or natural organic matter (NOM), 10% to 60% for pharmaceuticals, more than 20% for PFAS, and almost 95% for microplastics. Besides, unmodified particles can diminish a comprehensive range of organic and inorganic contaminants, readily exceeding 90%, thus denoting a huge growth opportunity for the segment.
Our in-depth analysis of the water clarifiers market includes the following segments:
|
Segment |
Subsegments |
|
End user |
|
|
Application |
|
|
Product Type |
|
|
Industry Vertical |
|
|
Distribution Channel |
|
|
Formulation |
|

Vishnu Nair
Head - Global Business DevelopmentCustomize this report to your requirements — connect with our consultant for personalized insights and options.
Water Clarifiers Market - Regional Analysis
North America Market Insights
North America water clarifiers market is anticipated to garner the largest share of 34.7% by the end of 2035. The market’s uplift in the region is largely attributed to the presence of stringent effluent discharge standards under the Clean Water Act, which has readily fueled the need for clarifiers in industrial and municipal wastewater treatment. Besides, according to official statistics published by the BCSE Organization in 2025, robust state and federal policy signals have successfully translated into generous investment, amounting to approximately USD 99 billion of federal funding as of 2024. In addition, there has been an expansion in the U.S. economy by 2.8%, while the primary energy consumption surged by only 0.5%. Besides, the National Institute of Standards and Technology (NIST) ensures innovative manufacturing, which directly supports the clarifier demand in the overall region.
The water clarifiers market in the U.S. is growing significantly due to regulatory enforcement, federal funding for clean energy chemicals, advanced manufacturing strategies, and green chemistry adoption. Based on government data published by the EPA Government in March 2025, each resident in the country utilizes an average of 82 gallons of water per day, and 20% of less water utilization by installing water-efficient appliances and fixtures. The average family in the country spends over USD 1,000 per year in water expenses, but can also save over USD 380 yearly from retrofitting with WaterSense fixtures. Moreover, as per the June 2023 DOI Government article, the department declared a USD 140 million investment for water efficiency and conservation projects, which is part of the America agenda to boost resilience to climate change and drought, thus making it suitable for uplifting the water clarifiers market.
The water clarifiers market in Canada is also growing, owing to an increase in government investment in clean energy chemicals, the presence of municipal water infrastructure programs, environmental sustainability mandates, and suitable partnerships with industry associations. As per an article published by the Government of Canada in September 2025, the country is rich in freshwater, accounting for 20% of global freshwater reserves, and almost 7% of the world’s yearly renewable water. Besides, more than 34,410 million cubic meters of water have been withdrawn from the country’s groundwater, lakes, and rivers. In addition, 78.3% of the withdrawal was derived from thermal power generation, constituting 22,903 million cubic meters and 4,046 million cubic meters from manufacturing. Besides, governmental investments play a huge role in proliferating the water clarifiers market in the country.
Government of Canada Investment for Freshwater (2023-2024)
|
Investment Amount (USD Million) |
Duration |
Purpose |
Location |
|
650 |
10 years |
Support restoration, assessment, and monitoring operations |
Great Lakes, Lake Winnipeg, Lake of the Woods, St. Lawrence River, Fraser River, Saint John River, Mackenzie River, and Lake Simcoe |
|
22.6 |
More than 3 years |
Support better coordination for protecting freshwater |
Whole of the country |
|
85.1 |
5 years |
USD 21 million every year to support the Canada Water Agency creation |
Winnipeg |
Source: United Nation Organization
Europe Market Insights
Europe water clarifiers market is expected to emerge as the fastest-growing region during the forecast period. The market’s development in the region is highly propelled by sustainability initiatives under the regional Green Deal, industrial wastewater treatment demand, and strict environmental regulations. As per official statistics published by Europe Parliament in June 2024, Horizon Clusters have readily mobilized over €9 billion for Green Deal-based projects. In addition, the regional Member States significantly pledged to diminish the continent’s net greenhouse gas emissions by almost 55% by the end of 2030. Moreover, as per the February 2024 Federal Ministry for Economic Affairs and Climate Action (BMWK) data report, the federal government allocated an investment of €11.5 billion as of 2024. Simultaneously, the overall region is subject to water filtration and purification equipment, which is also bolstering the water clarifiers market.
2023 Water Filtration and Purification Equipment Export and Import in Europe
|
Countries |
Export (USD) |
Import (USD) |
|
Germany |
41.6 million |
68.1 million |
|
Belgium |
24.7 million |
2.1 million |
|
France |
24.6 million |
15.9 million |
|
Ireland |
11.4 million |
- |
|
Netherlands |
10.3 million |
19.2 million |
|
Poland |
8.9 million |
3.8 million |
|
Italy |
6.7 million |
34 million |
|
Norway |
6 million |
1.3 million |
Source: OEC
The water clarifiers market in Germany is gaining increased traction due to its government-backed sustainability programs and the presence of its robust chemical industrial base. As per a data report published by the Oxford Institute for Energy Studies in November 2024, the country’s government has allocated €3.5 billion for hydrogen globally. In this regard, Uniper significantly partnered with Denmark’s CIP to generously bring 140,000 tons per year of Danish hydrogen to the country. Additionally, the organization has also signed a preliminary 10-year agreement with Provaris Energy to import 40,000 tons of hydrogen every year in compressed form. Besides, as stated in an article published by Europe Commission in 2024, approximately €275 billion of NextGenerationEU, along with REPowerEU funds, tend to support clean investments, as well as €118 billion of Cohesion Policy, are embarked for ensuring the clean transition.
The water clarifiers market in the UK is also developing, owing to industrial sustainability approaches, municipal water infrastructure modernization, and advancements by regional programs. Based on the May 2023 UK Government article, the UK Semiconductor Infrastructure Initiative has invested almost £200 million into the domestic semiconductor industry between 2023 and 2025, along with an additional £1 billion for the upcoming decade. Besides, the government duly supported the Department for Education’s (DfE) Institute of Technology programme, significantly backed by £300 million of government capital investment. This has led to encouraging increased employers for serving the semiconductor sector to readily engage with the institute to successfully ensure the industry’s specialisms, thus making it suitable for boosting the market’s growth.
APAC Market Insights
The Asia Pacific water clarifiers market is expected to witness considerable growth by the end of the stipulated timeline. The market’s growth in the region is highly fueled by government sustainability and clean energy initiatives, an increase in rapid urbanization, and a surge in the demand for industrial wastewater treatment. As per official statistics published by the Green FDC Organization in March 2024, the green loan balance of China effectively reached RMB 30.0 trillion (USD 4.2 billion) as of 2023, denoting a 36.5% year-on-year increase and further accounting for 12.7% of the overall loan balance. Besides, the nation’s domestic carbon industry traded 212 million tons in 2023, with yearly transaction value surging to RMB 14.4 billion (USD 2.0 billion) from RMB 2.8 billion (USD 397.6 million) in 2022. Therefore, with an increase in the focus on green finance, there is a huge growth opportunity for the market in the region.
The water clarifiers market in China is gaining increased exposure due to the aspect of enforcing stringent wastewater discharge standards that have compelled sectors to adopt clarifiers. As stated in an article published by the State Council in August 2023, by the end of 2025, the country successfully aimed to increase regular sewage treatment capacity by a volume of 12 million cubic meters. In addition, the country also expanded and renovated the sewage collection network, gradually stretching 45,000 kilometers and raising domestic garbage collection and sorting capacity to 700,000 tons every day. Besides, as per the March 2025 Green FDC Organization article, the issuance volume of carbon-neutral bonds increased by 7%, along with a 19% surge in the number of bonds, and meanwhile, the issuance volume for blue bonds grew by 51.9%, thus denoting a huge growth opportunity for the market.
The water clarifiers market in India is also growing, owing to the aspect of prioritizing wastewater treatment technologies under the National Chemical Sustainability Mission, along with the Federation of India Chambers of Commerce & Industry (FICCI) highlighting the clarifier implementation in petrochemicals, food processing, and textiles. According to the July 2022 ITA article, the waste and wastewater treatment industry reached USD 2.0 billion as of 2025, and registering 9.7% as a yearly growth rate. Besides, the Jal Shakti Ministry unveiled the Jal Jeevan Mission, which has been designed to offer piped drinking water to 146 million households across 700,000 villages as of 2024. This particular mission earmarked a budget of USD 51 billion for states to enhance household water connection coverage from 18.3% to 100% in 2024, thereby denoting a growth opportunity for the market.
Key Water Clarifiers Market Players:
- BASF SE (Germany)
- Ecolab Inc. (U.S.)
- SUEZ Water Technologies & Solutions (France)
- Veolia Environnement S.A. (France)
- Xylem Inc. (U.S.)
- Kurita Water Industries Ltd. (Japan)
- Evoqua Water Technologies LLC (U.S.)
- Aries Chemical Inc. (U.S.)
- Parkson Corporation (U.S.)
- Murugappa Organo Water Solutions Pvt. Ltd. (India)
- Kemira Oyj (Finland)
- SNF Group (France)
- Dow Chemical Company (U.S.)
- Solvay S.A. (Belgium)
- Hitachi Zosen Corporation (Japan)
- Hyflux Ltd. (Singapore)
- IXOM Watercare (Australia)
- LG Chem Ltd. (South Korea)
- Petronas Chemicals Group Berhad (Malaysia)
- Akzo Nobel N.V. (Netherlands)
- Company Overview
- Business Strategy
- Key Product Offerings
- Financial Performance
- Key Performance Indicators
- Risk Analysis
- Recent Development
- Regional Presence
- BASF SE is recognized as one of the leading chemical suppliers in the water clarifiers market, offering advanced coagulants and flocculants for municipal and industrial applications. The company emphasizes sustainability by investing in eco-friendly formulations and expanding its portfolio to meet Europe-driven regulatory standards on wastewater treatment.
- Ecolab Inc. is a major player in water treatment solutions, integrating clarifiers into its broader portfolio of industrial and municipal water management systems. The company leverages its global presence to deliver customized clarifier solutions, focusing on digital monitoring and sustainability, earning recognition for leadership in water and climate performance.
- SUEZ Water Technologies & Solutions is a key provider of clarifier systems, particularly in municipal wastewater treatment. The company’s growth strategy centers on innovation in sedimentation and flocculation technologies, supported by partnerships with governments and industries to meet Europe water quality directives.
- Veolia Environnement S.A. global leader in water and wastewater management, with clarifiers forming a core part of its treatment solutions. The company focuses on large-scale municipal projects and industrial partnerships, aligning with Europe-based sustainability goals and expanding its footprint in emerging markets.
- Xylem Inc. is a prominent U.S.-based water technology company, offering clarifiers as part of its advanced treatment systems. Its strategy emphasizes digital integration, including IoT-enabled clarifiers for predictive maintenance, and sustainability-driven solutions to support industrial and municipal clients worldwide.
Here is a list of key players operating in the global market:
The international water clarifiers chemical market is highly competitive, with BASF, Veolia, and Ecolab leading through sustainability-driven innovations and large-scale municipal partnerships. Kurita Water Industries and LG Chem are expanding digital water solutions in the Asia Pacific, while Murugappa Organo Water Solutions strengthens India’s industrial wastewater treatment sector. Strategic initiatives include research and development investments in eco-friendly clarifiers, mergers and acquisitions to expand geographic reach, and partnerships with governments to meet regulatory compliance. Companies are also focusing on IoT-enabled clarifiers for predictive maintenance and efficiency. Besides, in November 2025, Wärtsilä Water & Waste continued delivering outstanding wastewater treatment performance in one of the world’s most monitored marine environments through its very own Hamworthy membrane bioreactor (MBR) systems, thus suitable for boosting the water clarifiers industry globally.
Corporate Landscape of the Water Clarifiers Market:
Recent Developments
- In September 2025, OCI Global and Orascom Construction PLC declared that they are significantly integrating a potential merger and successfully establishing a scalable investment and infrastructure platform, which is anchored in Abu Dhabi.
- In April 2025, Arcadis has been successfully selected to deliver two major tactical contracts in São Paulo by the Brazil-based water and waste management organization, Sabesp. These particular contracts are focused on enhancing water facilities and securing a resilient and safe supply for over 28 million people in 375 municipalities.
- In March 2025, Croda Singapore has significantly partnered with NanoSun for constructing an innovative wastewater treatment infrastructure at its Seraya manufacturing hub on Jurong Island.
- Report ID: 8351
- Published Date: Jan 16, 2026
- Report Format: PDF, PPT
- Explore a preview of key market trends and insights
- Review sample data tables and segment breakdowns
- Experience the quality of our visual data representations
- Evaluate our report structure and research methodology
- Get a glimpse of competitive landscape analysis
- Understand how regional forecasts are presented
- Assess the depth of company profiling and benchmarking
- Preview how actionable insights can support your strategy
Explore real data and analysis
Frequently Asked Questions (FAQ)
Water Clarifiers Market Report Scope
Free Sample includes current and historical market size, growth trends, regional charts & tables, company profiles, segment-wise forecasts, and more.
Connect with our Expert


Copyright @ 2026 Research Nester. All Rights Reserved.
