Spend Analytics Software Market Outlook:
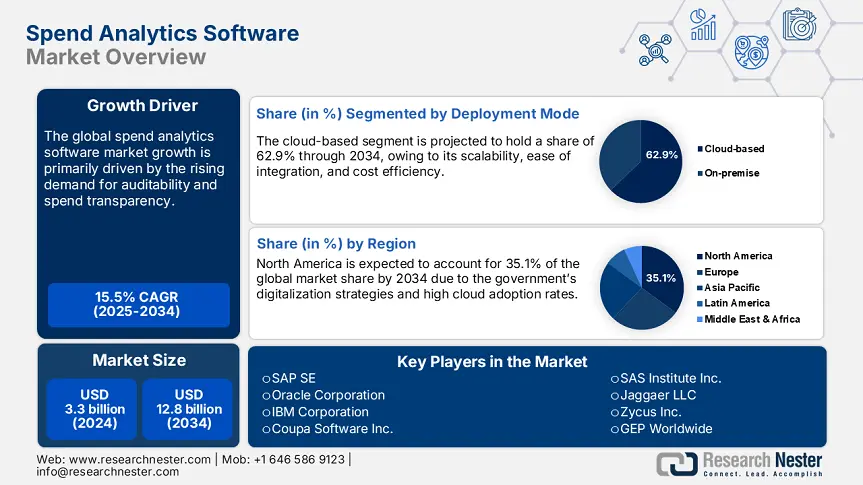
Spend Analytics Software Market size was USD 3.3 billion in 2024 and is estimated to reach USD 12.8 billion by the end of 2034, expanding at a CAGR of 15.5% during the forecast period, i.e., 2025-2034. In 2025, the industry size of spend analytics software is estimated at USD 3.8 billion.
The trends and pricing shifts in the enterprise IT procurement and supply chain optimization tools are influencing the global trade of spend analytics software market. The stable flow of specialized raw materials and components is a pillar for the high sales of spend analytics software solutions. The U.S. Bureau of Economic Analysis states that the producer price index (PPI) for computer systems design and related services grew by 3.3% year-over-year in May 2024, reflecting high upstream pricing pressure from software development and integration costs. Also, the consumer price index (CPI) for information technology services increased by 2.4% during the same period, indicating elevated costs passed down to enterprise users.
The boom in IT service investments is also driving the deployment of spend analytics software solutions. The U.S. federal agency technology budgets collectively exceeded USD 78.5 billion in the fiscal year 2024. This reflects a rise in the adoption of technologies with analytics capabilities. The import/export dynamics also potentially influence the sales of spend analytics software solutions. According to the Census Bureau, the U.S. imports of telecommunications equipment crossed USD 59.0 billion in 2023. The booming cross-border trade and swift rise in the adoption of smart technologies are set to double the revenues of spend analytics software companies in the coming years.
Spend Analytics Software Market - Growth Drivers and Challenges
Growth Drivers
-
Public sector digital procurement initiatives: The hefty public investments in the digital transformation of procurement systems to enhance transparency and accountability are poised to fuel the sales of spend analytics software solutions. The U.S. IT Dashboard reveals that more than USD 78.5 billion was allocated for federal IT investments in FY2024, with a substantial portion focused on financial management systems. Also, the government of India’s eMarketplace (GeM) integrated spend analytics to streamline vendor management across ministries.
-
Rising demand for auditability and spend transparency: Many large companies are under pressure to ensure audit trails for vendor payments and compliance with anti-corruption standards, which is propelling the demand for spend analytics software market. The advanced solutions that offer end-to-end traceability, from purchase order to payment, are poised to exhibit high demand in the coming years. ENISA’s 2024 report reveals that secure data flows in procurement platforms are a core requirement for minimizing insider threats and fraud. Such observations are expected to increase the importance and application of spend analytics software technologies in the years ahead. These solutions are also highly deployed in areas where regulatory fines for procurement fraud are high.
Technological Innovations in the Spend Analytics Software Market
Artificial intelligence, machine learning, and cloud computing are expected to boost the sales of spend analytics software solutions in the coming years. The digital shift in education, telecom, manufacturing, finance, and healthcare sectors is also estimated to propel the demand for spend analytics software market. The continuous investments in technological innovations are further set to open high-earning opportunities for key players. The table below reveals the current technological trends and their outcomes in the spend analytics software market.
|
Technology |
Industry |
Company |
Adoption Rate / Outcome |
|
AI/ML Spend Forecasting |
Finance |
JPMorgan Chase |
72.5% of finance firms use AI tools for risk profiling |
|
Blockchain Auditing |
Healthcare |
Mayo Clinic |
38.3% hospitals use blockchain for procurement traceability |
|
Cloud Spend Analytics |
Telecom |
Deutsche Telekom |
100% cloud-based shift reduced sourcing cycle time by 35.6% |
AI & ML Shaping the Future of Spend Analytics Software Market
|
Company |
Integration of AI & ML |
Outcome |
|
Coupa Software |
Implemented AI for real-time spend classification and anomaly detection |
Reduced manual processing time by 89%; increased anomaly detection by 82% |
|
Jaggaer |
Integrated ML for predictive sourcing and supplier risk scoring |
Cut supplier onboarding time by 28.5%; improved sourcing efficiency by 25.5% |
|
Sievo |
Used AI to automate spend data mapping and enrichment |
Lowered data processing cost by 19%; increased accuracy of insights by 22% |
|
SAP Ariba |
Leveraged AI for contract analytics and category-level spend forecasting |
Reduced time-to-market by 29%; improved contract compliance by 22% |
|
Zycus |
Applied AI-powered bots for invoice processing and spend categorization |
Achieved 70% improvement in invoice cycle time; cut AP costs by 15% |
Challenges
-
High cybersecurity and compliance costs: The high capital requirements for cybersecurity compliance are expected to hamper the sales of spend analytics software platforms to some extent. Small and medium-sized enterprises often hesitate to expand their operations due to high compliance costs. The European Union Agency for Cybersecurity (ENISA) report discloses that the cybersecurity compliance spending grew by 25.5% YoY between 2023 and 2024, mainly due to new federal mandates. This reflects limited adoption of spend analytics software platforms among smaller software developers and government contractors.
-
Inadequate digital infrastructure: The inadequacy of basic ICT infrastructure in some parts of emerging countries is likely to hinder the adoption of spend analytics software platforms. Cloud data centers, high-speed internet, and secure data hosting are vital for the efficient operations of spend analytics software solutions. The International Trade Union (ITU) states that less than 40.5% of small firms in Latin America and Africa had access to enterprise-grade cloud environments in 2023. Moreover, the increasing need for cloud-based and hybrid models necessitates heavy investments in digital infrastructure is expected to directly hamper the sales of spend analytics software platforms to some extent.
Spend Analytics Software Market Size and Forecast:
| Report Attribute | Details |
|---|---|
|
Base Year |
2024 |
|
Forecast Year |
2025-2034 |
|
CAGR |
15.5% |
|
Base Year Market Size (2024) |
USD 3.3 billion |
|
Forecast Year Market Size (2034) |
USD 12.8 billion |
|
Regional Scope |
|
Spend Analytics Software Market Segmentation:
Deployment Mode Segment Analysis
The cloud-based deployment segment is projected to capture 62.9% of the global spend analytics software market share by 2034, owing to its scalability, ease of integration, and cost efficiency. Government procurement modernization strategies favoring cloud-first strategies are further contributing to the segment growth. Also, the mandates by federal agencies are increasing the sales of cloud-based spend analytics software platforms. For example, the U.K. Cabinet Office’s Digital Marketplace reported a steady rise in cloud-based SaaS procurement tools under the G-Cloud framework. The ability to bypass infrastructure investments and rapidly deploy scalable platforms is boosting the public and private sectors' spending in cloud-based analytics.
Application Segment Analysis
The financial management segment is estimated to account for 40.1% of the spend analytics software market share throughout the forecast period. The increasing pressure on organizations to optimize operational expenditure and enhance cash flow visibility is propelling the adoption of spend analytics software tailored for financial management. As per a report by the U.S. Government Accountability Office (GAO), the poor spend visibility adds to billions in wasteful federal procurement spending annually. This is mitigated by using advanced spend analytics tools designed for finance teams that offer automation of audit trails, budgeting, and forecasting.
Our in-depth analysis of the global spend analytics software market includes the following segments:
|
Segment |
Subsegments |
|
Deployment Mode |
|
|
Application |
|
|
End user |
|

Vishnu Nair
Head - Global Business DevelopmentCustomize this report to your requirements — connect with our consultant for personalized insights and options.
Spend Analytics Software Market - Regional Analysis
North America Market Insights
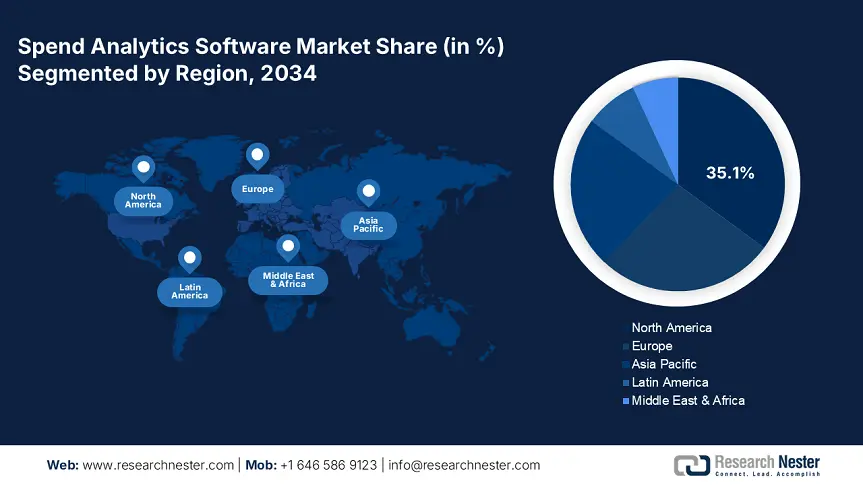
The North America spend analytics software market is expected to hold 35.1% of the global revenue share through 2034, owing to structured regulatory frameworks. The strong government digitalization strategies and high cloud adoption rates are boosting the sales of spend analytics software platforms. Canada’s ISED under the Universal Broadband Fund has allocated around CAD 3.3 billion, which reinforces analytics tool adoption in underserved areas. The education and healthcare sectors are likely to lead the sales of spend analytics software solutions. The hefty spending on digital infrastructure is also contributing to the trade of spend analytics software solutions.
The demand for spend analytics software market in the U.S. is driven by hefty federal spending on ICT and digital infrastructure. The procurement automation and cybersecurity modernization are also supporting the increasing sales of spend analytics software solutions. The public investments in IT crossed USD 78.5 billion in 2024. The substantial portion of this funding was allocated for procurement systems under the Federal IT Dashboard program. The FCC’s Affordable Connectivity Program and USAC’s E-Rate Program are accelerating the application of spend analytics software solutions in the education sector.
Europe Market Insights
The Europe spend analytics software market is poised to account for 27.2% of the global revenue share throughout the study period. The widespread digital transformation mandates and sustainability-linked procurement regulations are promoting the sales of spend analytics software solutions. The cross-border interoperability initiatives are also propelling the adoption of spend analytics software technologies. The Digital Europe Programme allocated €250.5 million between 2021 and 2027, especially for AI and analytics innovation, which has significantly advanced public sector procurement systems.
The digitalization trend and hefty ICT investments are expected to boost the spend analytics software market growth in Germany. The digital market was totaled at €44.7 billion in 2024, and around €5.0 billion of it was allocated for the enhancement of spend analytics solutions. Also, the Federal Ministry for Digital and Transport (BMDV) prioritized AI-integrated procurement platforms, supported by its €3.1 billion public sector digital transformation agenda. The supportive government policies and funding initiatives are projected to propel the sales of spend analytics software technologies. The manufacturing, energy, and smart city sectors are also fueling the adoption of spend analytics software solutions.
Country-Specific Insights
|
Country |
2023 Allocation to Spend Analytics |
2024 Spend on Analytics Tools |
Growth Trend (2021-2024) |
|
United Kingdom |
10.3% of the digital budget |
£1.63 billion |
+18.7% |
|
Germany |
11.3% of the ICT budget |
€5.0 billion |
+21.5% |
|
France |
9.6% of the ICT budget |
€3.3 billion |
+18.0% |
APAC Market Insights
The Asia Pacific spend analytics software market is expected to increase at a CAGR of 15.1% from 2025 to 2034, owing to the aggressive digitization programs and public procurement reforms. China, India, Japan, South Korea, and Malaysia are some of the most opportunistic marketplaces for key players. The expanding ICT investments in these countries are attracting numerous international players. The public healthcare and smart city sectors are poised to propel the adoption of spend analytics software technologies in the years ahead.
China spend analytics software market leads the sales of spend analytics software solutions, owing to its massive digital governance reforms and booming enterprise cloud adoption. The public investments for spend analytics software solutions grew by 43.3% between 2019 and 2024. In 2023, more than 3.3 million enterprises adopted analytics solutions, particularly across public procurement, manufacturing, and telecom sectors. Also, the 14th Five-Year Plan, which emphasizes digital infrastructure and mandates the integration of data-driven procurement tools in the public sector, is boosting the growth of the spend analytics software market. Continuous technological advancements are likely to propel the adoption of spend analytics software technologies in the transportation, energy, and healthcare sectors.
Country-Specific Insights
|
Country |
Govt ICT Allocation to Spend Analytics |
2023-2024 Key Statistics |
|
Japan |
7.7% (2024) |
+$1.7B vs. 2022 |
|
India |
+52.4% (2015-2023) |
$2.5B spent; 5.5M businesses use analytics |
|
Malaysia |
+64.5% funding growth |
3× firm-level adoption (2013-2023) |
|
South Korea |
$3.2B smart ICT AI budget (2023) |
Enhanced analytics in 74.3% of public tenders |
Key Spend Analytics Software Market Players:
- Company Overview
- Business Strategy
- Key Product Offerings
- Financial Performance
- Key Performance Indicators
- Risk Analysis
- Recent Development
- Regional Presence
- SWOT Analysis
The global spend analytics software market is dominated by gigantic companies holding more than 38% of the total share. Industry giants are focused on robust enterprise offerings and deep integration capabilities to boost their position in the competitive landscape. They are also integrating digital technologies, sustainability metrics, and real-time procurement visibility into their solutions to attract tech-savvy customers. Furthermore, mid-sized players are collaborating with other companies to increase their spend analytics software market reach and profit shares. Also, strategic partnerships, mergers & acquisitions, and regional expansion tactics are expected to double the revenues of key players in the years ahead.
Here is a list of key players operating in the spend analytics software market:
|
Company Name |
Country of Origin |
Revenue Share 2024 |
|
SAP SE |
Germany |
14.5% |
|
Oracle Corporation |
USA |
12.8% |
|
IBM Corporation |
USA |
11.0% |
|
Coupa Software Inc. |
USA |
9.5% |
|
SAS Institute Inc. |
USA |
6.9% |
|
Jaggaer LLC |
USA |
xx% |
|
Zycus Inc. |
India |
xx% |
|
GEP Worldwide |
USA |
xx% |
|
Proactis Holdings Ltd |
UK |
xx% |
|
Rosslyn Data Technologies |
UK |
xx% |
|
SynerTrade (Econocom Group) |
France |
xx% |
|
SutiSoft Inc. |
USA |
xx% |
|
Simfoni |
USA |
xx% |
|
Xeeva Inc. |
USA |
xx% |
Below are the areas covered for each company in the spend analytics software market:
Recent Developments
- In March 2024, SAP SE announced the launch of its new Spend Control Tower platform at the SAP Sapphire 2024 event. The solution offers real-time, AI-driven procurement visibility across global operations.
- In June 2024, Coupa launched AI Spend Forecasting, a module within its Business Spend Management (BSM) suite. Within the first month of launch, more than 1,300 enterprise clients adopted this solution.
- In February 2024, IBM Corporation integrated quantum-safe encryption protocols into its Spend Intelligence Suite. The application of these solutions in the U.S. defense procurement division resulted in a 45.5% reduction in data breach exposure risk.
- Report ID: 3958
- Published Date: Jul 28, 2025
- Report Format: PDF, PPT
- Explore a preview of key market trends and insights
- Review sample data tables and segment breakdowns
- Experience the quality of our visual data representations
- Evaluate our report structure and research methodology
- Get a glimpse of competitive landscape analysis
- Understand how regional forecasts are presented
- Assess the depth of company profiling and benchmarking
- Preview how actionable insights can support your strategy
Explore real data and analysis
Frequently Asked Questions (FAQ)
About this Report
Connect with our Expert


Copyright @ 2026 Research Nester. All Rights Reserved.
