Seismic Survey Market Outlook:
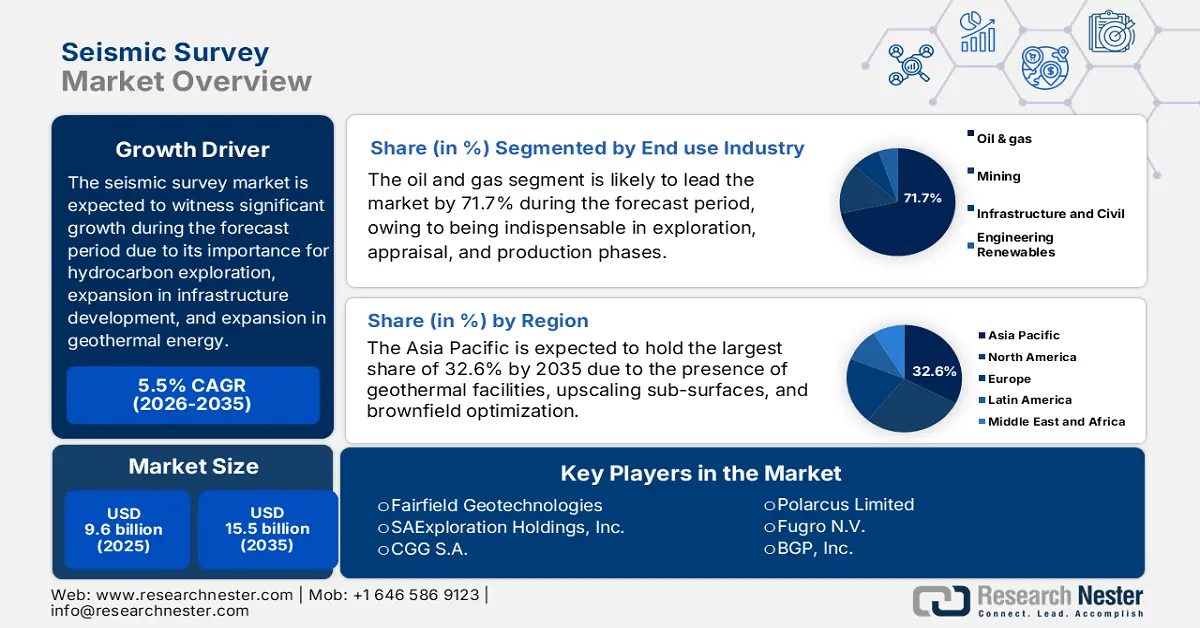
Seismic Survey Market size was over USD 9.6 billion in 2025 and is estimated to reach USD 15.5 billion by the end of 2035, expanding at a CAGR of 5.5% during the forecast timeline, i.e., 2026-2035. In 2026, the industry size of seismic survey is evaluated at USD 10.1 billion.
The worldwide seismic survey market is evolving as a vital component for hydrocarbon exploration, but its role is broadening into infrastructure development, geothermal energy, mining, and carbon capture and storage (CCS). According to an article published by the IEA Organization in 2025, carbon capture, utilization, and storage (CCUS) has been growing substantially, with more than 700 projects in different developmental stages. In 2023, the announced capture capacity for 2030 was enhanced by 35%, while the announced storage capacity increased by 70%. This has brought the overall carbon dioxide amount that is projected to be captured by the end of 2030 to almost 435 million tons every year, along with announced storage capacity to nearly 615 million tons of carbon dioxide every year. This has also created an optimistic outlook for the net-zero scenario, thereby suitable for uplifting the market’s exposure globally.
Current Capacity and Planned Carbon Dioxide Capture Projects and the NetZero Scenario (2020-2030)
|
Year |
Operating (Million Tons CO2 Per Year) |
Under Construction (Million Tons CO2 Per Year) |
Advanced Development (Million Tons CO2 Per Year) |
Concept and Feasibility (Million Tons CO2 Per Year) |
Gap to NZE (Million Tons CO2 Per Year) |
|
2020 |
46 |
- |
- |
- |
- |
|
2022 |
48 |
- |
- |
- |
- |
|
2024 |
50 |
7 |
7 |
1 |
- |
|
2026 |
50 |
33 |
48 |
37 |
- |
|
2028 |
50 |
38 |
117 |
90 |
- |
|
2030 |
50 |
38 |
142 |
205 |
589 |
Source: IEA Organization
Furthermore, the adoption of 3D and 4D imaging, machine learning and artificial integration (AI) integration, marine nodal systems, multi-client data libraries, along with ESG and sustainability compliance, are other drivers that are fueling the seismic survey market globally. As per an article published by NLM in August 2023, the aspect of lung nodules from CT scans segmentation utilizing AI has displayed superior performance in the early treatment and detection of lung cancer by achieving the area under the receiver operating characteristic curve (AUROC) of 94.4%. Besides, the comparison between AI-driven computer-aided diagnostics (CAD) and conventional CAD software has readily outperformed with the AI implementation by lowering false-positive marks per image (FPPI) by an effective 69%. This has specifically exceeded in recognizing masses and microcalcifications, thereby diminishing false positives by 56% and 83%, thereby suitable for bolstering the seismic survey market’s expansion and demand.
Key Seismic Survey Market Insights Summary:
Regional Highlights:
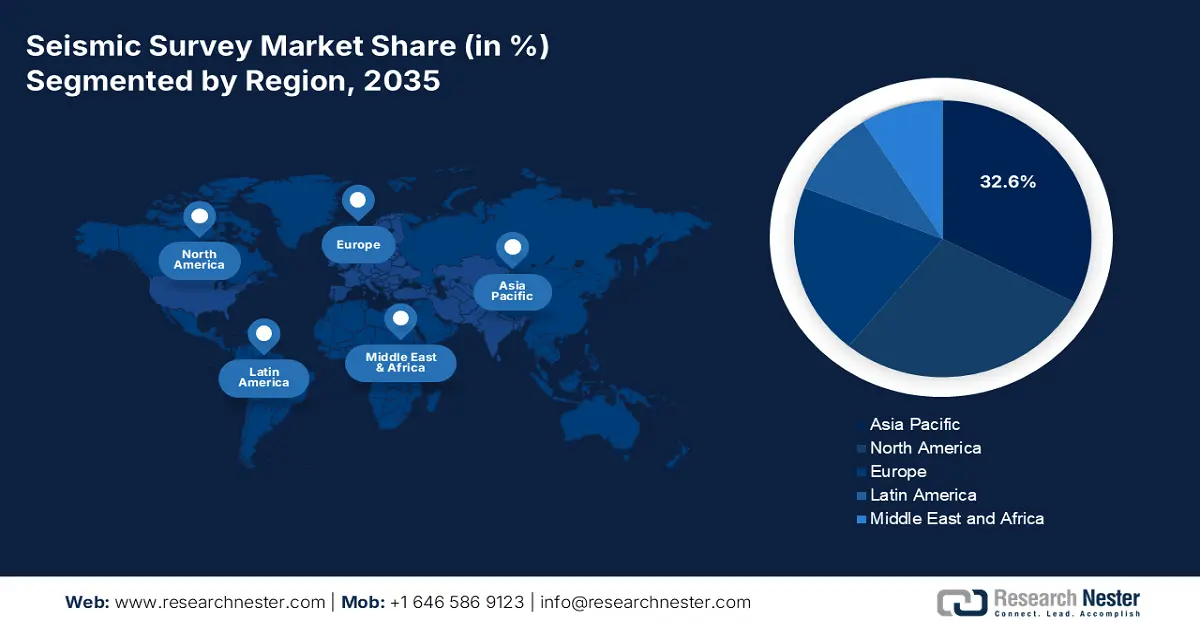
- Asia Pacific is forecast to command a leading 32.6% share by 2035 in the seismic survey market, supported by rising underground and geothermal infrastructure development alongside expanding subsurface services for CCS, brownfield optimization, and deepwater exploration.
- Europe is anticipated to register the fastest growth through 2035, stimulated by infrastructure geophysics, accelerating geothermal adoption, CCS-focused subsurface appraisal, and mature offshore redevelopment in the North Sea.
Segment Insights:
- The oil and gas segment is expected to secure a commanding 71.7% share by 2035 in the seismic survey market, reinforced by the indispensable use of seismic surveys across exploration, appraisal, and production to deliver high-resolution subsurface imaging that lowers drilling risk and optimizes reservoir management.
- The 3D imaging sub-segment is projected to represent the second-largest share by 2035, enabled by its advanced volumetric subsurface visualization that enhances geological interpretation accuracy and minimizes exploration uncertainty.
Key Growth Trends:
- Exploration in deepwater
- Expansion of geothermal energy
Major Challenges:
- Increased operational expenses
- A surge in environmental concerns
Key Players: Schlumberger Limited (U.S.), Halliburton Company (U.S.), Baker Hughes Company (U.S.), Fairfield Geotechnologies (U.S.), SAExploration Holdings, Inc. (U.S.), CGG S.A. (France), TGS-NOPEC Geophysical Company ASA (Norway), PGS ASA (Norway), Polarcus Limited (Norway), Fugro N.V. (Netherlands), BGP, Inc. (China), Sinopec Geophysical Corporation (China), JOGMEC – Japan Oil, Gas and Metals National Corporation (Japan), INPEX Corporation (Japan), Geoscience Australia (Australia), Korea Institute of Geoscience and Mineral Resources (South Korea), Oil and Natural Gas Corporation Limited (India), National Oil Company Malaysia (Malaysia), WesternGeco (U.S.), Spectrum ASA (United Kingdom).
Global Seismic Survey Market Forecast and Regional Outlook:
Market Size & Growth Projections:
- 2025 Market Size: USD 9.6 billion
- 2026 Market Size: USD 10.1 billion
- Projected Market Size: USD 15.5 billion by 2035
- Growth Forecasts: 5.5% CAGR (2026-2035)
Key Regional Dynamics:
- Largest Region: Asia Pacific (32.6% Share by 2035)
- Fastest Growing Region: Europe
- Dominating Countries: United States, China, Norway, United Kingdom, Brazil
- Emerging Countries: India, Australia, Malaysia, Indonesia, Vietnam
Last updated on : 23 December, 2025
Seismic Survey Market - Growth Drivers and Challenges
Growth Drivers
- Exploration in deepwater: The rising demand for hydrocarbons in frontier basins is driving generous investments in the seismic survey market, especially across offshore regions, such as the Asia Pacific, Brazil, and the Gulf of Mexico. According to an article published by the U.S. Department of Energy (DOE) in 2025, the Ultra-Deepwater and Unconventional Natural Gas and Other Petroleum Resources Research Program, introduced by the Energy Policy Act, is regarded as a private and public partnership valued at USD 400 million for more than 8 years. Additionally, the non-profit consortium utilization is useful for managing the research by establishing two essential federal advisory committees and generously funding USD 50 million every year. This is readily derived from bonuses, rents, and royalties from federal offshore and onshore oil and gas leases.
- Expansion of geothermal energy: The seismic survey market is increasingly utilized to recognize geothermal reservoirs for supporting renewable energy growth in North America, APAC, and Europe. As per an article published by the EIA Government in April 2024, the U.S. comprises geothermal power plants across 7 states as of 2023, producing nearly 0.4%, which is 17 billion kWh of the overall domestic utility-scale electricity generation. Besides, utility-scale power plants have at least 1,000 kilowatts, equivalent to 1 megawatt of electricity capacity. Moreover, 24 nations readily generated nearly 92 billion kWh of electricity from geothermal energy. Besides, the presence of geothermal power plants in other states is also fueling the market’s demand in the country.
Geothermal Power Plants in the U.S. (2023)
|
States |
State Share of Geothermal Electricity Generation |
Geothermal Share of Total State Electricity Generation |
|
California |
66.6% |
5.1% |
|
Nevada |
26.1% |
10.15 |
|
Utah |
3.2% |
1.5% |
|
Hawaii |
2.1% |
3.7% |
|
Oregon |
1.3% |
0.4% |
|
Idaho |
0.5% |
0.6% |
|
New Mexico |
0.2% |
0.1% |
Source: EIA Government
- Focus on mining and infrastructure applications: The aspect of subsurface imaging is readily being deployed in mineral exploration, tunneling, and civil engineering projects. This is eventually diversifying revenue systems beyond oil and gas, thereby proliferating the seismic survey market globally. As stated in an article published by the World Bank Organization in 2025, minerals usually represent 1% to 2.5% of formal employment, along with 12.5% of additional and indirect employment across supply chains. Moreover, mineral revenues tend to account for more than 6% of GDP and almost 20% of exports. Besides, as stated in the October 2024 World Resources Institute Organization article, mining has readily increased by 52%, owing to a surge in the need for industrial minerals, iron, coal, and other metals, thus contributing to the market’s upliftment.
Challenges
- Increased operational expenses: The seismic survey market is capital-intensive, requiring specialized vessels, advanced sensors, and skilled personnel. Offshore surveys, particularly in deepwater and ultra-deepwater regions, can be expensive due to vessel mobilization, equipment deployment, and data processing. The adoption of advanced technologies like 3D/4D imaging and ocean-bottom nodes further increases costs, as these systems demand sophisticated hardware and software integration. Smaller operators often struggle to afford such investments, limiting market participation to large multinational corporations. Additionally, fluctuating oil prices exacerbate cost pressures, as exploration budgets are directly tied to commodity cycles, thereby negatively impacting the market’s growth.
- A surge in environmental concerns: The seismic survey market utilizes powerful acoustic sources to map subsurface geology, which can disrupt marine ecosystems. Studies have shown that seismic airgun blasts can affect fish behavior, reduce catch rates, and disturb marine mammals such as whales and dolphins. Environmental groups and regulators increasingly scrutinize seismic operations, leading to stricter permitting processes and operational restrictions. For instance, surveys in ecologically sensitive areas often face seasonal bans to protect breeding or migration cycles. Public opposition to offshore drilling amplifies resistance to seismic surveys, particularly in regions such as Europe and North America, where environmental activism is strong.
Seismic Survey Market Size and Forecast:
| Report Attribute | Details |
|---|---|
|
Base Year |
2025 |
|
Forecast Year |
2026-2035 |
|
CAGR |
5.5% |
|
Base Year Market Size (2025) |
USD 9.6 billion |
|
Forecast Year Market Size (2035) |
USD 15.5 billion |
|
Regional Scope |
|
Seismic Survey Market Segmentation:
End use Industry Segment Analysis
The oil and gas segment, which is part of the end use industry, is anticipated to garner the highest share of 71.7% in the seismic survey market by the end of 2035. The segment’s upliftment is highly driven by the aspect of seismic surveys being indispensable in exploration, appraisal, and production phases, providing high-resolution subsurface imaging that reduces drilling risk and optimizes reservoir management. Offshore deepwater and ultra-deepwater projects in regions such as the Gulf of Mexico, Brazil, West Africa, and Asia-Pacific drive demand for advanced 3D and 4D seismic technologies, enabling operators to visualize complex geological structures and monitor reservoir changes over time. In mature basins, seismic surveys support brownfield redevelopment, helping companies identify bypassed reserves and extend field life.
Technology Segment Analysis
By the end of the forecast period, the 3D imaging sub-segment, which is part of the technology segment, in the seismic survey market, is projected to cater to the second-largest share. The sub-segment’s growth is highly fueled by the provision of a volumetric view of subsurface structures, enabling geoscientists to interpret complex geological formations with greater accuracy. This technology is particularly valuable in deepwater and ultra-deepwater exploration, where reservoir characterization is challenging. By delivering high-resolution data, 3D imaging reduces exploration risk, improves well placement, and enhances recovery factors. The integration of wide-azimuth acquisition techniques and ocean-bottom nodes further strengthens imaging fidelity in areas with complex geology. Beyond oil and gas, 3D seismic is increasingly applied in carbon capture and storage (CCS) projects to monitor CO₂ plume migration and ensure caprock integrity.
Deployment Segment Analysis
Based on the deployment segment, the offshore sub-segment in the seismic survey market is expected to account for the third-largest share by the end of the stipulated timeline. The sub-segment’s development is highly propelled by its importance for locating energy resources, including oil and gas, and readily understanding marine geology by utilizing sound waves to map sub-surface layers. These are crucial for planning infrastructure and economic energy security for wind farms. Therefore, regarding this, according to the October 2025 Global Offshore Wind Alliance Organization, the combined 2030 national targets readily add up to 263 GW, excluding the People's Republic of China. Besides, in Asia, nations are increasingly developing their own pipeline, with India readily targeting 30 to 37 GW, as well as Japan significantly aiming for 41 GW overall, comprising 15 GW of floating offshore wind by the end of 2040, thus positively impacting the sub-segment’s growth.
Our in-depth analysis of the seismic survey market includes the following segments:
|
Segment |
Subsegments |
|
End use Industry |
|
|
Technology |
|
|
Deployment |
|
|
Survey Type |
|
|
Services |
|
|
Equipment |
|

Vishnu Nair
Head - Global Business DevelopmentCustomize this report to your requirements — connect with our consultant for personalized insights and options.
Seismic Survey Market - Regional Analysis
APAC Market Insights
The Asia Pacific in the seismic survey market is anticipated to garner the highest share of 32.6% by the end of 2035. The market’s upliftment in the region is effectively attributed to underground and geothermal infrastructure, an increase in scaling subsurface services for CCS, brownfield optimization, and deepwater exploration, particularly in South China Sea, Australia. According to an article published by NLM in April 2023, with an approximate 12-year overall volume transport of deepwater into the South China Sea (SCS), there has been a significant linear 9% upward trend. This has led to long-lasting modifications in satellite-based ocean bottom pressure within the region. Besides, the SCS is a marginal sea with an in-depth basin of more than 1 × 10⁶ km2, which is connected to the Pacific Ocean through Luzon Strait, an extremely deep passage with a still in-depth of an estimated 2,400 meters.
China in the seismic survey market is growing significantly, owing to the aspects of upscaling CCS monitoring for industrial clusters, redevelopment of mature basins, and sustained offshore exploration. As per an article published by the State Council in December 2022, the country’s offshore crude production has demonstrated an almost 7% year-on-year (YoY) growth as of 2022. This has resulted in an estimated 58.6 million metric tons, and also accounts for over 50% of the country’s overall crude increment. Besides, the offshore natural gas production has exceeded 21.6 billion cubic meters, denoting an 8.6% YoY rise, and making nearly 13% of the country’s gas increment. Moreover, China’s offshore oil production has increased by 60 million tons as of 2023, along with a rise in the offshore natural gas production, accounting for more than 23 billion cubic meters, thereby making it suitable for bolstering the market.
India in the seismic survey market is also growing due to the upstream intensification to diminish import reliance, onshore fields redevelopment, and the widened utilization of geophysics in infrastructure, geothermal, and CCS. As stated in an article published by the PIB Government in December 2025, ports are considered a significant constituent of the infrastructure industry, accounting for almost 95% of external trade by volume. Between 2024 and 2025, the country’s major ports readily handled 855 million tons of cargo, denoting a rise from 581 million tons in the past 10 years. Besides, the Maritime Amrit Kaal Vision 2047 is a long-term vision and a standard approach for green ports, providing an investment of almost ₹80 lakh crore. This has been embarked on for green shipping initiatives, shipbuilding, inland waterways, coastal shipping, and ports, thus denoting an optimistic outlook for the overall market’s expansion in the country.
Europe Market Insights
Europe in the seismic survey market is expected to emerge as the fastest-growing region during the forecast period. The market’s development in the region is highly propelled by infrastructure geophysics, growth in geothermal, subsurface appraisal for CCS, and the mature offshore redevelopment in the North Sea, comprising Norway and the UK. According to an article published by Wind Europe in January 2024, the region witnessed a record 4.2 GW of the newest offshore wind farms, denoting a 40% increase from 2022. Based on this, there has been the provision of €30 billion in investments, which is expected to cover 9 GW that is poised to be developed in the upcoming years. Additionally, in 2023, the region has been successful in developing 4.2 GW of offshore, which is 1.7 GW more than in 2022. Besides, the UK, France, and the Netherlands also installed the latest capacity, including the 1.5 GW Hollandse Kust Zuid project, thereby driving the market’s demand and development.
The UK in the seismic survey market is gaining increased traction due to the presence of large-scale CCS clusters that readily depend on seismic for baseline monitoring and characterization, along with basin redevelopment. As per an article published by the Renewable Institute Organization in 2025, Ofgem has ensured the approval of a generous investment by allocating an initial £8.9 billion. This has been significantly directed towards upscaling Britain’s high-voltage electricity network, as well as an additional £1.3 billion on standby. This particular draft settlement has formed the first stage of an approximately £80 billion programme, with the intention of enhancing grid capacity and successfully shielding households from the volatile global gas market. However, this investment almost quadrupled the present expenditure levels for supporting 80 transmission projects and activities globally, which is positively impacting the market’s exposure.
Norway in the seismic survey market is also developing, owing to an extension in the CCS deployment that has leveraged saline aquifers and depleted fields, frontier exploration, and offshore redevelopment. As stated in the September 2025 IRENA Organization data report, the electricity generation trend in the country majorly depends on renewable and wind, combinedly accounting for 1475 in 2022 and 155% in 2023. Besides, the capacity utilization of different sources in the country accounts for 41% fossil fuels, 46% hydro or marine, 9% solar, 31% wind, and 36% bioenergy. Moreover, as per an article published by Sustainable Energy Technologies and Assessments in December 2022, the thermal energy extraction depends upon utilizing ground source heat pump systems, which is approximately 3 TWh, and is expected to reach 8 TWh by the end of 2030. Additionally, the increased focus on energy supply through different sources is also responsible for uplifting the seismic survey market in the country.
Total Energy Supply of Sources in Norway (2022)
|
Components |
Non-Renewable |
Renewable |
|
Total Energy Supply |
500,329 TJ |
571,242 TJ |
|
Growth |
-18.4% |
8.5% |
|
Primary Energy Trade |
||
|
Imports |
483,564 TJ |
|
|
Exports |
8,428,360 TJ |
|
|
Net Trade |
7,944,796 TJ |
|
|
Supply Imports |
45% |
|
|
Production Exports |
93% |
|
|
Energy Self-Sufficiency |
846% |
|
Source: IRENA Organization
North America Market Insights
North America in the seismic survey market is projected to witness considerable growth by the end of the stipulated timeline. The market’s growth in the region is highly driven by the growing subsurface characterization for carbon capture and storage (CCS), shale development, and the continued offshore Gulf of Mexico activity. According to a data report published by the Congressional Budget Office in December 2023, the region comprises 15 CCS infrastructure, particularly operating in the U.S., and these have the capacity to capture almost 22 million metric tons of carbon dioxide annually. This also accounts for 0.4% of the U.S.’s overall yearly carbon dioxide emissions. Besides, in terms of federal financial support, regional lawmakers allocated USD 5.3 billion for conducting research and related programs for CCS, thereby making it suitable for boosting the seismic survey market’s growth.
The seismic survey market in the U.S. is gaining increased exposure due to an increase in the demand for CCS centers, geothermal reservoirs, and hydrogen storage facilities, the presence of several funding programs by the government, manufacturing initiatives, and industrial decarbonization. As per an article published by the IEA Organization in 2025, the country announced crucial opportunities for bolstering carbon capture, utilization and storage (CCUS) project development, which comprises USD 1.7 billion for carbon capture demonstration. This also caters to the USD 1.2 billion for direct air capture (DAC) facilities, operating under the Infrastructure Investment and Jobs Act. Moreover, the sources' identification of carbon emissions in the country is also a driving factor for fueling the market’s demand, along with its continuous growth.
Carbon Dioxide Emissions in the U.S. From Different Sources (2023)
|
Source Type |
Emission (Million Metric Tons) |
|
Electric Power |
1,541 (62.1%) |
|
Industrial Energy |
776 (31.2%) |
|
Ethanol Production |
45 (1.8%) |
|
Iron and Steel Making |
42 (1.7%) |
|
Cement Production |
41 (1.7%) |
|
Natural Gas Processing |
26 (1.1%) |
|
Ammonia Production |
12 (0.5%) |
Source: Congressional Budget Office
The seismic survey market in Canada is also growing, owing to exploration in the oil and gas sector, CCS, mining and infrastructure, along with sustainability and governmental programs. As stated in an article published by the Government of Canada in August 2025, the country’s clean energy gross domestic product (GDP) is expected to reach USD 107 billion, readily driven by USD 58 billion in yearly investments by the end of 2030, and ensuring the provision of over 600,000 employment opportunities. Besides, an additional clean electricity generating capacity, ranging between 140 GW and 190 GW, is predicted to be required by the end of 2050. Furthermore, Ontario’s Aboriginal Loan Guarantee Program has ensured a consortium of 24 Indigenous groups to gain an equity stake in the Wataynikaneyap Transmission Project, which is readily supported by the federal government in the form of a USD 1.6 billion investment, thus proliferating the seismic survey market’s growth.
Key Seismic Survey Market Players:
- Schlumberger Limited (U.S.)
- Company Overview
- Business Strategy
- Key Product Offerings
- Financial Performance
- Key Performance Indicators
- Risk Analysis
- Recent Development
- Regional Presence
- SWOT Analysis
- Halliburton Company (U.S.)
- Baker Hughes Company (U.S.)
- Fairfield Geotechnologies (U.S.)
- SAExploration Holdings, Inc. (U.S.)
- CGG S.A. (France)
- TGS-NOPEC Geophysical Company ASA (Norway)
- PGS ASA (Norway)
- Polarcus Limited (Norway)
- Fugro N.V. (Netherlands)
- BGP, Inc. (China)
- Sinopec Geophysical Corporation (China)
- JOGMEC – Japan Oil, Gas and Metals National Corporation (Japan)
- INPEX Corporation (Japan)
- Geoscience Australia (Australia)
- Korea Institute of Geoscience and Mineral Resources (South Korea)
- Oil and Natural Gas Corporation Limited (India)
- National Oil Company Malaysia (Malaysia)
- WesternGeco (U.S.)
- Spectrum ASA (United Kingdom)
- Schlumberger Limited is one of the largest global providers of seismic survey and geophysical services, with a strong presence in offshore and onshore exploration. The company leverages advanced 3D/4D imaging and integrated software platforms to enhance reservoir characterization and reduce exploration risk.
- Halliburton Company is one of the notable competitors in seismic services, focusing on integrating geophysical data with drilling and reservoir management solutions. Its seismic technologies are widely used in deepwater projects, supporting efficient exploration and production strategies.
- Baker Hughes Company provides specialized seismic-while-drilling services, such as its SeismicTrak technology, which provides real-time subsurface data during drilling operations. This capability reduces drilling risks, optimizes well placement, and enhances seismic model accuracy.
- Fairfield Geotechnologies has been recognized for its extensive multi-client seismic data libraries covering major U.S. basins and the Gulf of Mexico. The company delivers high-resolution imaging and mapping services, enabling operators to visualize fine-scale geology for exploration and development.
- SAExploration Holdings, Inc. specializes in seismic data acquisition, particularly in challenging environments such as frontier basins and remote terrains. Its acquisition of Norway’s April AS expanded its ocean-bottom seismic technology portfolio, strengthening its global reach and competitiveness.
Here is a list of key players operating in the global seismic survey market:
The international seismic survey market is highly competitive, dominated by multinational corporations from the U.S., Europe, and Asia-Pacific. Key players pursue strategic alliances, technology innovation, and digital transformation to strengthen their market positions. Companies are investing heavily in 3D or 4D imaging, AI-driven data processing, and environmentally sustainable survey technologies to meet regulatory demands and client expectations. Partnerships with governments and energy firms are common, enabling shared costs and risk mitigation in offshore projects. Besides, in July 2024, TGS successfully declared the latest seismic acquisition of the Searm offshore project in Indonesia for covering more than 1,800 kilometers of the newest 2D seismic data across the south portion of the basin. This is possible by readily utilizing a 12 km long offset streamer, thus suitable for the seismic survey market globally.
Corporate Landscape of the Seismic Survey Market:
Recent Developments
- In December 2025, Elixir Energy Limited has significantly entered into a deal with QGC Pty Limited to readily facilitate its ingress into ATP2077-Block A, along with acquiring 3D seismic data.
- In November 2024, ADNOC declared the award of a contract to BGP Inc., which is a subsidiary of China National Petroleum Company, amounting to USD 490 million for expanding the world’s largest combined 3D offshore and onshore seismic survey.
- In July 2024, STRYDE has effectively secured multiple seismic processing contracts for the industrial and energy sectors, accounting for an overall 11 new contracts, with the intention of delivering subsurface insights to organizations in oil, CCUS, geothermal, water, mining, and gas exploration sectors.
- Report ID: 3590
- Published Date: Dec 23, 2025
- Report Format: PDF, PPT
- Explore a preview of key market trends and insights
- Review sample data tables and segment breakdowns
- Experience the quality of our visual data representations
- Evaluate our report structure and research methodology
- Get a glimpse of competitive landscape analysis
- Understand how regional forecasts are presented
- Assess the depth of company profiling and benchmarking
- Preview how actionable insights can support your strategy
Explore real data and analysis
Frequently Asked Questions (FAQ)
Seismic Survey Market Report Scope
Free Sample includes current and historical market size, growth trends, regional charts & tables, company profiles, segment-wise forecasts, and more.
Connect with our Expert


Copyright @ 2026 Research Nester. All Rights Reserved.
