Returnable Packaging Market Outlook:
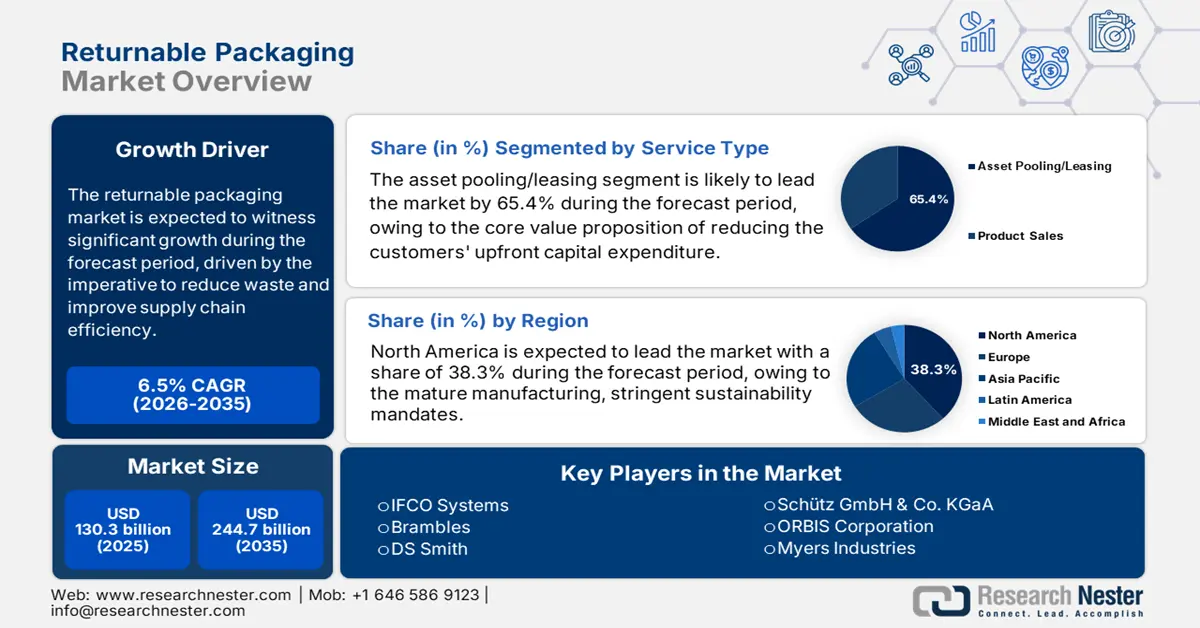
Returnable Packaging Market size was valued at USD 130.3 billion in 2025 and is projected to reach USD 244.7 billion by the end of 2035, rising at a CAGR of 6.5% during the forecast period, i.e., 2026-2035. In 2026, the industry size of returnable packaging is estimated at USD 138.8 billion.
The market is a vital component of modern industrial logistics, driven by the imperative to reduce waste and improve supply chain efficiency across the key manufacturing and retail sectors. The market encompasses durable containers, pallets, and transport systems designed for multiple cycles of use within the business-to-business operations. The growth is linked to the broader sustainability goals and the operational cost pressures. For instance, the U.S. EPA in December 2025 indicates that the containers and packaging constitute a significant portion of municipal solid waste, representing 4.3 million tonnes, underscoring the systemic waste reduction potential of reusable systems. The adoption of these systems is increasingly viewed as a core operational strategy to mitigate material costs, reduce disposable fees, and enhance logistical predictability within complex multi-tier supply chains.
The demand is concentrated in industries with high volume repetitive shipping patterns, such as the automotive manufacturing, food and beverage distribution, and retail grocery. The economic rationale is clear: transitioning from the single-use to multi-trip packaging reduces the per shipment costs over time despite higher initial capital outlay. Supportive regulatory frameworks and corporate sustainability commitments are stimulating this shift. This focus on reuse aligns with the broader waste management progress. The recycling rate in the U.S. was less than 7% in 1960 and has reached 32% based on the EPA's November 2025 report, demonstrating a systemic move toward more circular material management that returnable systems directly support. Furthermore, the focus for businesses is on total cost of ownership, asset tracking, and integrating returnable packaging into standardized logistics protocols to ensure consistent flow and availability.
Key Returnable Packaging Market Insights Summary:
Regional Highlights:
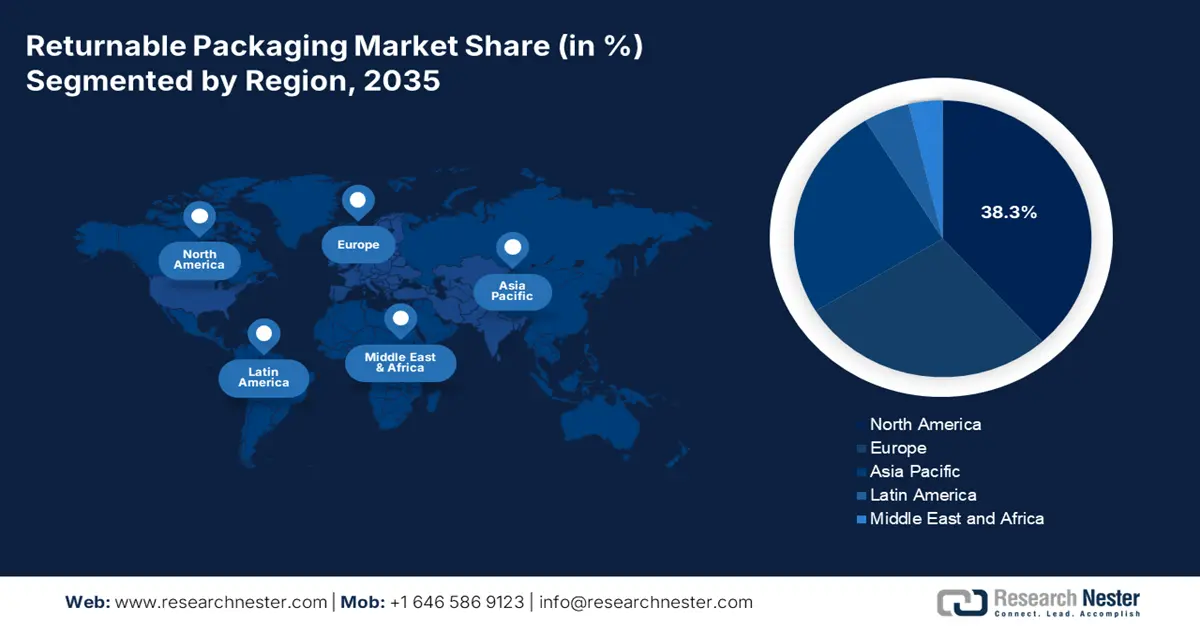
- North America in the returnable packaging market is anticipated to capture a 38.3% revenue share by 2035, supported by mature manufacturing bases and automation-intensive supply chains that encourage pooled packaging adoption amid rising sustainability and compliance pressures.
- Asia Pacific is forecast to expand at a CAGR of 8.2% during 2026–2035, reflecting accelerating industrialization and large-scale manufacturing ecosystems that intensify the use of standardized returnable container systems across automotive, electronics, and e-commerce value chains.
Segment Insights:
- Under the service type segment, asset pooling/leasing in the returnable packaging market is expected to secure a 65.4% share by 2035, as lifecycle-managed packaging models ease upfront investment and operational complexity in line with the rapid buildout of logistics and warehousing infrastructure.
- Within the material segment, plastic is projected to remain the dominant choice by 2035, bolstered by its lightweight durability and evolving polymer innovations that strengthen performance and hygiene across repeated circulation cycles.
Key Growth Trends:
- Government spending on waste reduction programs
- Rising raw material and waste management costs
Major Challenges:
- High initial capital investment
- Complex logistics and reverse logistics networks
Key Players: IFCO Systems (Germany), Brambles (Australia), DS Smith (UK), Schütz GmbH & Co. KGaA (Germany), ORBIS Corporation (U.S.), Myers Industries (U.S.), Nefab Group (Sweden), Rehrig Pacific Company (U.S.), Schoeller Allibert (Netherlands), Monoflo International (U.S.), Tosca (U.S.), Euro Pool Group (Netherlands), Loscam (Hong Kong, China), Toyota Industries Corporation (Japan), SSI Schaefer (Germany), Linpac (United Kingdom), Jinjoo Machinery (South Korea), Del-Tec Packaging (U.S.), Returnable Packaging Resource (India), Kadoya Engineering (Malaysia)
Global Returnable Packaging Market Forecast and Regional Outlook:
Market Size & Growth Projections:
- 2025 Market Size: USD 130.3 billion
- 2026 Market Size: USD 138.8 billion
- Projected Market Size: USD 244.7 billion by 2035
- Growth Forecasts: 6.5% CAGR (2026-2035)
Key Regional Dynamics:
- Largest Region: North America (38.3% Share by 2035)
- Fastest Growing Region: Asia Pacific
- Dominating Countries: China, United States, Japan, Germany, India
- Emerging Countries: India, Vietnam, Indonesia, Mexico, Brazil
Last updated on : 16 January, 2026
Returnable Packaging Market - Growth Drivers and Challenges
Growth Drivers
- Government spending on waste reduction programs: Public investment in waste prevention is directly influencing the market. In the U.S., the EPA in December 2025 indicated that the Infrastructure Investment and Jobs Act has provided USD 275 million for solid waste infrastructure to reduce packaging waste and improve material recovery systems. These funds prioritize reuse and lifecycle efficiency, shifting procurement criteria for public agencies and their suppliers. In Europe, the European Commission committed significant investment to circular economy and waste prevention projects, with transport packaging reuse identified as a priority area. For manufacturers and logistics provider this public spending creates demand signals that cascade into private contracts, mainly in food distribution, chemicals, and automotive parts, where suppliers are increasingly required to align with publicly funded waste-reduction targets.
U.S. Federal Government Spending on Waste Management
|
Year |
Allocation (USD million) |
Program Details |
|
2022 |
57.5 |
USD 55 m base + USD 2.5 m implementation |
|
2023 |
61.5 |
USD 55 m base +USD 6.5 m implementation |
|
2024 |
60.0 |
USD 55 m base + USD 5.0 m implementation |
|
2025 |
55.0 |
Base SWIFR (ongoing to 2026) |
Source: EPA December 2025
- Rising raw material and waste management costs: Volatility in virgin plastic resin prices and increasing landfill/incineration fees directly impact the packaging operating expenses. This directly fuels the demand for the market. The government environmental agencies track these costs. The Environmental Research & Education Foundation data in May 2024 depicts that the landfill tip fees have steadily increased, with the North East region being the highest among all other regions, accounting for USD 84.44. This economic pressure makes the long-term use phase of returnable packaging, where the cost is amortized over hundreds of trips, financially superior. It turns the waste disposal costs into a manageable, predictable asset management program, providing a clear hedge against material price inflation and regulatory fees. This financial dynamic solidifies the business case for converting from a variable expense model to a fixed cost capital asset strategy, fundamentally altering procurement decisions.
Regional Variations in Tipping Fees
|
Region |
Tipping Fee (USD) |
|
Northeast |
84.44 |
|
Pacific |
62.28 |
|
Midwest |
57.24 |
|
Mountains/Plains |
49.86 |
|
Southeast |
43.18 |
|
South Central |
42.25 |
Source: EREF May 2024
- Infrastructure spending on circular economy logistics: The large-scale public investment in logistics and recycling infrastructure is strengthening the business case for reusable transport packaging. The U.S. has allocated significant investment towards the waste management and recycling infrastructure, improving the reverse logistics capabilities critical for returnable packaging market systems. In parallel the Europe has also funded digital tracking, warehousing, modernization, and circular supply chain pilots. These investments reduce the operational friction traditionally associated with the reusable packaging, such as the asset loss, high return costs, and limited regional coverage. These publicly funded upgrades are also stimulating interoperability and standardization across the regional logistics networks, enabling returnable packaging providers to scale pooled asset models with lower risk and faster market penetration.
Challenges
- High initial capital investment: Establishing a pool of durable assets requires a significant upfront capital for tooling production and initial deployment, creating a major barrier to entry in the market. This contrasts sharply with the low initial cost of single-use alternatives. The major players, such as the Brambles uses their immense scale and established asset base as a defensive moat. For instance, the company has reported a significant capital expenditure for pallet and container procurement, highlighting the investment level required to compete at scale in this asset-intensive model.
- Complex logistics and reverse logistics networks: Efficiently retrieving cleaning and redistributing containers demands an advanced, often global logistics network. The new entrants must build this costly system from scratch. Companies such as IFCO Systems have invested decades in optimizing their network of service centers. The complexity is reflected in operational data; the Reverse Logistics Association reports that the returns and reverse logistics cost a certain percentage of sales in the company, highlighting the operational expertise and cost required to manage the return leg profitably.
Returnable Packaging Market Size and Forecast:
| Report Attribute | Details |
|---|---|
|
Base Year |
2025 |
|
Forecast Year |
2026-2035 |
|
CAGR |
6.5% |
|
Base Year Market Size (2025) |
USD 130.3 billion |
|
Forecast Year Market Size (2035) |
USD 244.7 billion |
|
Regional Scope |
|
Returnable Packaging Market Segmentation:
Service Type Segment Analysis
Under the service type segment, the asset pooling/leasing is dominating the segment and is expected to hold the share value of 65.4% by 2035. The segment is driven by its core value proposition of reducing the customers' upfront capital expenditure and logistical burden as the service provider manages the entire lifecycle of the packaging assets. A key statistical driver is the significant growth in the warehousing and logistics infrastructure needed to support e-commerce and manufacturing, directly increasing the demand for efficient third-party managed container systems. The report from the U.S. Bureau of Census in November 2025 indicates that the total construction spending in the U.S. in August reached USD 2,169.5 billion, which includes warehousing and storage construction. This data illustrates a rapid expansion of the logistics networks that utilize a pooled returnable packaging to optimize the material flow and reduce waste.
Material Segment Analysis
Plastic is leading the material segment in the returnable packaging market. The segment is driven due to its durability, lightweight nature, and design flexibility, which is vital for repeated use cycles. The segment’s dominance is reinforced by the continuous innovation in polymer engineering, enhancing properties such as impact resistance and hygiene. A pivotal statistic underscoring the material’s market position related to its production and recycling dynamics. The data from the U.S. Plastic Pact 2023 to 2024 report shows that the total plastic produced was 5.57 million metric tonnes in 2023, which includes the durable plastic products common in returnable packaging, such as polyethylene terephthalate bottles and jars, highlighting both the volume of material in circulation and the ongoing imperative to improve the circular systems for high-value polymers.
Ownership Segment Analysis
The open loop/pooling is propelling the ownership model in the market. As it manages the asset utilization across multiple users and industries, it drives efficiency and sustainability. The shift is driven by the need for supply chain resilience and cost optimization as companies seek to avoid the capital lock-in and management overhead of captive company-owned fleets. A critical supporting statistic comes from the macroeconomic indicator of industrial activity and trade, which directly influences the demand for the shared logistics assets. Further, the rising concern about emission reduction is stimulating the adoption of pooled systems, which demonstrably lower the carbon footprint per shipment by eliminating redundant packaging production and transport.
Our in-depth analysis of the market includes the following segments:
|
Segment |
Subsegments |
|
Product Type |
|
|
Material |
|
|
End use Industry |
|
|
Service Type |
|
|
Capacity |
|
|
Ownership |
|

Vishnu Nair
Head - Global Business DevelopmentCustomize this report to your requirements — connect with our consultant for personalized insights and options.
Returnable Packaging Market - Regional Analysis
North America Market Insights
The North America returnable packaging market is dominating and is expected to hold the revenue share of 38.3% by 2035. The market is driven by mature manufacturing, stringent sustainability mandates, and high labor costs that favor automation. The key trends include the integration of RFID/IoT for asset tracking, strong adoption in the automotive and food and beverage sector and growth in retail and e-commerce pooling. The U.S. leads, propelled by the reshoring initiatives and federal infrastructure spending. Canada’s growth is related to the export-oriented economy and progressive plastic waste policies. Both countries see a shift from the ownership to leasing models, with the major players investing in closed-loop systems to meet the corporate Scope 3 emission targets and comply with the EPR regulations.
The U.S. market is being shaped by a clear convergence of federal waste policy and large-scale brand commitments. The U.S. EPA data in February 2025 shows that the National Recycling Strategy, which supports the National Recycling Goal of raising the recycling rate to 50% by 2030, is stimulating public investment in collection sorting and reverse logistics infrastructure capabilities that are equally important for the scaling of reusable and returnable packaging systems. At the same time, the recent development by Coca-Cola in July 2023 indicates that the company has pledged to serve 25% of its global volume in reusable packaging by 2030 creates a material demand pull in the U.S., one of its largest bottling and distribution markets. Together, these are shifting the packaging decisions across the food, beverage, and retail supply chain from a disposable-led model to a reuse-enabled logistics framework where the returnable bottles, crates, and pallets become integral to meeting both the regulatory expectation and corporate sustainability targets.
The federal and provincial policies targeting plastic waste are the key growth drivers in the Canada returnable packaging market. The recent advancement in the market by the Friendlier in August 2025 depicts that the CAD 4.5 million funding round is allocated to scale reusable packaging systems, as it reflects the growing private investment aligned with the national waste reduction and circular economy priorities. The Government of Canada, in May 2025, indicates that Canada generates 4.4 million tonnes of plastic waste, with less than 8% effectively recycled. The federal initiatives, such as the Zero Plastic Waste Strategy and provincial extended producer responsibility programs, are stimulating the demand for the practical reuse model in various logistics-driven sectors. This demonstrates a critical shift from regulatory pressure to tangible market solutions.
APAC Market Insights
The Asia Pacific returnable packaging market is the fastest growing and is poised to grow at a CAGR of 8.2% during the forecast period 2026 to 2035. The market is driven by rapid industrialization, booming manufacturing output, and escalating government mandates for sustainable supply chains. China and India are the primary engines of growth, fueled by the massive domestic production, robust export logistics, and ambitious national policies to reduce plastic waste. The key drivers include robust environmental regulations, the region’s dominance in automotive and electronics manufacturing, requiring precise part handling, and the explosive growth of e-commerce fulfillment centers. A major trend is the adoption of standardized plastic pallet and container pooling systems, mainly in consumer goods and automotive supply chains, to reduce costs and waste.
China returnable packaging market is primarily driven by its position as the global manufacturing hub and stringent environmental regulations phasing out single-use plastics. The 2020 national policy to ban on non-degradable bags and disposable plastic tableware in major cities has created significant regulatory pressure for industries such as e-commerce and logistics to adopt reusable alternatives. A critical statistical driver is the immense volume of parcel logistics. The data from the People’s Republic of China in January 2023 indicates that the courier services handled by the companies reached 110.6 billion parcels in 2022, a baseline that underscores the colossal demand for efficient, sustainable packaging systems to manage waste and cost in the supply chain. This scale directly fuels the growth of standardized plastic container and pallet pooling systems, mainly for moving components within the automotive and consumer electronics sectors, where the supply chain efficiency is paramount.
The government implementation of the Plastic Waste Management Rules is driving the India market, which prohibits the identified single-use plastic items and mandates increased recycling targets, thereby incentivizing a shift to reusable systems. the fast moving consumer goods and automotive industries are the key adopters utilizing the reusable plastic crates and pallets to streamline high-volume distribution and reduce material costs. Supporting this trend, the data from the Digital Sansad in March 2025 indicates active enforcement reporting that, as part of the ban, nearly 8,61,335 inspections have been conducted, and among those, 1976 tonnes of banned single-use plastic items have been seized with a fine of Rs. 19.8 crores. This price-sensitive market is stimulating the adoption of returnable packaging mainly in closed-loop supply chains for major brands and their suppliers.
Europe Market Insights
The Europe returnable packaging market is a mature and growing sector and is driven by the robust environmental regulations and advanced supply chain demands. The implementation of the EU’s Circular Economy Action Plan and the Packaging and Packaging Waste regulation sets legally binding targets for reuse and recycling making returnable systems a strategic necessity for compliance. The key trends include the rapid adoption of smart IoT-enabled containers for real-time tracking in complex automotive and pharmaceutical logistics, and the expansion of pooling services that reduce the per-use costs. The growth is concentrated in Western Europe, with the automotive, food and beverage, and retail sectors being the largest end users as they seek to reduce waste, lower total operating costs, and meet the corporate sustainability goals.
Germany returnable packaging market is being strengthened by the convergence of large-scale operational deployment and targeted investment in reuse innovation. The recent advancements, such as the IFCO in February 2023, delivered over 2 billion reusable packaging shipments in 2022, and Amcor’s investment in a smart reusable food packaging start up circolution. The IFCO’s scale demonstrates how returnable transport packaging has moved beyond the pilot programs to become a core logistics infrastructure for fresh food supply chains across Germany and neighboring EU markets, supporting national waste prevention objectives and the Packaging Act, which prioritizes reuse and high-value material recovery. At the same time, the Amcor report in February 2023 signals a growing interest in digitally enabled reuse systems, including the tracking, condition monitoring, and return optimization that address the long-standing barriers, such as asset loss and hygiene assurance. These combined forces are accelerating the mainstream adoption of reusable systems.
The UK returnable packaging market is gaining structural momentum as logistics networks begin to integrate reuse directly into the high-volume e-commerce operations, illustrated by Evri’s expanded partnership with Vinted in July 2025 and the planned trial of reusable packaging across selected ParcelShop locations. With Evri targeting over 1 billion parcel deliveries annually and Vinted reaching 30 million UK consumers buying pre-loved goods online, the scale of this ecosystem creates a practical launchpad for returnable mailers and reusable transit packaging. For packaging suppliers and pooling providers, this signals a shift in the UK market from brand-led pilots to carrier-enabled deployment, where reuse is embedded in delivery infrastructure rather than treated as a niche sustainability add-on.
Key Returnable Packaging Market Players:
- IFCO Systems (Germany)
- Brambles (Australia)
- DS Smith (UK)
- Schütz GmbH & Co. KGaA (Germany)
- ORBIS Corporation (U.S.)
- Myers Industries (U.S.)
- Nefab Group (Sweden)
- Rehrig Pacific Company (U.S.)
- Schoeller Allibert (Netherlands)
- Monoflo International (U.S.)
- Tosca (U.S.)
- Euro Pool Group (Netherlands)
- Loscam (Hong Kong, China)
- Toyota Industries Corporation (Japan)
- SSI Schaefer (Germany)
- Linpac (United Kingdom)
- Jinjoo Machinery (South Korea)
- Del-Tec Packaging (U.S.)
- Returnable Packaging Resource (India)
- Kadoya Engineering (Malaysia)
- Company Overview
- Business Strategy
- Key Product Offerings
- Financial Performance
- Key Performance Indicators
- Risk Analysis
- Recent Development
- Regional Presence
- SWOT Analysis
- IFCO Systems is a leader in the market, pioneering the circular sharing model for reusable plastic containers in the fresh produce supply chain. Their strategic advancement lies in embedding IoT sensors into their RPCs, transforming them into data-generating assets. This provides real time data on location temperature and handling, allowing retailers and growers to optimize logistics, reduce spoilage, and ensure food safety, thereby enhancing the supply chain visibility far beyond the simple container tracking. According to the 2024 sustainability report, the company has increased the average recycled content used in the production of new RPCs to 42%.
- Brambles, via its CHEP brand, dominates the global returnable packaging market with its vast pool of pallets and containers. Their key market advancement is the integration of their digital platform CHEP One with blockchain and IoT technology. This creates a secure, transparent ledger for each assets jounry. This provides partners with unparalleled data on shipment integrity, carbon saving, and asset utilization. The company has made a sales revenue of USD 1,262.2 million in 2024.
- DS Smith has significantly advanced in the returnable packaging market by leveraging data from their lightweight engineered cardboard and plastic returnable systems. They utilize this return loop data to feed their proprietary FibreCircle analytics, which optimizes container design for maximum product protection and minimal waste on each journey. This ensures their packaging is not only returnable but also intelligently evolved based on the real-world performance metrics redcing the damage rates.
- Schutz GmbH & Co. KGaA is a global specialist in IBCs within the returnable packaging market, which has advanced by integrating smart technology into its stainless steel and plastic containers. Their Smart IBC systems provide critical data on fill levels, temperature, and shock events for sensitive chemical and pharmaceutical liquids. This real-time monitoring ensures product integrity prevent loss ad enables predictive logistics, allowing for dynamic routing and just-in-time refilling based on actual consumption data.
- ORBIS Corporation is a key player in the returnable packaging market and has made strategic advancements by embedding RFID and other tracking technologies directly into its plastic pallets, totes, and bulk systems. The data harvested from these always-connected assets flows into their operational software, enabling automated shipping or receiving, precise inventory management, and loss prevention.
Here is a list of key players operating in the global market:
The global market is defined by intense competition, with the key players leveraging scale, material innovation, and strategic expansion to secure market share. The dominant players are heavily investing in R&D to develop lighter and more durable, IoT-enabled smart packaging solutions that enhance supply chain visibility and efficiency. Strategic initiatives increasingly focus on the circular economy model, forming long-term partnerships with automotive, food & beverage, and retail giants. Further, mergers, acquisitions, and geographic expansion into the high-growth regions such as the Asia Pacific are the vital strategies to consolidate presence and cater to localized demand for sustainable packaging systems. For example, in April 2025, IPL announced its merger with Schoeller Allibert to create a USD 1.4 billion revenue reusable plastic packaging company.
Corporate Landscape of the Returnable Packaging Market:
Recent Developments
- In July 2025, Bonson has announced the launch of a new returnable container system in two of its stores, supporting Foodstuffs’ wider HereforNZ commitments to reducing single-use packaging and sending less waste to landfill.
- In September 2024, ARRAY Technologies announced the launch of a groundbreaking reusable packaging solution designed to replace traditional cardboard boxes with durable, reusable plastic casing. This innovative packaging is set to significantly reduce waste and contribute to the sustainability goals of ARRAY’s customers.
- In February 2024, Tri-Wall Group, a global leader in packaging solutions, has announced the launch of Tri-Wall Circular, a strategic initiative aimed at revolutionizing the plastic returnable container market.
- Report ID: 8352
- Published Date: Jan 16, 2026
- Report Format: PDF, PPT
- Explore a preview of key market trends and insights
- Review sample data tables and segment breakdowns
- Experience the quality of our visual data representations
- Evaluate our report structure and research methodology
- Get a glimpse of competitive landscape analysis
- Understand how regional forecasts are presented
- Assess the depth of company profiling and benchmarking
- Preview how actionable insights can support your strategy
Explore real data and analysis
Frequently Asked Questions (FAQ)
Returnable Packaging Market Report Scope
Free Sample includes current and historical market size, growth trends, regional charts & tables, company profiles, segment-wise forecasts, and more.
Connect with our Expert


Copyright @ 2026 Research Nester. All Rights Reserved.
