Reinforcement Learning Market Outlook:
Reinforcement Learning Market size was over USD 122.55 billion in 2025 and is projected to reach USD 19.01 trillion by 2035, growing at around 65.6% CAGR during the forecast period i.e., between 2026-2035. In the year 2026, the industry size of reinforcement learning is assessed at USD 194.9 billion.
Emergence of retailers and e-commerce merchants is the primary driver for this market. The need for tailored communications and promotions in line with customer purchasing habits has become an absolute necessity. Personalization is the key to providing customers with relevant shopping experiences that enable them to retain their loyalty. By allowing e-Retailers to learn and analyze customer behavior and tailor products and services to the customer’s interests, reinforcement learning algorithms are proving their worth.
In the trading market reinforcement learning accounts for 77% of the reinforcement learning market share AI start-ups are accelerating, owing to its robust tools for the optimization of financial objectives of training systems and also for evaluating and generating trading strategies.
Key Reinforcement Learning Market Insights Summary:
Regional Highlights:
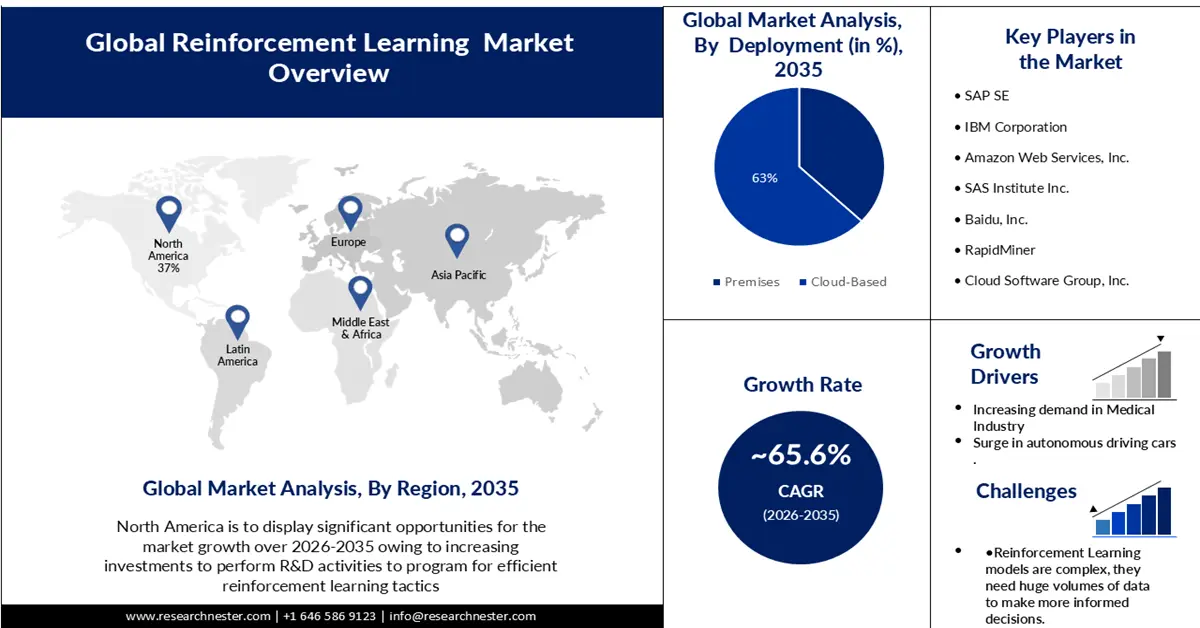
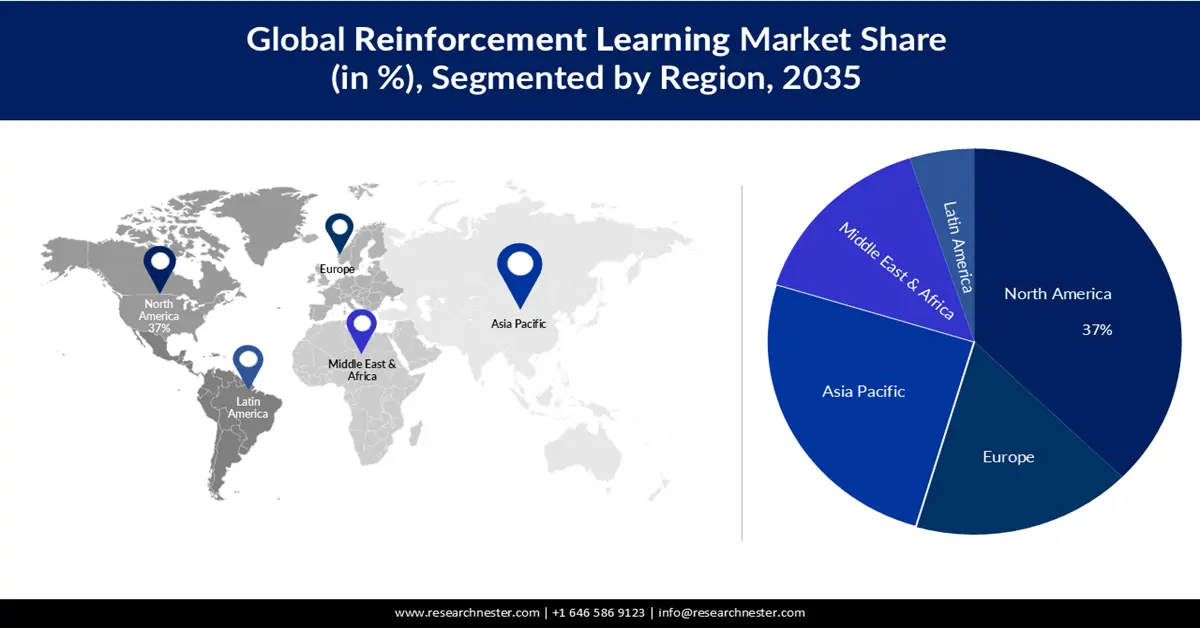
- North America is poised to hold a 37% share of the reinforcement learning market by 2035, attributed to rising R&D investments for efficient reinforcement learning tactics, the emergence of IT solutions, ethical AI practices, expanding IT service expenditure, and a well-established autonomous automotive sector.
- Europe is projected to experience robust growth through 2035, owing to the development of reinforcement learning algorithms that have reduced the threshold for AI and ML software adoption.
Segment Insights:
- The cloud-based segment in the reinforcement learning market is projected to command a 63% share by 2035, propelled by flexibility, automatic software updates, disaster management via cloud-based backup systems, and enhanced efficiency.
- The large enterprises segment is expected to secure the largest market share by 2035, supported by the growing adoption of data science and artificial intelligence technologies to gain a quantitative perspective on operations.
Key Growth Trends:
- Rising Demand in the Medical Industry
- Increase in autonomous driving vehicles
Major Challenges:
- Environment correlation
Key Players: Microsoft, SAP SE, IBM Corporation, Amazon Web Services, Inc., SAS Institute Inc., Baidu, Inc., RapidMiner, Cloud Software Group, Inc., Intel Corporation, NVIDIA Corporation, Hewlett Packard Enterprise Development LP.
Global Reinforcement Learning Market Forecast and Regional Outlook:
Market Size & Growth Projections:
- 2025 Market Size: USD 122.55 billion
- 2026 Market Size: USD 194.9 billion
- Projected Market Size: USD 19.01 trillion by 2035
- Growth Forecasts: 65.6%
Key Regional Dynamics:
- Largest Region: North America (37% Share by 2035)
- Fastest Growing Region: Europe
- Dominating Countries: United States, China, United Kingdom, Germany, Japan
- Emerging Countries: India, South Korea, France, Canada, Singapore
Last updated on : 19 November, 2025
Reinforcement Learning Market - Growth Drivers and Challenges
Growth Drivers
- Rising Demand in the Medical Industry -With the rise in numerous diseases, medical researchers are finding innovations, and dynamic treatment regime (DTR) is a popular method for acquiring efficient treatment for patients. The reinforcement learning approach addresses this DTR problem in which RI algorithms help to extract clinical data for the creation of treatment plans based on different clinical indicators obtained from patients as inputs. additionally, the adoption of AI-driven surgical robots, with a 95% success rate, is being exceedingly integrated in hospitals, acting as a major driver for the reinforcement learning industry.
- Increase in autonomous driving vehicles – With the increasing population the demand for personalized and Hi-tech cars is surging.To prevent collisions caused by human error and a lack of safety features, automakers are concentrating on developing driverless cars and displays that will enable the vehicles to automate independently, in respective with the surrounding environment This tends to affect the reinforcement learning reinforcement learning market positively.
- Maximizing Revenue of products for all Businesses- Dynamic pricing is a good strategy for determining prices according to supply and demand, to maximize revenue from products. To provide solutions to dynamic pricing issues, techniques such as Q-Learning can be used. Reinforcement learning algorithms act as price optimization tools for businesses in interactions with customers.
- Expanding B2C Market analytics -With the rise in delivery services, the manufacturer supplies products through split delivery vehicle routing. the main objective of the manufacturer is to minimize total fleet cost while meeting customer demands. To achieve the desired results, the agent approach based on reinforcement learning is good for this manufacturer. With the introduction of a multi-agents system, communication and cooperation with one another through reinforcement learning systems.
Challenges
- Environment correlation: Since the agent learns based on the current state of the environment, it becomes challenging for the agent to become trained in a constantly changing environment. This is because Reinforcement Learning Models learn based on the agent's interactions with the environment.
- Reinforcement Learning models are complex, they need huge volumes of data to make more informed decisions.
- Market developments are interrupted by technological limitations and a lack of accuracy.
Reinforcement Learning Market Size and Forecast:
| Report Attribute | Details |
|---|---|
|
Base Year |
2025 |
|
Forecast Year |
2026-2035 |
|
CAGR |
65.6% |
|
Base Year Market Size (2025) |
USD 122.55 billion |
|
Forecast Year Market Size (2035) |
USD 19.01 trillion |
|
Regional Scope |
|
Reinforcement Learning Market Segmentation:
Deployment Segment Analysis
The reinforcement learning market is classified as cloud-based and on-premises in terms of deployment. During the forecast period, a remarkable growth rate is projected for cloud services, and is accountable for 63 % of the global market. A few key advantages that have increased the use of cloud-based delivery models for deep learning software solutions and services are flexibility, automatic software updates, disaster management via cloud-based backup systems, and enhanced efficiency.
Enterprise size Segment Analysis
The reinforcement learning market is divided into large enterprises and SMEs, based on the type of enterprise. By the end of 2035, the biggest market shares are expected to be accounted for by large enterprises. The use of data science and artificial intelligence technologies has been growing among organizations as they seek to gain a quantitative perspective on their operations.
End-user Segment Analysis
During the forecast period, the reinforcement learning market will experience significant growth in the BFSI segment by end user. To understand their customers' needs and provide a tailored solution, BFSI companies are increasingly adopting machine learning solutions. BFSI companies are being encouraged to take advantage of machine learning technologies to achieve automated processing, data-driven customer insight, and personalized contact with customers.
Our in-depth analysis of the global reinforcement learning market includes the following segments
|
Deployment |
|
|
Enterprise size |
|
|
End-user |
|

Vishnu Nair
Head - Global Business DevelopmentCustomize this report to your requirements — connect with our consultant for personalized insights and options.
Reinforcement Learning Market - Regional Analysis
North American Market Insights
North America industry is poised to hold largest revenue share of 37% by 2035, owing to increasing investments to perform R&D activities to program for efficient reinforcement learning tactics. emergence of IT solutions and organizations prioritizing ethical AI practices are major boosters for the industry. Increased expenditure on IT services is also responsible for the market’s growth positively. Additionally, the regions having a well-established autonomous automotive sector have a major impact on the reinforcement market.
European Market Insights
Reinforcement Learning has high market demand in all sectors in Europe the threshold for using AI and ML software has been significantly reduced by the development of Reinforcement learning algorithms. AI and ML software are on a fast growth path in Europe. Czechia, France & and Germany have made a significant contribution to the adoption of generative AI. The Dutch Government is also very open to the use of AI and ML technologies. As per a survey conducted 13% of Dutch companies are using AI technologies. all these factors culminative contribute to the reinforcement learning market growth.
Reinforcement Learning Market Players:
- Microsoft
- Company Overview
- Business Strategy
- Key Product Offerings
- Financial Performance
- Key Performance Indicators
- Risk Analysis
- Recent Development
- Regional Presence
- SWOT Analysis
- SAP SE
- IBM Corporation
- Amazon Web Services, Inc.
- SAS Institute Inc.
- Baidu, Inc.
- RapidMiner
- Cloud Software Group, Inc.
- Intel Corporation
- NVIDIA Corporation
- Hewlett Packard Enterprise Development LP
Recent Developments
- Amazon web services, NC, and NVIDIA have announced a joint venture, focusing on building the world’s most in-demand & and scalable AI infrastructure, which would be used for training increasingly complex & and large language models and for other AI generative applications.
- For the purpose of enabling faster innovation and creating a more efficient and effective user experience for SAP applications, IBM Watson technology will be embedded in all SAP solutions to offer new Aid riven insights and automation.
- Report ID: 3223
- Published Date: Nov 19, 2025
- Report Format: PDF, PPT
- Explore a preview of key market trends and insights
- Review sample data tables and segment breakdowns
- Experience the quality of our visual data representations
- Evaluate our report structure and research methodology
- Get a glimpse of competitive landscape analysis
- Understand how regional forecasts are presented
- Assess the depth of company profiling and benchmarking
- Preview how actionable insights can support your strategy
Explore real data and analysis
Frequently Asked Questions (FAQ)
Reinforcement Learning Market Report Scope
Free Sample includes current and historical market size, growth trends, regional charts & tables, company profiles, segment-wise forecasts, and more.
Connect with our Expert


Copyright @ 2026 Research Nester. All Rights Reserved.
