- An Outline of the Molecular Dynamics Simulation Software Market
- Market Definition
- Market Segmentation
- Assumptions and Acronyms
- Research Methodology
- Research Process
- Primary Research
- Service Providers
- End Users
- Secondary Research
- Market Size Estimation
- Summary of the Report for Key Decision Markers
- Forces of the Market Constituents
- Factors/Drivers Impacting the Growth of the Market
- Market Trends for Better Business Practices
- Key Market Opportunities for Business Growth
- Major Roadblocks for the Market Growth
- Government Regulation
- Technology Transition and Adoption Analysis
- Industry Risk Analysis
- Global Economic Outlook: Challenges for Global Recovery and its Impact on Global Molecular Dynamics Simulation Software Market
- Ukraine-Russia Crisis
- Potential US Economic Slowdown
- Impact of COVID-19 on Global Molecular Dynamics Simulation Software Market
- Regional Analysis on Software Usage
- Industry Pricing Benchmarking & Analysis
- Industry Growth Outlook
- Industry Supply Chain Analysis
- Use Case Analysis
- Patent Analysis
- Analysis on Ongoing Technological Advancement in Molecular Dynamics Simulation Software Market
- End User Analysis
- Competitive Landscape
- Market Share Analysis, 2022
- Competitive Positioning
- Company Profile
- Schrödinger, Inc
- Siemens Digital Industries Software
- Dassault Systemes
- KTH Royal Institute of Technology
- Temple University
- University of Vienna
- Washington University in St.Louis
- Software for Chemistry & materials B.V.
- University of Illinois
- Agile Molecule
- Thermo Fisher Scientific Inc.
- D. E. Shaw Research
- Fujitsu Ltd.
- Other Players
- Global Molecular Dynamics Simulation Software Outlook & Projections, Opportunity Assessment, 2022 to 2033
- Market Overview
- Market Revenue by Value (USD Million) and Compound Annual Growth Rate (CAGR)
- Molecular Dynamics Simulation Software Segmentation Analysis 2023-2036
- By Type
- GPU-Accelerated, 2023-2036F (USD Million)
- Working Only On CPU, 2023-2036F (USD Million)
- By Application
- Chemical Research, 2023-2036F (USD Million)
- Medical Research, 2023-2036F (USD Million)
- Material Science Research, 2023-2036F (USD Million)
- Biophysics Research, 2023-2036F (USD Million)
- By End User
- Pharmaceutical Labs, 2023-2036F (USD Million)
- Research Institutes, 2023-2036F (USD Million)
- Academic Users, 2023-2036F (USD Million)
- Others, 2023-2036F (USD Million)
- By Geography
- Market Overview
- Market Revenue by Value (USD Million) and Compound Annual Growth Rate (CAGR)
- North America, 2023-2036F (USD Million)
- Europe, 2023-2036F (USD Million)
- Asia Pacific, 2023-2036F (USD Million)
- Latin America, 2023-2036F (USD Million)
- Middle East and Africa, 2023-2036F (USD Million)
- By Type
- North America Molecular Dynamics Simulation Software Outlook & Projections, Opportunity Assessment, 2022 to 2033
- Market Overview
- Market Revenue by Value (USD Million) and Compound Annual Growth Rate (CAGR)
- Molecular Dynamics Simulation Software Segmentation Analysis 2023-2036
- By Type
- GPU-Accelerated, 2023-2036F (USD Million)
- Working Only On CPU, 2023-2036F (USD Million)
- By Application
- Chemical Research, 2023-2036F (USD Million)
- Medical Research, 2023-2036F (USD Million)
- Material Science Research, 2023-2036F (USD Million)
- Biophysics Research, 2023-2036F (USD Million)
- By End User
- Pharmaceutical Labs, 2023-2036F (USD Million)
- Research Institutes, 2023-2036F (USD Million)
- Academic Users, 2023-2036F (USD Million)
- Others, 2023-2036F (USD Million)
- By Country
- US, 2023-2036F (USD Million)
- Canada, 2023-2036F (USD Million)
- By Type
- Europe Molecular Dynamics Simulation Software Outlook & Projections, Opportunity Assessment, 2022 to 2033
- Market Overview
- Market Revenue by Value (USD Million) and Compound Annual Growth Rate (CAGR)
- Molecular Dynamics Simulation Software Segmentation Analysis 2023-2036
- By Type
- By Application
- By End User
- By Country
- Germany, 2023-2036F (USD Million)
- France, 2023-2036F (USD Million)
- UK, 2023-2036F (USD Million)
- Italy, 2023-2036F (USD Million)
- Spain, 2023-2036F (USD Million)
- Netherlands, 2023-2036F (USD Million)
- Rest of Europe, 2023-2036F (USD Million)
- Asia Pacific Molecular Dynamics Simulation Software Outlook & Projections, Opportunity Assessment, 2022 to 2033
- Market Overview
- Market Revenue by Value (USD Million) and Compound Annual Growth Rate (CAGR)
- Molecular Dynamics Simulation Software Segmentation Analysis 2023-2036
- By Type
- By Application
- By End User
- Country
- China, 2023-2036F (USD Million)
- Japan, 2023-2036F (USD Million)
- India, 2023-2036F (USD Million)
- South Korea, 2023-2036F (USD Million)
- Australia, 2023-2036F (USD Million)
- Singapore, 2023-2036F (USD Million)
- Rest of Asia Pacific, 2023-2036F (USD Million)
- Latin America Molecular Dynamics Simulation Software Outlook & Projections, Opportunity Assessment, 2022 to 2033
- Market Overview
- Market Revenue by Value (USD Million) and Compound Annual Growth Rate (CAGR)
- Molecular Dynamics Simulation Software Segmentation Analysis 2023-2036
- By Type
- By Application
- By End User
- By Country
- Brazil, 2023-2036F (USD Million)
- Argentina, 2023-2036F (USD Million)
- Mexico, 2023-2036F (USD Million)
- Rest of Latin America, 2023-2036F (USD Million)
- Middle East and Africa Molecular Dynamics Simulation Software Outlook & Projections, Opportunity Assessment, 2022 to 2033
- Market Overview
- Market Revenue by Value (USD Million) and Compound Annual Growth Rate (CAGR)
- Molecular Dynamics Simulation Software Segmentation Analysis 2023-2036
- By Type
- By Application
- By End User
- By Country
- GCC, 2023-2036F (USD Million)
- Israel, 2023-2036F (USD Million)
- South Africa, 2023-2036F (USD Million)
- Rest of Middle East and Africa, 2023-2036F (USD Million)
Molecular Dynamics Simulation Software Market Outlook:
Molecular Dynamics Simulation Software Market size was over USD 550.08 million in 2025 and is anticipated to cross USD 1.39 billion by 2035, growing at more than 9.7% CAGR during the forecast period i.e., between 2026-2035. In the year 2026, the industry size of molecular dynamics simulation software is estimated at USD 598.1 million.
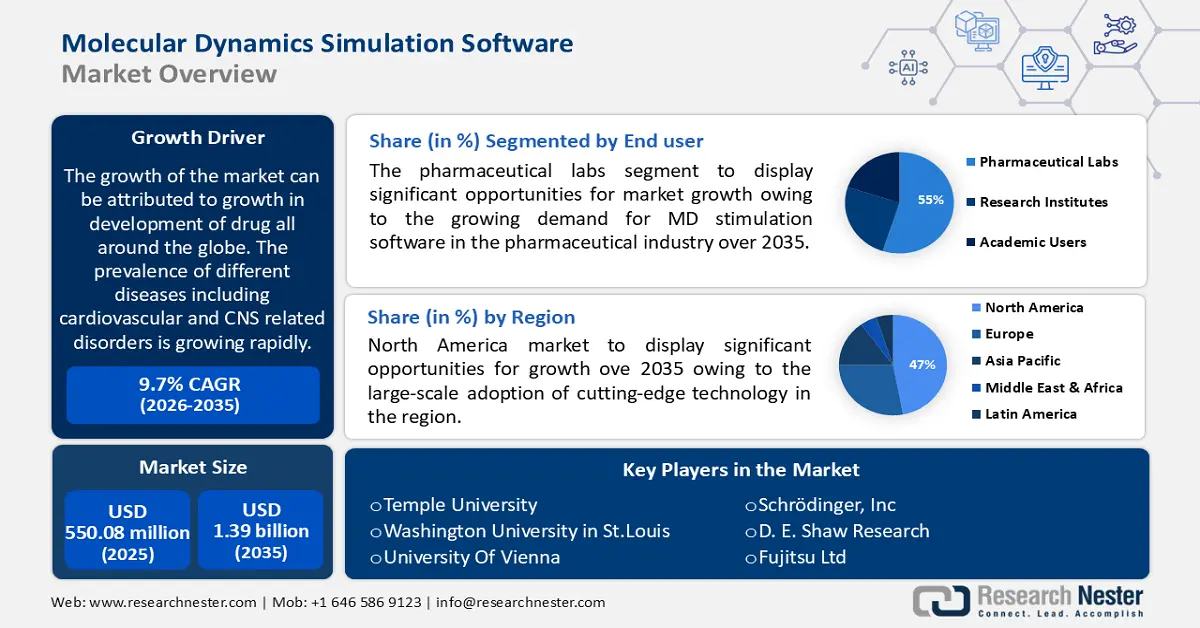
The growth of the market can be attributed to growth in development of drug all around the globe. The prevalence of different disease including cardiovascular and CNS-related disorders is growing rapidly. According to the World Health Organization, 17.9 million deaths worldwide in 2019 were attributable to CVDs, or 32% of all fatalities. Heart attack and stroke deaths accounted for 85% of these fatalities. Hence the need for development of best medications, and need to improve the effectiveness and transparency of drug development is driving the growth of drug development market. This growth is hence further anticipated to boost the market for molecular dynamics simulation software.
Additionally, growing government recognition of the importance of drug discovery and increased funding for global research initiatives, notably as a result of the COVID-19 pandemic, are predicted to be major factors in market growth. For instance, Drug Development Hackathon 2020 (DDH2020), a pioneering national initiative to support the drug discovery process, was introduced by the Indian government. The first of its kind in the country, this hackathon brought together experts, academics, researchers, and students from a wide range of disciplines, including computer science, chemistry, pharmacy, medical sciences, basic sciences, and biotechnology. Additionally, machine learning has fast become an essential tool for managing and understanding enormous amounts of data across many scientific disciplines. Moreover, ML models support precise forecasting of complex material qualities, pharmaceutical development & manufacture, biosimilars, and other factors. The modelling and optimization of materials for heat treatment, resistance, microstructure models, and more could benefit from using data from earlier experimental and theoretical investigations. Therefore, it is anticipated that the market would experience profitable prospects as a result of the expanding potential of machine learning models in molecular dynamics simulations.
Key Molecular Dynamics Simulation Software Market Insights Summary:
Regional Insights:
- By 2035, North America is projected to secure a 47% share of the molecular dynamics simulation software market, supported by extensive adoption of advanced technologies and rising private funding for molecular dynamics research.
Segment Insights:
- Over 2026–2035, the pharmaceutical labs segment is anticipated to register the largest CAGR of 10.65%, propelled by rising demand for molecular dynamics simulation software amid expanding drug discovery needs.
Key Growth Trends:
- Rise in Spending on Research & Development by Pharmaceutical Sector
- Growing Prevalence of CNS Related Disorders
Major Challenges:
- Data Size Challenges
- Information Wealth Challenges
Key Players: Schrödinger Inc., Siemens Digital Industries Software, Dassault Systèmes, KTH Royal Institute of Technology, Temple University, Washington University in St. Louis, University of Vienna, Software for Chemistry & Materials B.V., University of Illinois, Agile Molecule, Thermo Fisher Scientific Inc., D.E. Shaw Research, Fujitsu Ltd.
Global Molecular Dynamics Simulation Software Market Forecast and Regional Outlook:
Market Size & Growth Projections:
- 2025 Market Size: USD 550.08 million
- 2026 Market Size: USD 598.1 million
- Projected Market Size: USD 1.39 billion by 2035
- Growth Forecasts: 9.7%
Key Regional Dynamics:
- Largest Region: North America (47% Share by 2035)
- Fastest Growing Region: Europe
- Dominating Countries: United States, China, Germany, Japan, United Kingdom
- Emerging Countries: India, South Korea, Singapore, Brazil, Australia
Last updated on : 20 November, 2025
Molecular Dynamics Simulation Software Market - Growth Drivers and Challenges
Growth Drivers
- Rise in Spending on Research & Development by Pharmaceutical Sector - Around USD 230 billion worldwide were spent on research & development in the pharmaceutical sector in 2021. For contrast, R&D spending reached a total of about USD 130 billion in 2012. The expenses are further anticipated to be used for a wide range of activities, such as the development of incremental innovations such as product extensions, the discovery and testing of new medications, as well as clinical testing for marketing or safety monitoring. Hence this factor is estimated to boost the demand for boost the demand for molecular dynamics simulation software.
- Growing Prevalence of CNS-Related Disorders- The percentage of non-communicable neurological illnesses in India's total DALYs increased from 4% (95% UI 3–2–0) in 1990 to 8 % (6–6–102) in 2019, while the percentage of neurological disorders caused by injuries rose from 2% (0–2-0) to 0–6% (0–5-0).
- Surge in Adoption of Molecular Dynamics Simulation Software- Deep Potential Molecular Dynamics (DPMD), a brand-new machine learning-based technique, was disclosed by the researchers. It could replicate the motion of more than 100 million atoms per day for longer than one millisecond.
- Rise in Frequency of Clinical Trials - Over 430 thousand clinical studies were registered internationally as of November 24, 2022.
- Upsurge in Adoption of AI - With USD 86 million in Series A funding, METiS Therapeutics launched in December 2021 with the goal of using artificial intelligence (AI) and machine learning to reinvent drug discovery and delivery and create the best treatments possible for patients with life-threatening diseases.
Challenges
- Data Size Challenges - Computer simulations generate enormous amounts of information, which makes big data challenges obvious. The logistical difficulties involved with storing, managing, and disseminating terabyte-scale trajectory data persist despite the continuous improvement in storage resource performance and capacity. It has become standard to make original data available to the public when study findings are published, at least in the vast majority of biological science domains. For simulation research, though, this is usually not the case. Hence, this factor is estimated to hinder the growth of the market.
- Information Wealth Challenges
- Unavailability of Enough Number of Researches
Molecular Dynamics Simulation Software Market Size and Forecast:
| Report Attribute | Details |
|---|---|
|
Base Year |
2025 |
|
Forecast Year |
2026-2035 |
|
CAGR |
9.7% |
|
Base Year Market Size (2025) |
USD 550.08 million |
|
Forecast Year Market Size (2035) |
USD 1.39 billion |
|
Regional Scope |
|
Molecular Dynamics Simulation Software Market Segmentation:
The global molecular dynamics simulation software market is segmented and analyzed for demand and supply by end user into pharmaceutical labs, research institutes, academic users, and others. Out of which, the pharmaceutical labs segment is anticipated to grow at a largest CAGR of 10.65% over the forecast period, backed by growing demand for MD stimulation software in the pharmaceutical industry. Further, a sizable number of people have been diagnosed with chronic long-term diseases such as diabetes, Alzheimer's, and cancer all over the globe. For instance, according to the World Health Organization, a total of 422 million people worldwide have diabetes, the majority of whom reside in low- and middle-income nations. Diabetes is directly responsible for 1.5 million fatalities annually. As a result, there is now a greater need for drug research efforts. Further, this growth in drug research is higher in pharmaceutical labs since the investment made on R&D by pharmaceutical companies are higher.
The global molecular dynamics simulation software market is also segmented and analyzed for demand and supply by application into chemical research, medical research, material science research, and biophysics research. Amongst these segments, the medical research segment is anticipated to generate the largest revenue by the end of 2035. The growth of the segment can be attributed to rising use of MD simulation for medical research. In the field of biomedicine, molecular dynamics (MD) simulation has been extensively utilized to explore the conformational shift of proteins brought on by mutation or ligand binding/unbinding. Further, it offers several viewpoints that are challenging to discover in conventional biochemical or pathological research, such as specific impacts of mutations on the atomic level of protein structure and protein-protein/ligand interaction. Additionally, extensive molecular dynamics (MD) is becoming more and more accessible, and it is expected to have an effect on quick drug discovery initiatives. Hence owing to this the use of MD simulation in medical research is growing. However, material science research segment is anticipated to grow at a highest CAGR of 11.30% over the forecast period.
Our in-depth analysis of the global molecular dynamics simulation software market includes the following segments:
|
By Type |
|
|
By Application |
|
|
By End User |
|

Vishnu Nair
Head - Global Business DevelopmentCustomize this report to your requirements — connect with our consultant for personalized insights and options.
Molecular Dynamics Simulation Software Market - Regional Analysis
North America Market Insights
The North America industry is expected to account for largest revenue share of 47% by 2035. The growth of the market in this region can be attributed to a large-scale adoption of cutting-edge technology and an increase in private funding for molecular dynamics research. Additionally, there has been growing investment made on R&D by pharmaceutical sector in North America. In the last two decades, there has been a surge in both R&D spending and the release of new medications in this region. The pharmaceutical sector invested USD 83 billion in research and development in 2019. That sum is roughly ten times what the sector spent annually in the 1980s after accounting for inflation. Also, in comparison to the prior decade, the number of new pharmaceuticals licensed for sale increased by 60% between 2010 and 2019, reaching a peak of 59 new drugs approved in 2018. Hence, this factor is estimated to boost the growth of the market in this region. However, the market in Europe region is anticipated to grow at a highest CAGR of 10.54% over the forecast period.

Molecular Dynamics Simulation Software Market Players:
- Schrödinger, Inc.
- Siemens Digital Industries Software
- Dassault Systemes
- KTH Royal Institute of Technology
- Temple University
- Washington University in St.Louis
- University Of Vienna
- Software for Chemistry & Materials B.V.
- University of Illinois
- Agile Molecule
- Thermo Fisher Scientific Inc.
- D. E. Shaw Research
- Fujitsu Ltd
Recent Developments
-
Avery Design Systems, Inc., the top provider of simulation-independent verification IP, has signed a contract to be acquired by Siemens Digital Industries Software. Siemens' industry-leading suite of electronic design automation (EDA) integrated circuit (IC) verification services would now include Avery's technology as part of the Siemens Xcelerator portfolio.
-
Together with NuoDB, Dassault Systèmes announced that Dassault Systèmes, which already owned a 16% ownership position, is buying the remaining NuoDB equity. NuoDB, a cloud-native distributed SQL database with headquarters in Cambridge, Massachusetts, was founded in 2010 and offers on-demand scalability, continuous availability, and transactional consistency, and is designed for mission-critical applications.
- Report ID: 3795
- Published Date: Nov 20, 2025
- Report Format: PDF, PPT
- Explore a preview of key market trends and insights
- Review sample data tables and segment breakdowns
- Experience the quality of our visual data representations
- Evaluate our report structure and research methodology
- Get a glimpse of competitive landscape analysis
- Understand how regional forecasts are presented
- Assess the depth of company profiling and benchmarking
- Preview how actionable insights can support your strategy
Explore real data and analysis
Frequently Asked Questions (FAQ)
Molecular Dynamics Simulation Software Market Report Scope
Free Sample includes current and historical market size, growth trends, regional charts & tables, company profiles, segment-wise forecasts, and more.
Connect with our Expert


Copyright @ 2026 Research Nester. All Rights Reserved.
