Metal Casting Market Outlook:
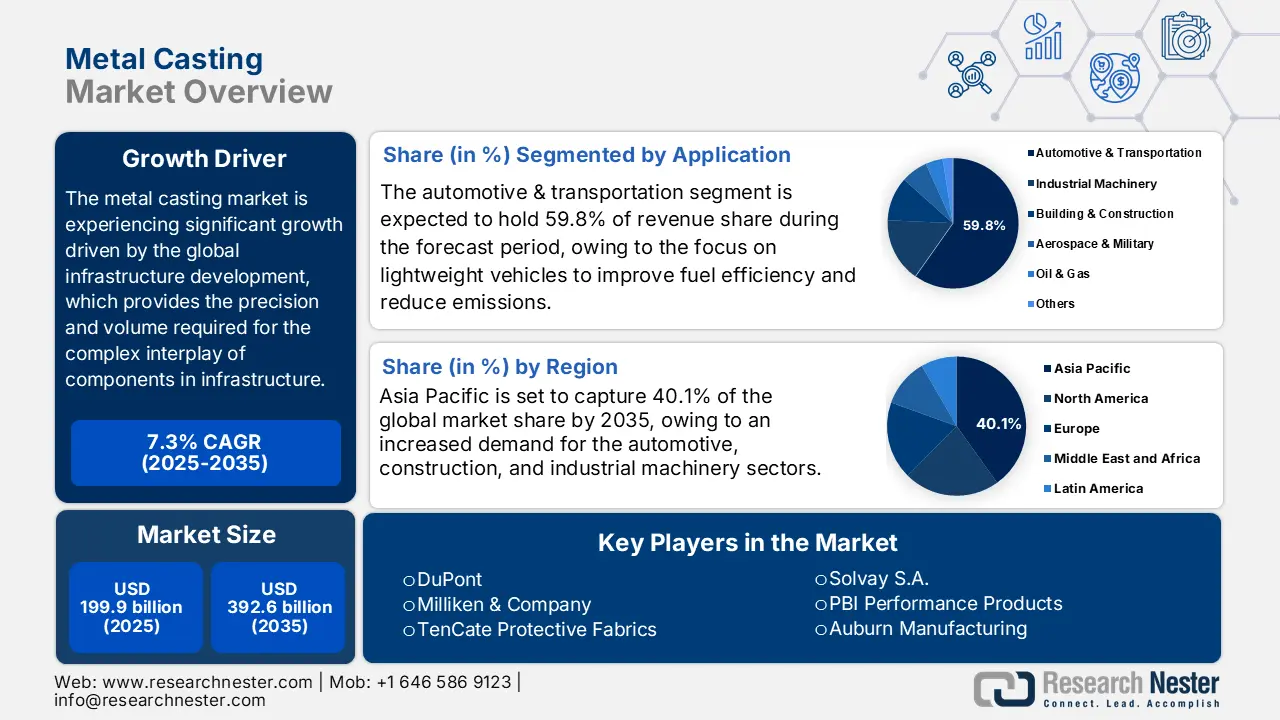
Metal Casting Market size was valued at USD 199.9 billion in 2025 and is projected to reach USD 392.6 billion by the end of 2035, rising at a CAGR of 7.3% during the forecast period from 2026 to 2035. In 2026, the industry size of metal casting is estimated at USD 214.4 billion.
The global metal casting market is anticipated to witness an upward trend over the forecast years, primarily driven by the strong demand of major industries like the automotive industry, aerospace, construction, and defense, well backed by the proactive government infrastructure and stimulus programs. The U.S. steel production used approximately 41.9 million metric tons of iron and steel scrap in 2023, almost equal to 41.5 million metric tons in 2022. In 2023, Pig iron was produced at an approximate of 12.6 Mt (million tons) as compared to 11.1 Mt in 2022- A 14 percent increase. In 2022 and 2023, it was approximately 80.5 Mt and 80 Mt in the domestic production of raw steel. Additionally, the U.S. Energy Information Administration indicated that in the first quarter of 2024, electric vehicles and hybrid vehicles constituted approximately 17.8% of all new light-duty cars in sales, with hybrid vehicles growing their sales 30.7% on a year-to-year basis. It is in this growth that the management is going to create the demand for high-precision aluminum castings, which can be utilized in battery and motor housings, and hence the growth of the metal casting industry. Furthermore, the National Defense Authorization Act (NDAA) in 2023 approved the total U.S military expenditure of about USD 816.7 billion for the Department of Defense on the military budget. This long-term defense budget forms the basis of the continuous need for specialty metal castings in the production of defense vehicles and military equipment that is vital in national security and military preparedness.
The strategic reshoring and government incentives like the Bipartisan Infrastructure Law facilitate supply chain expansion by increasing domestic capacity, reducing the length of supply chains, and making them more resilient. According to the findings of the U.S. Energy Department, the public and private investments support the re-opening and expansion of casting plants and the increase in production capacity through primary facilities. The international trade statistics indicate that the U.S exported casting machines worth USD 28,971.26 million in 2023, with Mexico, Turkey, and Canada being the majority of the export destinations. Meanwhile, the U.S. imported large amounts of cast iron and steel, particularly from China and the EU, and exported to Sweden, Germany, and the UK as per U.S. trade statistics. In August 2025, the Producer Price Index (PPI) of metals and metal products amounted to 334.270, which indicated a slight inflation of the prices of castings according to the U.S. Bureau of Labor Statistics. According to the EPA, the iron casting prices have been rising by 0.1 percent, and the steel castings by less than 0.05 percent per short ton, following recent measures. Overall, government and industry investments are harmonized to guarantee the responsiveness of supply chains, ongoing delivery of technologies, and long-term expansion of the market in the entire metal casting industry.
Key Metal Casting Market Insights Summary:
Regional Highlights:
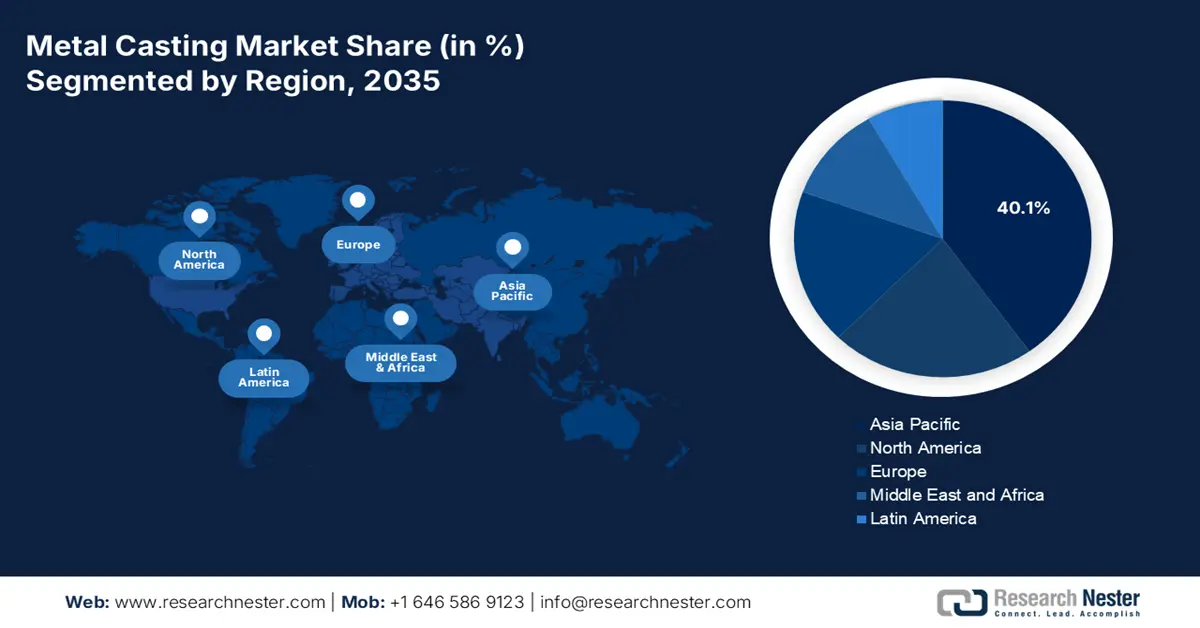
- The Asia Pacific region is forecasted to command a 40.1% revenue share in the metal casting market during 2026-2035, attributed to the adoption of simulation-based casting methods enhancing product quality and manufacturing productivity.
- By 2035, North America is expected to hold a 22.3% share of the market, spurred by growing demand across automotive, aerospace, and construction sectors supported by energy-efficient technologies and advanced manufacturing programs.
Segment Insights:
- The automotive and transportation segment of the metal casting market is projected to capture a 59.8% share by 2035, propelled by the increasing emphasis on lightweight vehicle production to enhance fuel efficiency and reduce emissions.
- The aluminum segment is estimated to hold a 49.6% revenue share by 2035, owing to its rising adoption in automotive manufacturing and recyclability aligned with global sustainability objectives.
Key Growth Trends:
- Government incentives and support programs
- Growth in green chemicals market
Major Challenges:
- Costs of Environmental Compliance and Regulatory Pressure
- Pricing Pressures because of the tariffs and market volatility
Key Players: DuPont, Milliken & Company, TenCate Protective Fabrics, Teijin Limited, Solvay S.A., PBI Performance Products, W. L. Gore & Associates, Koninklijke Ten Cate B.V., Auburn Manufacturing, Bulwark Protection, SRF Limited, Klopman International, Taiwan K.K. Corp., TOYOBO Co., Ltd., Kaneka Corporation.
Global Metal Casting Market Forecast and Regional Outlook:
Market Size & Growth Projections:
- 2025 Market Size: USD 199.9 billion
- 2026 Market Size: USD 214.4 billion
- Projected Market Size: USD 392.6 billion by 2035
- Growth Forecasts: 7.3% CAGR (2026-2035)
Key Regional Dynamics:
- Largest Region: Asia Pacific (40.1% Share by 2035)
- Fastest Growing Region: Asia Pacific
- Dominating Countries: China, India, United States, Germany, Japan
- Emerging Countries: South Korea, Mexico, Brazil, Indonesia, Thailand
Last updated on : 24 October, 2025
Metal Casting Sector: Growth Drivers and Challenges
Growth Drivers
- Government incentives and support programs: Governments around the world are enacting initiatives to incentivize organizations to pursue the use of green chemicals. For instance, the U.S. Renewable Chemicals Act of 2021 gives manufacturers producing biobased chemicals with at least 95% biobased content a federal tax credit of 15% per pound. The Department of Agriculture also has a program, the Biorefinery, Renewable Chemical, and Biobased Product Manufacturing Assistance Program, which provides loan guarantees to support the financing of the establishment of commercial manufacturing facilities producing renewable chemicals. The government initiatives and tools to support such renewable chemical production facilities are leading to investments in sustainable chemical production. For example, EPA and DOE have allocated USD 9.4 million to develop biofuels technologies in 2024, demonstrating the implication of the federal interest in sustainable industrial innovation.
- Growth in green chemicals market: The global green chemicals market is expected to grow exponentially as demand increases for environmentally friendly products, as well as government regulations that require low environmental impact products. The global green chemicals market was valued at approximately USD 146.88 billion in 2024 and is expected to reach approximately USD 387.98 billion by 2034, growing at a CAGR of 10.21% and expedited by the emergence of bioprocessing, fermentation, and more efficient enzymatic processes, which will reduce uncertainty in their efficiency, as well as their potential reduction in production cost. Additionally, the industrial sector, including chemical manufacturing, comprises approximately 20% of the overall U.S. greenhouse gas emissions. Energy-related CO2 emissions at the manufacturing level will be decreased by 58% by 2040 and by 87% by 2050 with the help of current and emerging technologies, which is a strong indication of the federal determination to speed up sustainable and green chemical manufacturing through the introduction and implementation of low-carbon solutions.
- Expansion in automotive and aerospace usage: Automotive and aerospace industries are also the major end users of casting chemicals. Automotive Lightweight alloys and enhanced composites are being adapted to enhance efficiency and minimize emissions, and, therefore, the need to utilize high-performance binders, resins, and coatings in foundries is becoming more common. According to the DOE metal-casting report, nearly a third of the total metal castings in the U.S. are intended to serve the car and truck market, highlighting the importance of automotive demand to casting applications. Specialty chemicals are also demanded in aerospace: coatings that resist heat, accurate molds, high-temperature turbine engine alloys, and alloys that withstand heat in the airframe.
Import/Export Trends
United States Casting Machines Used in Metallurgy or Metal Fo Exports by Country, 2023
|
U.S.
|
Partner |
Export Value (USD thousands) |
Quantity (Items) |
|
Mexico |
10,393.52 |
315 |
|
|
Turkey |
6,201.34 |
74 |
|
|
Canada |
2,785.66 |
111 |
|
|
China |
2,345.50 |
29 |
|
|
Italy |
1,459.04 |
52 |
|
|
Poland |
1,305.46 |
47 |
|
|
Germany |
1,272.42 |
46 |
|
|
Brazil |
592.76 |
18 |
|
|
North Macedonia |
504.56 |
10 |
|
|
Indonesia |
394.03 |
6 |
Source: WITS
United States Casting Machines Used in Metallurgy or Metal Fo Imports by country, 2023
|
U.S.
|
Partner |
Import Value (1,000 USD) |
Quantity (Items) |
|
Italy |
27,626.74 |
196 |
|
|
Czech Republic |
13,891.78 |
4 |
|
|
China |
13,385.18 |
458 |
|
|
Japan |
10,035.92 |
186 |
|
|
Norway |
6,303.91 |
20 |
|
|
Canada |
6,140.10 |
1,100 |
|
|
Finland |
4,227.60 |
71 |
|
|
Switzerland |
4,046.76 |
129 |
|
|
United Kingdom |
3,578.33 |
75 |
|
|
Germany |
3,013.32 |
50 |
Source: WITS
U.S. Automotive Metal Casting Market 2017–2025 (Thousand Metric Tons)
|
Application |
2017 |
2019 |
2022 |
2025 |
CAGR (2017–2025) |
|
Body Assemblies |
490.1 |
553.1 |
671.9 |
827.0 |
6.76% |
|
Engine Parts |
778.3 |
864.3 |
1,024.0 |
1,229.1 |
5.88% |
|
Transmission Parts |
365.5 |
405.9 |
480.8 |
577.3 |
5.88% |
|
Total |
1,633.9 |
1,823.3 |
2,176.6 |
2,633.3 |
6.15% |
Source: science.osti.gov
Challenges
- Costs of Environmental Compliance and Regulatory Pressure: The U.S. Environmental Protection Agency (EPA) has introduced strict regulations of air quality, which affect the metal casting industry. To achieve air pollution reduction and safeguard the health of the population, the EPA reduced the maximum ambient air quality standard of the fine particulate matter (PM2.5) to 9 micrograms per cubic meter in March 2024. This regulatory reform is extremely problematic for metal casting producers (particularly SMEs), which might not have the means to invest in advanced pollution control technologies. The higher compliance costs may exert pressure on their financial position and thus limit their competitiveness in the metal casting market. For example, research conducted by the American Foundry Society noted that adoption of strict environmental rules might cause more costs of operations in the foundries, and this may affect their competitiveness.
- Pricing Pressures because of the tariffs and market volatility: The metal casting industry is not an exception, as it is facing the pricing pressures that are the result of international trade policy and market fluctuations. For example, tariffs on steel imposed by the U.S. government have created higher prices on raw materials, hence influencing the pricing policy of metal caster producers. In addition, changes in the price of raw materials, including iron ore and scrap metal, are even more problematic in pricing models. In addition, a report by the Associated General Contractors of America shows that the producer price index of materials and services that are utilized in non-residential construction increased 2.6% in July 2024, and it is the biggest 12-month percentage increase since February 2023. The challenges associated with these prices require strategic plans and cost controls to ensure that profit is generated and remains competitive in the global metal casting market.
Metal Casting Market Size and Forecast:
| Report Attribute | Details |
|---|---|
|
Base Year |
2025 |
|
Forecast Year |
2026-2035 |
|
CAGR |
7.3% |
|
Base Year Market Size (2025) |
USD 199.9 billion |
|
Forecast Year Market Size (2035) |
USD 392.6 billion |
|
Regional Scope |
|
Metal Casting Market Segmentation:
Application Segment Analysis
The automotive and transportation segment is predicted to gain the largest metal casting market share of 59.8% during the projected period by 2035. As the automotive industry focuses more on lightweight vehicles to improve fuel efficiency and reduce emissions, the demand for metal casting has expanded significantly, driven by aluminum casting. The U.S Department of Energy estimates that a 10 percent decrease in the vehicle weight would lead to 6% to 8% fuel economy gains. Lightweight materials like aluminum, magnesium, carbon fiber composites, and high strength steel would help decrease the weight of the vehicle components and go a long way in improving the fuel economy, making it possible to have advanced emissions control systems without adding bulk to the overall weight of the vehicle, which gives credit to the value of materials that are lightweight to automotive design.
Engine and Powertrain Components and Chassis and Suspension Parts are the two main drivers of the growth of the Automotive and Transportation segment. The U.S. Department of Energy states that the weight of the vehicle can be decreased by up to 50% through the use of lightweight materials, including aluminum, magnesium, and high-strength steel in engine and powertrain parts, improving fuel economy and performance, and thus could save more than 5 billion gallons of fuel each year by 2030. Meanwhile, the use of lightweight alloys in chassis and suspension components enhances safety, durability, and emission norms of vehicles by lowering the weight but not the strength. These innovations can address regulatory mandates and the increased demand for fuel-efficient cars, and thus, they play a key role in growing the metal casting market of metal casting to be used in cars and automobiles.
Material Segment Analysis
The aluminum segment is anticipated to constitute the most significant growth, with the revenue share of 49.6% by 2035, due to its usage in the automotive industry and recyclability to fit in with the world's sustainable objectives. Aluminum’s favorable attributes include corrosion resistance and strength-to-weight ratio, making it a candidate for engine blocks, pistons, and other important components. The Aluminum Association has estimated that by 2030, the aluminum content in light trucks and automobiles in the U.S. will be estimated at 556 pounds per vehicle on average, in comparison with 120 pounds in 1980. This high-rise is an indication of increased use of aluminum in the manufacturing industries to make cars less weighty, achieving fuel efficiency, and with strict emission criteria. This projection serves as an indicator of aluminum’s emerging role in many vehicle applications.
Aluminum alloys have a better strength-to-weight ratio, resist corrosion, and thermal conductivity, and thus they are used in the automotive and aerospace sectors. Its demand is also increased by the continuous development of alloys and the improvement of casting technology. Meanwhile, pure aluminum is highly necessary due to its high level of electricity conduction and recyclability, and finds mostly application in electrical, building, and packaging sectors, which leads to growth in markets with growth in urbanization and industrialization. Additionally, the Aluminum Association promotes industry requirements that make it easy to innovate and be sustainable in the production and casting of aluminum.
Process Segment Analysis
The high-pressure die casting (HPDC) segment is projected to grow significantly during the forecast years from 2026 to 2035, owing to its extensive use in the manufacture of lightweight, high-precision parts, particularly in the automotive and aerospace industries. In the U.S. Department of Energy, the efficiency of HPDC is noted in the production of complex components that use fewer materials and have improved mechanical properties. This process helps in achieving sustainability missions, as lightweight materials are used, which saves fuel consumption and emissions in cars. HPDC is also capable of producing in a short-cycle production, contrasting the increasing industrial demand for affordable, volume production of durable metal components. These benefits have enabled HPDC to be a major growth factor in the metal casting business, as the company’s objectives are to balance performance, cost, and environmental impact.
Our in-depth analysis of the metal casting market includes the following segments:
| Segment | Subsegment |
|
Material |
|
|
Process |
|
|
Application |
|

Vishnu Nair
Head - Global Business DevelopmentCustomize this report to your requirements — connect with our consultant for personalized insights and options.
Metal Casting Market - Regional Analysis
Asia Pacific Market Insights
Asia Pacific is expected to lead the metal casting market with the largest revenue share of 40.1% during the projected years from 2026 to 2035, attributed to the use of simulation-based methods for casting, which increases product quality and manufacturing productivity. The Asian Productivity Organization notes that efficiency in the manufacturing industry in the Asia Pacific region has increased labor productivity by an average of 3.5% in 2018-23 because of the implementation of modern technologies such as casting simulation software. This is a technological tool that minimizes cast defects, optimizes the design of molds, and yields more, which is sustainable manufacturing. The United Nations Industrial Development Organization notes that the ongoing increase in productivity in the manufacturing industries, such as metal casting, is essential in fulfilling the increased demand in the region, as far as automotive, aerospace, and heavy industries are concerned. These are geared towards regional development objectives of enhancing the industrial competitiveness and sustainability that will establish the Asia Pacific as a significant player in the world growth of the metal casting market.
China’s market is predicted to have the largest revenue share between 2026 and 2035 in the APAC region. This is based on its large industrial base and its consistent approach to developing its infrastructure, as well as the demand created by growing automotive and machinery manufacturing. In addition, various government initiatives that promote modernization and environmental sustainability in foundries have further supported China's strong position. In addition, the policies of the government that encourage the modernization of foundries, the use of modern technologies in casting, as well as digitalization, contribute to a further increase in productivity and sustainability in casting activities. For example, the National Institute of Standards and Technology (NIST) report also indicates that China has already created at least 33 MICs by 2025, as a result of its Ministry of Industry and Information Technology (MIIT). The centers specialize in major advanced manufacturing technologies applicable in such fields as aerospace, electric vehicles, robotics, and semiconductors. The MICs promote industry-academia-government collaboration, digitalization, simulation technologies, and green practices of manufacturing. Additionally, 3D printing and simulation software saves the lead time and enhances efficiency, which has been the foundation of leading China in the metal casting industry worldwide. For instance, the researchers of the Huazhong University of Sciences and Technology in Hubei Province invented a new metal 3D printing method known as intelligent micro casting and forging. It is a combination of both processes (metal casting and forging) that has significantly enhanced the strength and reliability of metal molds as well as minimized cost and lead times by computer-controlled modelling.
The metal casting market in India is likely to grow with the fastest CAGR within the Asia Pacific region, owing to the rising investment in infrastructure, the rapid growth of the automotive sector, and sustained government support for the implementation of green technologies in their manufacturing operations. The Indian government has been funding research and development into advanced casting materials and processes through both the Ministry of Chemicals and Fertilizers and the Department of Science & Technology (DST). This is likely to accelerate India's emergence as a rapidly developing player in the metal casting market.
In addition, India's foundry industry, manufacturing in excess of 9 million metric tons per year, is the third largest casting producer in the world, and the MSME sector constitutes approximately 80% of the units. The Kolhapur foundry cluster in Maharashtra also supplies 600,000 tons, approximately 8% of the total castings in India, used by major automotive OEMs and other industries. National and international agencies are helping to boost productivity and sustainability in these energy-consuming foundries through energy efficiency and modernization. Such development and organized promotion show the growing significance of metal casting in the industrial and export environment of India.
North America Market Insights
By 2035, the North American metal casting market is expected to grow with a revenue share of 22.3%, attributed to the increasing demand in the automotive, aerospace, construction, and industrial machinery sectors, which drives this growth. The region comprised approximately 2,950 establishments, of which more than 80% are small businesses that directly employ 225,000 individuals and generate cast products worth well above 18 billion annually. With the help of the Metal Casting Industry of the Future program sponsored by the U.S. Department of Energy, technologies that are more energy efficient, advanced research, and increased productivity, lower scrap, and improved environmental results are making North America a leader in metal casting innovation and competitiveness across the globe. This is the continuous technological development and intensive industrial foundation that drives the continuous growth of the metal casting market of North America. North America's transportation sector is extremely important; for instance, in 2024, there were about 16,107,023 vehicles totaling 10,562,188 units in the U.S., 1,342,647 units in Canada, and 4,202,642 vehicles in Mexico. This substantial production of automotive parts is the foundation of the expansion of the metal casting market in North America because the pressure of cast metal usage in transportation and production is increasing, and new technology will be developed, and the market will be expanded throughout the region.
The U.S. market is expected to dominate the North American region over the projected years by 2035, mainly driven by the growth of the automotive and construction sectors. The Environmental Protection Agency went into the US commercial markets to leverage new sustainable chemical processes in 2023, and as a result, over 51 new sustainable chemical processes were established that lowered hazardous waste processes from 2021. In addition, the U.S. metal casting sector is a valuable industry worth over 50 billion dollars and directly employs more than 160,000 individuals and an extra 300,000 individuals throughout its supply chain, which makes it important in the manufacturing process. The U.S. has more than 1,900 foundries that are located in major states such as Ohio, California, and Michigan, and is ranked as the third largest foundry for casting production and second in productivity per plant. This strong industrial foundation and labor force is the foundation for the development of metal casting as a very important component of various industries like the auto industry, aviation industry, and infrastructure.
The market in Canada is anticipated to expand steadily, owing to the investments to promote clean energy and sustainable manufacturing from the government. In similar programs in the Canadian chemical industry (Responsible Care) that guide towards continuous, progressive improvement in health, safety, and environmental achievements, the plans showcase goals on how to continue guiding the metal casting sector in the slow evolution towards more sustainable and responsible behaviors. Additionally, METEALTec R&D group (NRC Canada) is the origin of the initiative, which contributes to the development of the Canadian metal casting industry through the establishment of technological advancement in the manufacturing process, new materials, and sustainability. With 23 active industrial members and yearly research and development funding approximated at 2.5 million dollars, METALTec is spearheading productivity, digitalization, and minimization of footprint on the environment throughout the metal fabrication sector, which fortifies the Canadian markets. Furthermore, according to the USITC report, it is a critical partner in supplying heavy iron construction castings to the U.S., given that the country records great export volumes throughout the period of review. The export orientation of the Canadian casting industry and compliance with the antidumping duty orders underscore the fact that it is a part and parcel of the North American metal casting supply chains, and this aspect is an indicator of strong market growth due to the increased demand in the infrastructure and utilities sectors.
Europe Market Insights
The European metal casting market is anticipated to witness an upward trend during the projected years from 2026 to 2035, owing to the rise of ferrous castings and other casting production in the region. The industry comprises approximately 6,000 foundries that discovered approximately 10.7 million tons of ferrous castings in 2021, which increased by 17.6% year-on-year. With a casting production value throughout the continent of 12%, the industry has about 260,000 employees and generates castings worth around 41 billion euros. The automotive, general engineering, and construction markets contribute to the growth of the market, and the prospects are changing towards the use of lightweight materials such as aluminum and magnesium castings.
Additionally, the UK steel industry generated 2.0 billion in the UK economy (0.1% of the UK economy and 1.2% of manufacturing output). It consisted of approximately 1100 businesses and subsidized 33400 jobs in 2019. The industry is important despite the global rivalry and domestic pricing, as the government is concerned with procurement policy, decarbonization, and energy price reimbursement to maintain growth and competitiveness in the metal casting and steel industry. The sector in Germany has an annual output of more than 638,000 tons of die castings made of aluminum, of which a major share are of the non-ferrous castings. It is the largest metal casting market in terms of revenues in Europe, which has the automotive and engineering industries.
Key Metal Casting Market Players:
- DuPont
- Company Overview
- Business Strategy
- Key Product Offerings
- Financial Performance
- Key Performance Indicators
- Risk Analysis
- Recent Development
- Regional Presence
- SWOT Analysis
- Milliken & Company
- TenCate Protective Fabrics
- Teijin Limited
- Solvay S.A.
- PBI Performance Products
- W. L. Gore & Associates
- Koninklijke Ten Cate B.V.
- Auburn Manufacturing
- Bulwark Protection
- SRF Limited
- Klopman International
- Taiwan K.K. Corp.
- TOYOBO Co., Ltd.
- Kaneka Corporation
The global metal casting market is very competitive, and key players are looking at different strategic actions to establish their market positions and footprint. Sustainable development has become a major trend; interestingly, companies have started to adopt environmentally friendly means of business. Partnerships, mergers, and acquisitions are increasing in many casting companies. Also, continued investment in R&D to develop high-performance materials and optimal casting processes is critical for achieving growth and competitive advantage in the long run.
Recent Developments
- In October 2024, Handtmann opened a megacasting plant at Biberach, Germany, the first in Europe to use large-scale die casting. By making large structural aluminum components (i.e., battery casing or even entire parts of a vehicle) in one cast, Mega casting can significantly lower the number of production processes and the cost involved. This is an invention that can help the automotive industry shift to the use of electric cars by enhancing the structural integrity and material efficiency. This investment will be a way of strengthening its efforts to transform the industry with high-efficiency and efficient metal casting solutions.
- In August 2024, UBE Machinery Corporation introduced a pioneering ultra-large die-casting machine that has a 9,000-metric-ton clamping force, which is capable of producing giga casting automotive body parts in Japan. This machine allows big, multi-shaped structural parts to be made through one casting operation, which increases the efficiency and designs of lightweight vehicles vital in the creation of electric vehicles. The innovation is a great breakthrough in the technology of die casting, which will be used to help the automotive sector move towards integrated and sustainable production processes, and the innovation is expected to enhance competitiveness in the market across the world.
- In March 2024, Boston Metal started up a Brazilian branch of the high-value metals production based on its Molten Oxide Electrolysis (MOE) technology. The facility will be a major leap towards sustainable metals production with the aim of mining waste to recover metals, in an effort to develop green steel production by 2026. The subsidiary, in Minas Gerais, Brazil, is an enabler of a circular economy, as it converts slag used in metal production into other sources of income. As the company intends to expand its staff by 80 to more than 250, this project will be consistent with the fact that the metal casting industry is moving towards technologies that will be environmentally friendly and less energy-intensive, which will make the production process more sustainable and reduce the environmental impact.
- Report ID: 5133
- Published Date: Oct 24, 2025
- Report Format: PDF, PPT
- Explore a preview of key market trends and insights
- Review sample data tables and segment breakdowns
- Experience the quality of our visual data representations
- Evaluate our report structure and research methodology
- Get a glimpse of competitive landscape analysis
- Understand how regional forecasts are presented
- Assess the depth of company profiling and benchmarking
- Preview how actionable insights can support your strategy
Explore real data and analysis
Frequently Asked Questions (FAQ)
Metal Casting Market Report Scope
Free Sample includes current and historical market size, growth trends, regional charts & tables, company profiles, segment-wise forecasts, and more.
Connect with our Expert


Copyright @ 2026 Research Nester. All Rights Reserved.
