Industrial Wastewater Treatment Market Outlook:
Industrial Wastewater Treatment Market size was valued at USD 27.7 billion in 2025 and is projected to reach USD 53.5 billion by 2035, growing at a CAGR of 6.8% during the forecast period, i.e., 2026-2035. In 2026, the industry size of industrial wastewater treatment is assessed at USD 29.5 billion.
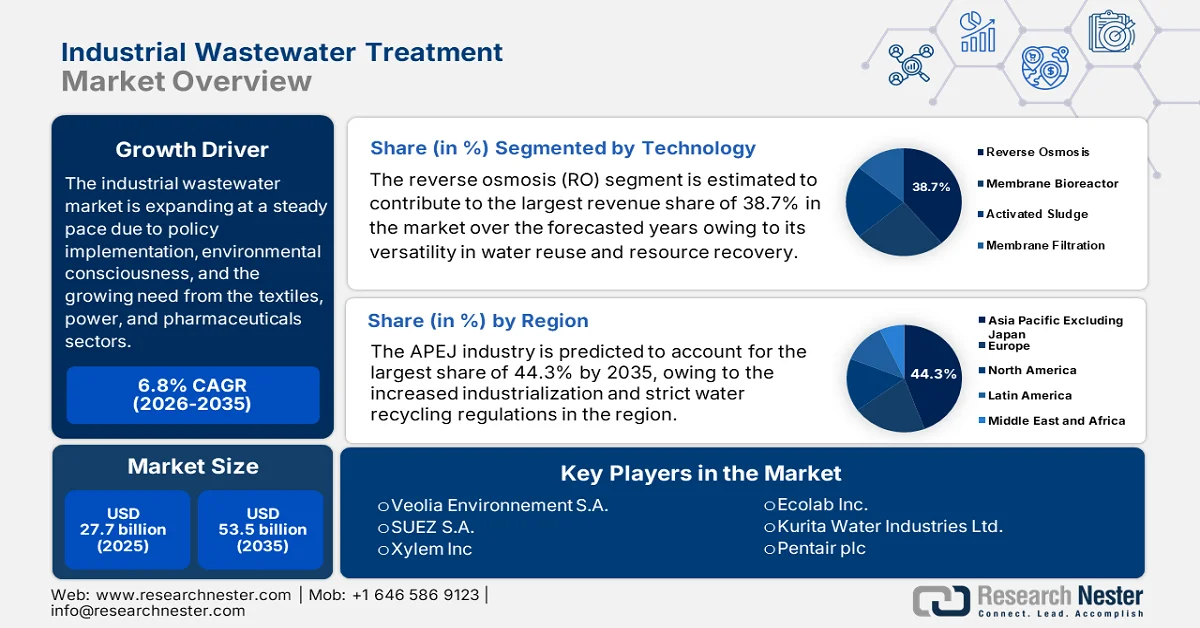
The market is expanding at a steady pace due to policy implementation, environmental consciousness, and the growing need from different sectors. The combination of membrane-based and zero liquid discharge systems is being widely adopted in industries such as textiles, power, and pharmaceuticals. As per the official statistics published by the United Nations in August 2024, there are only 22 countries, i.e., 8% of the global population providing data, of which 38% of industrial wastewater was treated and just 27% safely treated. Besides, the existing statistical figures indicate that industrial effluents are identified as a considerable contributor to water pollution. Therefore, these findings highlight the urgent need for expanded treatment, stricter monitoring, and increasing adoption of safe reuse practices to meet the 2030 SDG 6.3 targets.
The public and private sectors are now working towards common goals such as water recycling, zero discharge, and climate change adaptation. This is due to the increasing appreciation of the need for sustainable water management strategies that will allow for control of the adverse impacts of the current water management systems on the environment, while at the same time addressing the challenge of water scarcity. In September 2025, JDA reported that Jordan had opened its first-ever fully integrated zero-liquid-discharge industrial wastewater treatment unit at Al-Baha Soda and Chlorine Company, to enable the treatment and reuse of effluent from soda and chlorine production. It also mentioned that the facility reduces fresh water consumption by around 25% and cuts wastewater disposal costs by a remarkable 30%, treating around 150 m³ per day and generating yearly savings of nearly 130,000 Jordanian dinars (approximately USD 183,300), hence positively impacting the industrial wastewater treatment market’s expansion and exposure.
Key Industrial Wastewater Treatment Market Insights Summary:
Regional Highlights:
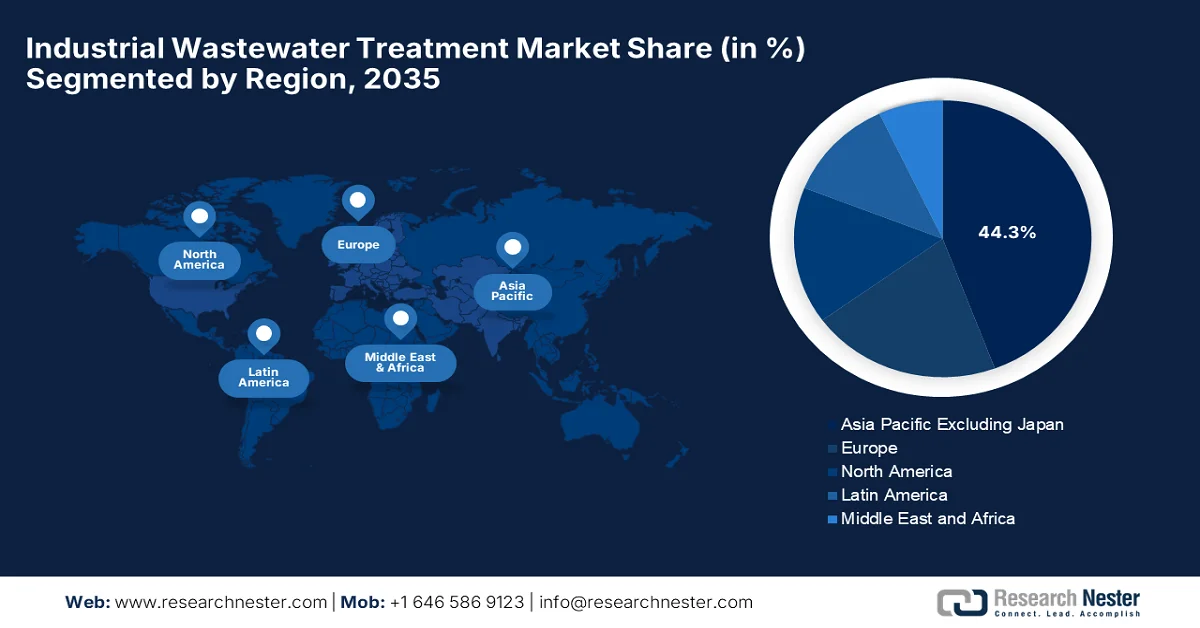
- Asia Pacific is projected to command a 44.3% share of the industrial wastewater treatment market by 2035 attributed to rapid industrialization and stringent water recycling regulations across water-stressed economies.
- North America is poised to witness notable expansion in the market through 2035 stimulated by tightening regulatory standards and rising corporate sustainability initiatives in wastewater management.
Segment Insights:
- The reverse osmosis (RO) segment in the industrial wastewater treatment market is projected to capture a 38.7% share by 2035 propelled by its expanding adoption for high-purity water reuse and resource recovery across F&B, pharmaceutical, and electronics industries.
- Chemical wastewater is expected to secure a significant portion of the market by 2035 fueled by growing effluent discharge from pharmaceutical, oil refining, and specialty chemical sectors requiring advanced treatment technologies.
Key Growth Trends:
- International pressures for higher standards and world water scarcity
- Surge in PPP-based wastewater infrastructure
Major Challenges:
- Non-compliance and legacy infrastructure risks
- Contaminant complexity and emerging pollutants
Key Players: Veolia Environnement S.A. (France), SUEZ S.A. (France), Xylem Inc. (U.S.), Ecolab Inc. (U.S.), Kurita Water Industries Ltd. (Japan), Pentair plc (Ireland), Aquatech International LLC (U.S.), Kemira Oyj (Finland), Thermax Limited (India), Lenntech B.V. (Netherlands), Nitto Denko Corporation (Japan), SWA Water Australia Pty Ltd. (Australia), WOG Group (India), Evoqua Water Technologies LLC (U.S.), DuPont de Nemours, Inc. (U.S.), Solenis (U.S.), BASF SE (Germany), Ebara Corporation (Japan), Calgon Carbon Corporation (U.S.), Clean TeQ Water Limited (Australia).
Global Industrial Wastewater Treatment Market Forecast and Regional Outlook:
Market Size & Growth Projections:
- 2025 Market Size: USD 27.7 billion
- 2026 Market Size: USD 29.5 billion
- Projected Market Size: USD 53.5 billion by 2035
- Growth Forecasts: 6.8% CAGR (2026-2035)
Key Regional Dynamics:
- Largest Region: Asia Pacific Excluding Japan (44.3% Share by 2035)
- Fastest Growing Region: North America
- Dominating Countries: United States, China, Germany, Japan, India
- Emerging Countries: Brazil, Vietnam, Indonesia, Mexico, Saudi Arabia
Last updated on : 9 March, 2026
Industrial Wastewater Treatment Market - Growth Drivers and Challenges
Growth Drivers
- International pressures for higher standards and world water scarcity: The interaction between water scarcity and policy is identified as the main influencing factor in changing industrial trends. According to the WMO report published in October 2024, more than 3.6 billion people suffered water scarcity for at least one month in 2024. As a result, ZLD systems are now being implemented in the textile clusters of India and the industrial regions of China. In February 2024, TERI collaborated with Ion Exchange India to formalize a TADOX Technology and trademark license agreement to commercialize TERI’s patented wastewater treatment technology for industrial applications. This partnership is a clear indication that there is a need for more innovative and sustainable solutions to the challenges posed by water scarcity and pollution, driving growth in the industrial wastewater treatment market.
- Surge in PPP-based wastewater infrastructure: The involvement of private factors in industrial water management is making it possible to achieve scale and innovation in the market. In October 2024, Stegra reported that it had collaborated with John Laing and Aquatech to design, build, finance, operate, and maintain a sustainable water treatment plant for the world’s first large-scale green steel facility in Boden. The plant is operated by Aquatech under a 25-year contract, and it will provide ultra-pure water, wastewater recycling, zero-liquid discharge, and water for cooling systems, returning 99.9% of process water back to the system. Such partnerships show the possibility of synergy between the public and private spheres to bring about positive environmental and economic impacts in the years ahead.
- Corporate sustainability and resource recovery goals: Today, companies are integrating their activities with water optimization plans that are benefiting the overall industrial wastewater treatment market growth. In July 2024, Kurita America Inc. announced that it had partnered with Solugen to develop carbon-negative industrial water treatment products, which also include the Tower NG series that efficiently replaces traditional phosphorus-based additives with bio-based, biodegradable alternatives. This collaboration mainly aims to reduce CO₂ emissions, minimize industrial waste, and improve water efficiency by also maintaining high performance in corrosion and deposit control. Therefore, such collaborations among leading pioneers will drive the adoption of sustainable water treatment solutions, enhance and support overall market growth.
Challenges
- Non-compliance and legacy infrastructure risks: Even though there are many improved technologies in wastewater treatment, most of the older industrial facilities still make use of substandard and non-conforming equipment. These legacy systems are incapable of handling complex industrial effluents and are not efficient in meeting the current higher standards of environmental compliance, negatively impacting the market. The Dow Freeport plant in Texas is cited as one of the most pollutive plants in the U.S. and serves as an example of the dangers of non-adherence to best practices and outdated infrastructure. In this context, HPM states that from 2022 to 2023, Dow discharged more than 800 grams of dioxins and millions of pounds of nitrogen and phosphorus. Therefore, renovating old wastewater treatment plants is a complex and expensive process, but it is highly necessary to maintain ecological balance and avoid any type of severe effects on people’s health.
- Contaminant complexity and emerging pollutants: New classes of industrial contaminants, including per- and polyfluoroalkyl substances (PFAS), pharmaceuticals, and microplastics, are some of the emerging contaminants that are not removed by conventional industrial wastewater treatment systems. The pollutants are difficult to deal with as they are persistently present in the environment, wherein some of them are toxic, and they are also resistant to conventional treatment processes. In addition, the presence of these pollutants in water can cause risks to both human and environmental health, which in turn necessitates the development of proper and advanced treatment technologies. Furthermore, there has been continuous research by players in the market to find effective ways to remove these contaminants and mitigate their harm.
Industrial Wastewater Treatment Market Size and Forecast:
| Report Attribute | Details |
|---|---|
|
Base Year |
2025 |
|
Forecast Year |
2026-2035 |
|
CAGR |
6.8% |
|
Base Year Market Size (2025) |
USD 27.7 billion |
|
Forecast Year Market Size (2035) |
USD 53.5 billion |
|
Regional Scope |
|
Industrial Wastewater Treatment Market Segmentation:
Technology Segment Analysis
The reverse osmosis (RO) segment is estimated to contribute to the largest revenue share of 38.7% through 2035, owing to its versatility in water reuse and resource recovery. Also, RO is gradually gaining popularity in terms of F&B, pharma, and electronics industries, where water quality and zero BPF discharge are paramount. Also, the integration with MBR and ultrafiltration units strengthens its position as a backbone for contemporary wastewater systems. In March 2024, Ecolab reported that it had inaugurated a fully automated wastewater treatment plant on Shell Jurong Island, Singapore, by using ultrafiltration and reverse osmosis membranes to treat and reuse up to 24,000 m³ of wastewater per month. It also stated that this facility supports Singapore’s Green Plan 2030 by promoting responsible water consumption and operational efficiency, hence denoting a wider segment scope in the industrial wastewater treatment market.
Wastewater Type Segment Analysis
Chemical wastewater is expected to contribute to a significant share of the market through 2035 due to the growth of the pharmaceuticals, oil refining, and specialty chemical industries. The composition of effluents, which could include organics, solvents, and heavy metals, requires sophisticated treatment. In November 2023, Kemira Oyj announced an expansion of its ferric sulfate water treatment chemicals production line in Goole, UK, by adding 70,000 tons of capacity to meet rising demand under the UK’s stricter Asset Management Plan 7 and 8 regulations on phosphorus and nutrient discharge. The new capacity builds on Kemira’s existing annual production of over 350,000 tons across its four UK sites by making sure of reliable supply for industrial and municipal wastewater treatment. Furthermore, chemical wastewater is the most prevalent, toxic, and widespread in its effects among all types of wastewaters, underscoring the huge need for efficient treatment procedures.
Treatment Method Segment Analysis
The advanced treatment segment is projected to garner a considerable share during the forecast period, registering a CAGR of 7.27%, making it the fastest-growing treatment method segment in the global industrial wastewater treatment market. The growth is also attributable to the rapid industrialization in the Asia Pacific, Latin America, and the Middle East, which is generating high-strength wastewater with toxic chemicals, heavy metals, and organic pollutants. In addition, industries such as chemicals, pharmaceuticals, and mining require advanced treatment solutions to meet stringent discharge regulations. Advanced treatment methods, including Advanced Oxidation Processes (AOPs), membrane filtration, and ion exchange, deliver superior contaminant removal efficiency, making them critical for treating complex industrial effluents. Therefore, the impact of all of these factors creates lucrative growth opportunities for the subtype in this field.
Our in-depth analysis of the market includes the following segments:
|
Segment |
Subsegments |
|
Technology |
|
|
Wastewater Type |
|
|
Treatment Method |
|
|
Process Type |
|
|
Application |
|
|
End user Industry |
|

Vishnu Nair
Head - Global Business DevelopmentCustomize this report to your requirements — connect with our consultant for personalized insights and options.
Industrial Wastewater Treatment Market - Regional Analysis
APAC Market Insights
Asia Pacific industrial wastewater treatment market is anticipated to dominate with a 44.3% share during the forecast period, owing to increased industrialization and strict water recycling regulations. The presence of water-scarce countries has led to the increased adoption of industrial water recycling systems. As of February 2025, as stated by the U.S. EPA, Singapore’s industrial water reuse framework allows treated municipal wastewater, branded as NEWater, to be supplied through a separate distribution system for non-potable industrial applications, which includes semiconductor, petrochemical, and industrial parks. It also stated that this NEWater currently meets up to 40% of Singapore’s water demand, and there are plans to expand capacity to cover 55% of future non-domestic needs by the end of 2060, thereby supporting water security and sustainable industrial growth. Further, with the increasing urbanization in the region, centralized effluent treatment plants are almost a standard feature in industrial estates.
NEWater Industrial Recycled Water Quality Standards - Advanced Treated Wastewater Specifications for Industrial Applications
|
Water Quality Parameter |
Specification |
|
E. coli |
<1 CFU/100 mL |
|
Color |
<5 Hazen |
|
Conductivity |
<250 µS/cm |
|
Chlorine |
<2 mg/L |
|
pH value |
7.0–8.5 |
|
Total Dissolved Solids |
<150 mg/L |
|
Turbidity |
<5 NTU |
|
Ammonia (as N) |
<1 mg/L |
|
Aluminum |
<0.1 mg/L |
|
Barium |
<0.1 mg/L |
|
Boron |
<0.5 mg/L |
|
Calcium |
<20 mg/L |
|
Chloride |
<20 mg/L |
|
Copper |
<0.05 mg/L |
|
Fluoride |
<0.5 mg/L |
|
Iron |
<0.04 mg/L |
|
Manganese |
<0.05 mg/L |
|
Nitrate (as N) |
<5 mg/L |
|
Sodium |
<20 mg/L |
|
Sulfate |
<5 mg/L |
|
Silica (as SiO₂) |
<3 mg/L |
|
Strontium |
<0.1 mg/L |
|
Total Trihalomethanes (TTHMs) |
<0.08 mg/L |
|
Total Organic Carbon |
<0.5 mg/L |
|
Total Hardness (as CaCO₃) |
<50 mg/L |
|
Zinc |
<0.1 mg/L |
Source: EPA
The government implementation of stricter water pollution controls and green industrial development is the main factor driving the industrial wastewater treatment market in China. The country is witnessing generous investments in both centralized and on-site treatment facilities, which are supported by government incentives, innovation in treatment technologies, and a push toward circular water management. In January 2026, Veolia China reported that it had commissioned the LiuGuo Wastewater Treatment Upgrade Project in Tongling, Anhui, by enhancing industrial wastewater management for the Henggang Chemical Park. The facility has a daily capacity of 14,400 tons, and it employs improved technologies to meet China’s Class 1A standards by reducing COD, suspended solids, nitrogen, and phosphorus emissions. Hence, such expansion projects, coupled with ongoing focus on energy recovery and smart regulation in China remains a model for industrial sustainability in this region.
The zero liquid discharge policies and the national-level water reuse initiatives are responsible for uplifting the industrial wastewater treatment market in India. Government incentives and tax exemptions are paving the way for solar power and decentralized treatment units. The country is gradually emerging as a targeted marketplace for affordable and scalable wastewater technology exports. In this context Ministry of Jal Shakti in July 2023 reported that the Government of India, under the Namami Gange program, has promoted the safe reuse of treated wastewater for industrial, agricultural, and horticultural purposes through the national framework for safe reuse of treated wastewater. Besides, the initiatives include supplying tertiary-treated water from plants such as the Mathura Tertiary Treatment Plant to industries such as IOCL, encouraging zero-liquid discharge in distilleries and pulp & paper units, and adopting salt-free tanning in tanneries to reduce water consumption, hence making it suitable for standard market growth.
State-wise Grossly Polluting Industries (GPIs) in Delhi and Nearby Areas: 2020-2021 Data
|
State |
No. of GPIs (2020) |
No. of GPIs (2021) |
|
Delhi |
267 |
210 |
|
Haryana |
832 |
924 |
|
Uttar Pradesh |
551 |
510 |
|
Uttarakhand |
10 |
11 |
|
Total |
1,660 |
1,655 |
Source: PIB
Compliance Status of Grossly Polluting Industries (GPIs) in Delhi & Surrounding Areas: Inspection Report 2020-2021
|
Compliance Status |
Number of GPIs |
|
Complying |
787 |
|
Self-closed |
441 |
|
Non-complying |
432 |
|
Show-cause notices issued |
406 |
|
Closure directions issued |
26 |
|
Subsequent show-cause notices revoked |
343 |
|
Subsequent closure directions issued |
50 |
|
Self-closed units verified |
321 |
Source: PIB
North America Market Insights
The North America industrial wastewater treatment market is expected to rise due to the increasing regulatory standards and corporate sustainability requirements in wastewater treatment. According to the article published by the U.S. DOE’s ARPAE in October 2025, it has launched the RECOVER program in 2025, by allocating an amount of nearly USD 25 million to develop technologies that extract critical minerals such as lithium and rare earths from wastewater, aiming to reduce reliance on foreign sources. Selected projects were advanced bio-inspired membranes and AI-augmented polymers to recover minerals from oilfield, municipal, and mining wastewaters. This trend is in support integrate with existing treatment facilities to bolster domestic supply chains for critical materials. Also in recent years, industrial operators have begun incorporating nutrient extraction modules as part of their treatment line.
The aggressive policy implementation and technology-driven upgrades position the U.S. industrial wastewater treatment market at the forefront of revenue contribution in the region. Tomorrow Water received a U.S. patent for its AMX two-stage Anammox nitrogen removal system in July 2024 by advancing energy-efficient wastewater treatment aligned with the United Nations Sustainable Development Goals. The company also stated that this patented technology enhances nitrogen removal by stabilizing partial nitritation, reducing energy, chemicals, and sludge production. Given climate change impacts, the provision and treatment of wastewater is one of the most critical infrastructure needs in the country. Managers are incorporating artificial intelligence to monitor discharges in real time to ensure compliance. Federal funding is also currently driving public-private partnerships for pollutant removal and water reuse in manufacturing clusters.
The improvements in terms of infrastructure and the regulations to meet international standards are enabling the gradual growth of the industrial wastewater treatment market in Canada. Simultaneously, the population expansion and rising concern over industrial effluent discharges are driving the use of membrane and chemical treatment systems. Provincial governments are also enforcing tougher standards for agriculture and food processing. Based on the government data, which was published in December 2023, federal and provincial governments in the country allocated a total of more than CAD 4.5 million with the main aim of upgrading drinking water and wastewater infrastructure in Greenwood and Keremeos, British Columbia. The projects include a new treatment facility, pump station, reservoir replacement, and sewer system repairs, with a main focus on improving water quality, efficiency, and environmental protection. Therefore, this makes it possible for firms to scale up by efficiently addressing emerging environmental requirements.
Europe Market Insights
The industrial wastewater treatment market in Europe is growing on account of cross-border initiatives to reduce industrial pollution and promote sustainable water management. Also, the aspect of collaborative efforts between countries is highly concentrated on harmonizing discharge standards, incentivizing eco-innovation, and integrating digital monitoring systems to track water quality in real time. In August 2024, as stated by the European Commission, it has revised the industrial emissions directive (IED 2.0) with a main goal to reduce pollution from large industrial installations and intensive livestock farms, promote decarbonisation, and encourage circular economy practices. In addition, it also stated that member states have 22 months to transpose the directive, by reporting to the industrial emissions portal starting in 2028, thereby readily enhancing transparency and public access to industrial emissions data.
The stronger significance of compliance with national legislation, especially in terms of heavy industries and chemical manufacturing are certain drivers responsible for uplifting the industrial wastewater treatment market in Germany. Companies are making investments in automated monitoring, decentralized treatment systems, and energy recovery from wastewater streams to reduce operational costs and environmental liabilities. In June 2025, a non-potable water plant was inaugurated at the Oldenburgisch-Ostfriesischer Wasserverband in Nordenham, wherein the construction was led by EnviroChemie GmbH, LUDWIG FREYTAG Group, and CDM Smith. Besides, this particular plant will use purified wastewater treated through Envopur ultrafiltration and reverse osmosis to produce up to 1.1 million cubic meters of non-potable water on a yearly basis, with KRONOS TITAN GmbH using at least 500,000 cubic meters for industrial processes, hence positively impacting market growth.
The industrial wastewater treatment market in France has gained enhanced traction, heavily influenced by the government’s push for climate resilience and green industrial policies. Industrial zones are integrating proper environmental planning, including stormwater management, sludge valorization, and byproduct recovery. For instance, in March 2024, Veolia notified that it has launched the GreenUp 2024 to 2027 strategic program to accelerate ecological transformation by focusing on decarbonization, depollution, and regeneration of resources. Besides, this program prioritizes three growth boosters: local energy and bioenergies, water technologies, and hazardous waste treatment, supported by a total amount of €4 billion (approximately USD 4.3 billion) in investments, which also includes €2 billion (approximately USD 2.15 billion) for innovation and industrial pilots. The presence of such magnifying programs will bolster the country’s market growth in the upcoming years.
Key Industrial Wastewater Treatment Market Players:
- Veolia Environnement S.A. (France)
- SUEZ S.A. (France)
- Xylem Inc. (U.S.)
- Ecolab Inc. (U.S.)
- Kurita Water Industries Ltd. (Japan)
- Pentair plc (Ireland)
- Aquatech International LLC (U.S.)
- Kemira Oyj (Finland)
- Thermax Limited (India)
- Lenntech B.V. (Netherlands)
- Nitto Denko Corporation (Japan)
- SWA Water Australia Pty Ltd. (Australia)
- WOG Group (India)
- Evoqua Water Technologies LLC (U.S.)
- DuPont de Nemours, Inc. (U.S.)
- Solenis (U.S.)
- BASF SE (Germany)
- Ebara Corporation (Japan)
- Calgon Carbon Corporation (U.S.)
- Clean TeQ Water Limited (Australia)
- Company Overview
- Business Strategy
- Key Product Offerings
- Financial Performance
- Key Performance Indicators
- Risk Analysis
- Recent Development
- Regional Presence
- SWOT Analysis
- Veolia Environnement S.A. is one of the leading global environmental services companies that provides industrial wastewater treatment solutions, which include design, engineering, operation, reuse, and resource recovery technologies across many industries. The company has a broader portfolio consisting of biological, physical, and chemical treatment processes.
- SUEZ S.A. is based in France and is leveraging deeper knowledge in industrial wastewater treatment technologies, which includes improved membrane systems, zero-liquid-discharge solutions, and full EPC (engineering, procurement, and construction) services. The company is mainly focused on custom industrial solutions for heavy industries, petrochemicals, mining, and electronics.
- Xylem Inc. is a U.S.-based water technology provider that is best known for improved pumping systems, analytics, and integrated wastewater treatment solutions that combine fluid handling with smart digital controls. In addition, Xylem’s offerings span from industrial filtration and separation systems to predictive analytics that improve performance and reduce operational costs.
- Ecolab Inc. is identified as a specialist in terms of water treatment chemicals and managed services for industrial effluent, mainly focusing on reducing environmental impact. The company has an integrated approach that efficiently blends chemical dosing, digital monitoring, and outcome-based service contracts.
- Kurita Water Industries Ltd. is yet another prominent player in this field that combines the knowledge of chemical treatment with mechanical and process engineering services. The firm serves industrial sectors such as semiconductors, petrochemicals, steel, and power generation with suitable wastewater solutions and efficiency-enhancing technologies.
Below is the list of some prominent players operating in the global market:
The companies involved in the market are mainly focused on innovation, ESG strategies, and geographic expansion. Some of the leading companies in this field are Aquatech, Ecolab, Kemira, Kurita Water Industries Ltd., Lenntech B.V., Nitto Denko Corporation, Pentair, SUEZ S.A., SWA Water Australia, Thermax Limited, Veolia, WOG Group, and Xylem. These pioneers are increasing offerings in RO, sludge management, ZLD, and carbon-negative treatment solutions. The market is being driven by strategic partnerships and technology licensing to expand into new markets. Mergers and acquisitions are also on the rise as the leading pioneers are looking to build integrated, end-to-end solutions for the water sector. In December 2024, Pentair plc announced that it had acquired G&F Manufacturing, LLC for an approximate value of USD 108 million in cash, which is subject to adjustments. G&F manufactures and services pool heat pumps under the Gulfstream brand, strengthening Pentair’s pool equipment portfolio in Florida and the Southeast U.S., hence making it suitable for standard market growth.
Corporate Landscape of the Industrial Wastewater Treatment Market:
Recent Developments
- In February 2026, DuPont announced that its FilmTec Fortilife XC160UHP reverse osmosis element was named a finalist in the 2026 Edison Awards in the Water, Food, and Agriculture category. It is designed for industrial wastewater treatment and reuse, and the membrane enables high water recovery by reducing energy use, carbon emissions, and operational costs.
- In February 2025, Omer Vander Ghinste Brewery teamed up with Veolia to expand its wastewater treatment facility near Kortrijk, Belgium. The collaboration is aimed at increasing on-site processing capacity and enhancing compliance with evolving environmental regulations. This move underscores the rising demand for tailored industrial solutions in the food and beverage sector.
- In January 2025, VA Tech Wabag (WABAG) was awarded a USD 14 million contract by BAPCO Refining B.S.C. to handle operation and maintenance services for an industrial wastewater treatment plant in Bahrain. The project highlights WABAG’s growing footprint in the Middle East and reinforces its capabilities in long-term plant performance management within the industrial wastewater segment.
- In January 2025, Axius Water completed the acquisition of Aero-Mod, a Kansas-based provider of mechanical and biological wastewater treatment systems. The deal extends Axius Water’s capabilities in nutrient removal technologies and supports its strategy to scale integrated solutions across industrial and municipal markets.
- Report ID: 3332
- Published Date: Mar 09, 2026
- Report Format: PDF, PPT
- Explore a preview of key market trends and insights
- Review sample data tables and segment breakdowns
- Experience the quality of our visual data representations
- Evaluate our report structure and research methodology
- Get a glimpse of competitive landscape analysis
- Understand how regional forecasts are presented
- Assess the depth of company profiling and benchmarking
- Preview how actionable insights can support your strategy
Explore real data and analysis
Frequently Asked Questions (FAQ)
Free Sample includes current and historical market size, growth trends, regional charts & tables, company profiles, segment-wise forecasts, and more.
Connect with our Expert


Copyright @ 2026 Research Nester. All Rights Reserved.
