Industrial Carbon Credit Market Outlook:
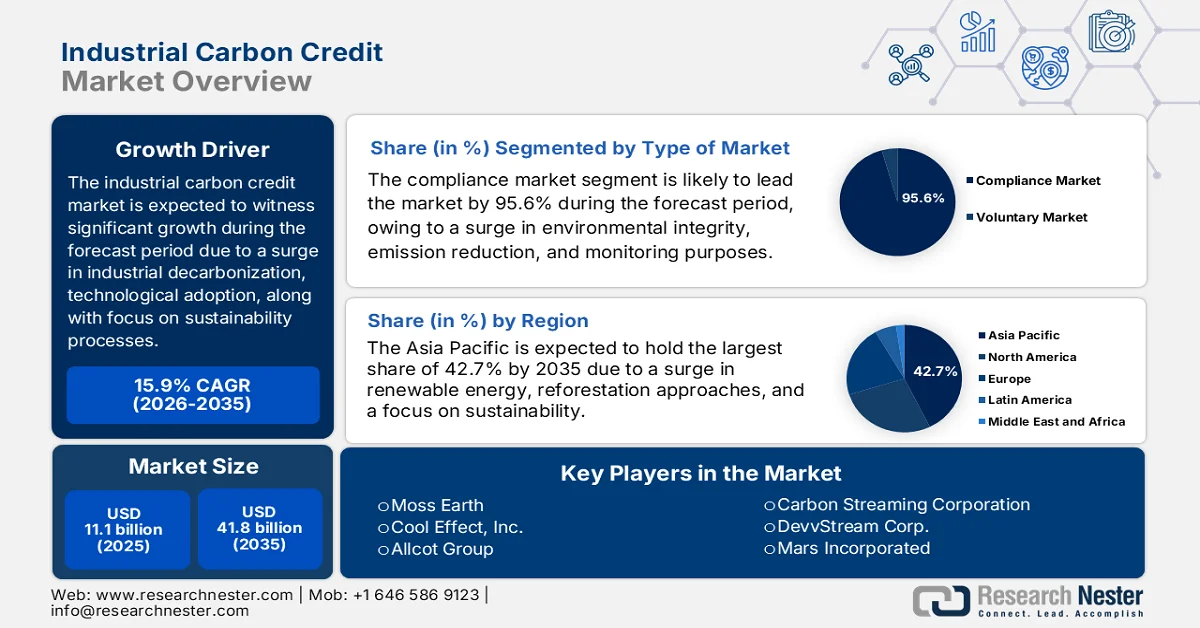
Industrial Carbon Credit Market size was valued at over USD 11.1 billion in 2025 and is further projected to reach USD 41.8 billion by the end of 2035, significantly mounting at a CAGR of 15.9% during the forecast period, i.e., 2026-2035. In 2026, the industry size of industrial carbon credit is estimated at USD 12.8 billion.
The worldwide industrial carbon credit market is effectively shaped by a confluence of macroeconomic, technological, and regulatory factors that readily expand beyond standard supply-demand dynamics. These factors include crude oil-producing regions, the acceleration of industrial decarbonization to reduce fossil fuel dependence, the adoption of blockchain technologies and artificial intelligence, and the rise of sustainability-based litigation. According to official statistics published by the OECD in 2026, manufacturing nations accounted for 40% of global carbon dioxide emissions, equivalent to nearly 16 gigatons annually. Besides, based on the September 2024 Department of Energy article, the U.S. Department of Energy (DOE) notified selections for USD 38.8 million in funding for 25 projects across 17 states for researching and developing high-impact building practices and technologies. These are effectively aimed at lowering peak demand on the electric grid, reducing energy expenses, and boosting resilience, thus fueling the industrial carbon credit market growth across different countries.
Country-Wise Carbon Export/Import Analysis, 2024
|
Countries/Components |
Export (USD) |
Import (USD) |
|
China |
1.2 billion |
554 million |
|
Russia |
678 million |
- |
|
India |
522 million |
- |
|
Thailand |
- |
525 million |
|
U.S. |
- |
433 million |
|
Global Trade Valuation |
6.8 billion |
|
|
Global Trade Share |
0.03% |
|
|
Product Complexity |
0.06 |
|
|
Export Growth |
0.7% |
|
Source: OEC
Furthermore, the bifurcation of the voluntary industry into low-cost and high-integrity segments, the proliferation of dedicated national carbon exchanges and digital registries, along with the expansion of compliance coverage to hard-to-abate industrial sectors, are a few trends that are responsible for driving the industrial carbon credit market globally. As stated in an article published by the CSIS Organization in May 2023, there has been growth in the need for carbon credits after the collapse of the Chicago Carbon Exchange (CCX), with its industrial value amounting to almost USD 2 billion, thus marking an outstanding growth from less than USD 200 million in the past 5 years. Besides, more than 100 million Australia-based carbon credit units (ACCUs) have been significantly issued, and the majority have been purchased by the domestic government, thereby bolstering the market exposure.
Key Industrial Carbon Credit Market Insights Summary:
Regional Highlights:
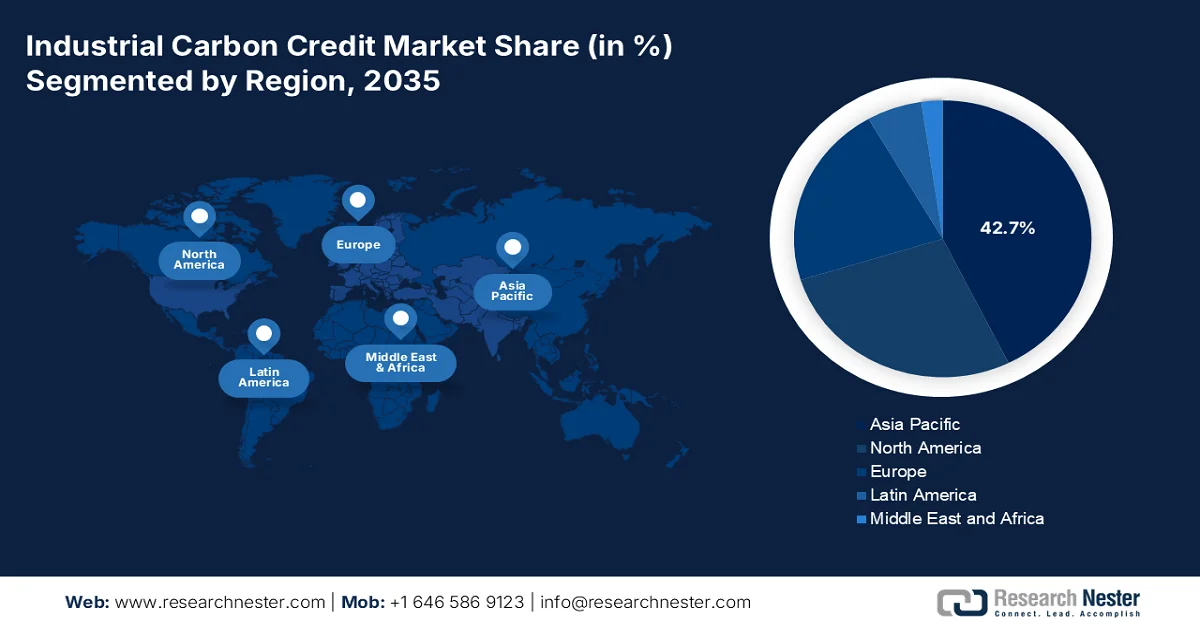
- Asia Pacific industrial carbon credit market is projected to command a 42.7% share by 2035, supported by expansion in national carbon markets, renewable energy adoption, and large-scale reforestation initiatives
- Europe is anticipated to witness the fastest growth in the market over 2026–2035, stimulated by stringent emission reduction mandates, rising voluntary carbon markets, and integration of digital MRV technologies
Segment Insights:
- The compliance market segment in the industrial carbon credit market is expected to account for a dominant 95.6% share by 2035, propelled by legally enforced emission reduction frameworks and enhanced monitoring, reporting, and verification systems
- The avoidance/reduction projects segment is likely to secure the second-largest share during 2026–2035, fueled by cost-effective emission prevention approaches and faster project implementation timelines
Key Growth Trends:
- Adjustment mechanisms for carbon border
- Statutory carbon tax increases credit demand
Major Challenges:
- Regulatory and policy inconsistency
- Supply constraints for high-durability removals
Key Players: South Pole Group (Switzerland), 3Degrees (U.S.), EKI Energy Services Ltd. (India), Finite Carbon (U.S.), Climate Impact Partners (UK), NativeEnergy (U.S.), Verra (U.S.), Gold Standard (Switzerland), ClimeCo Corporation (U.S.), Tasman Environmental Markets (Australia), Carbonbetter (U.S.), ClimatePartner Gmbh (Germany), Terrapass (U.S.), Carbon Credit Capital (U.S.), Moss Earth (U.S.), Cool Effect, Inc. (U.S.), Allcot Group (Spain), Climetrek Ltd. (UK), ClimateTrade (Spain), CarbonCure Technologies (Canada), Carbon Streaming Corporation (Canada), DevvStream Corp. (Canada), Mars Incorporated (U.S.), Cargill (U.S.), Climate Impact Partners (UK).
Global Industrial Carbon Credit Market Forecast and Regional Outlook:
Market Size & Growth Projections:
- 2025 Market Size: USD 11.1 billion
- 2026 Market Size: USD 12.8 billion
- Projected Market Size: USD 41.8 billion by 2035
- Growth Forecasts: 15.9% CAGR (2026-2035)
Key Regional Dynamics:
- Largest Region: Asia Pacific (42.7% Share by 2035)
- Fastest Growing Region: Europe
- Dominating Countries: United States, China, Germany, Japan, United Kingdom
- Emerging Countries: India, South Korea, Brazil, Indonesia, Mexico
Last updated on : 22 April, 2026
Industrial Carbon Credit Market - Growth Drivers and Challenges
Growth Drivers
- Adjustment mechanisms for carbon border: This is one of the most powerful growth drivers for the industrial carbon credit market that tends to transform carbon pricing from an environmental reform into a trade compliance need. According to official statistics published by NLM in February 2025, 12% of carbon emissions were categorized under the carbon pricing at USD 7 per ton, and presently, almost 23% of greenhouse gas emissions are valued at USD 32 per ton. Therefore, in terms of a promising policy strategy, carbon pricing deliberately stands out since it incentivizes low-carbon approaches, reduces expenses, and stimulates advancements. Besides, as per the June 2025 World Bank Organization report, there has been an expansion in carbon pricing revenues by USD 100 billion as of 2024. This benefited development, infrastructure, and environment projects, thus demonstrating a minor enhancement in comparison to previous years.
- Statutory carbon tax increases credit demand: A rise in statutory carbon taxes across different jurisdictions is readily acting as a suitable demand driver for the industrial carbon credit market. As stated in a data report published by the UNDP Organization in March 2025, in terms of maintaining environmental integrity standards for carbon credits, Singapore permitted taxable facilities to offset almost 5% of taxable emissions since 2024. Besides, by the end of 2024, 39 countries, such as Uruguay, South Africa, Mexico, Chile, Colombia, and Argentina, have successfully implemented carbon taxes globally. Meanwhile, upscaling digitalized technologies across high-emitting sectors, particularly materials, transport, and energy, can diminish worldwide emissions by 20% by the end of 2050, thereby making it suitable for bolstering the industrial carbon credit market growth.
Examined Carbon Tax Cases Across Different Countries, 2025
|
Features |
Sweden |
British Columbia (Canada) |
Colombia |
Chile |
Singapore |
|
Scope |
National |
Sub-National |
National |
National |
National |
|
Regulation Point |
Upstream |
Upstream |
Upstream |
Downstream |
Downstream |
|
Tax Threshold |
- |
- |
- |
25,000 TCO2-e and above |
25,000 TCO2-e and above |
|
Tax Rate (2024) |
USD 127.2 |
USD 58.9 |
USD 6.6 |
USD 5 |
USD 18.4 |
|
Sector Coverage |
CO2 emissions from combustion of all fossil fuels except peat. Sectoral exemptions apply. Includes fuel use in aviation. |
Economy-wide coverage on GHG emissions from purchase or use of fossil fuels. |
GHG emissions from all sectors with some minor exemptions |
CO2 emissions from mainly the power and industry sectors. |
Economy-wide coverage on GHG emissions from big emitters including manufacturing, power, waste, water sectors. |
|
Emission Coverage |
40% |
80% |
20% |
55% |
80% |
|
Offsets |
No |
Under national scheme. 50% of taxable emissions; to reduce |
50% of taxable emissions |
Unlimited |
5% of taxable emissions |
Source: UNDP Organization
- Volatility in energy pricing for decarbonization: There has been a recent surge in crude oil prices, highly driven by geopolitical instability, which in turn, emerges as yet another driver for the industrial carbon credit market globally. As per an article published by the EIA Government in April 2026, the Brent crude oil price amounted to USD 103 per barrel in March, denoting USD 32 per barrel higher than the average as of February, and meanwhile, regular Brent crude oil prices effectively reached nearly USD 128 per barrel in April. Besides, it has been expected that the well-supplied oil industry at the onset would result in keeping oil prices from surpassing USD 100 per barrel on an average monthly basis. Simultaneously, the past and future pricing of different oil liquids is also responsible for fueling the industrial carbon credit market expansion globally.
Different Oil-Based Liquid Pricing Analysis, 2024-2027
|
Liquid Type |
2024 |
2025 |
2026 |
2027 |
|
Brent Crude Oil Spot (USD per barrel) |
81 |
69 |
96 |
76 |
|
Global Liquid Fuels Production (million barrels per day) |
103.3 |
106.3 |
104.3 |
109.5 |
|
OPEC Liquid Fuels Production (million barrels per day) |
32.9 |
33.8 |
31.4 |
34.6 |
|
Non-OPEC Liquid Fuels Production (million barrels per day) |
70.4 |
72.5 |
72.9 |
74.8 |
|
Global Liquid Fuels Consumption (million barrels per day) |
102.8 |
104.0 |
104.6 |
106.2 |
|
Global GDP (% change) |
3.3 |
3.4 |
3.0 |
3.4 |
Source: EIA Government
Challenges
- Regulatory and policy inconsistency: The industrial carbon credit market operates within a patchwork of national and regional compliance systems, each with distinct rules on credit eligibility, vintage limits, and offset usage. A credit valid under the European Union Emissions Trading System may be rejected in China’s national market or under CORSIA aviation rules. This inconsistency forces energy sector participants to maintain multiple compliance strategies, increasing administrative burden and transaction costs. Furthermore, policy reversals or sudden changes in allowable credit categories create investment risk for long-lived industrial assets like carbon capture facilities or grid-scale storage projects paired with offset generation. The absence of a binding international agreement on carbon credit transfer under Article 6 of the Paris Agreement, particularly regarding corresponding adjustments, adds another layer of complexity, often delaying cross-border transactions and reducing industrial carbon credit market depth.
- Supply constraints for high-durability removals: Industrial buyers increasingly demand engineered removal credits, such as those from bioenergy with carbon capture or direct air capture, due to their high permanence and verifiability. However, the supply of such credits remains severely constrained by high capital costs, long project development timelines, and limited infrastructure for geological storage or mineralization. Unlike forestry or renewable energy credits, engineered removals require multi-year construction periods, specialized permitting, and sustained operational expertise. This supply bottleneck creates a widening gap between corporate net-zero pledges and available high-quality credits. As more energy and power companies commit to ambitious decarbonization targets, the scarcity of durable industrial removal credits drives prices upward but also risks delaying compliance fulfillment, thus negatively impacting the industrial carbon credit market growth.
Industrial Carbon Credit Market Size and Forecast:
| Report Attribute | Details |
|---|---|
|
Base Year |
2025 |
|
Forecast Year |
2026-2035 |
|
CAGR |
15.9% |
|
Base Year Market Size (2025) |
USD 11.1 billion |
|
Forecast Year Market Size (2035) |
USD 41.8 billion |
|
Regional Scope |
|
Industrial Carbon Credit Market Segmentation:
Type of Market Segment Analysis
The compliance market sub-segment, which is part of the type of market segment, is anticipated to garner the largest share of 95.6% in the industrial carbon credit market by the end of 2035. The segment’s upliftment is primarily attributed to increased application for enabling environmental integrity, legally enforced emission reduction objectives, and overcoming fraud through continuous monitoring, reporting, and verification (MRV) systems. According to official statistics published by NLM in February 2023, the carbon credit issuance by notable voluntary carbon economic registries, including the Gold Standard's SustainCert, the American Carbon Registry, Verra's Verified Carbon Standard, Plan Vivo, the Global Carbon Council and Climate Forward, and the Climate Action Reserve, rapidly grew 5-fold from 75 million credits to 354 million credits as of 2021. However, this gradually decreased to 279 million in 2022, thus denoting a growing capacity in the upcoming future.
Type of Project Segment Analysis
Based on the type of project, the avoidance/reduction projects segment is projected to grab the second-largest share in the industrial carbon credit market during the forecast period. The segment’s growth is effectively driven by focusing on preventing greenhouse gas emissions from entering the atmosphere in the first place, rather than removing existing carbon dioxide. Within the energy and power sector, typical projects include industrial energy efficiency upgrades, fuel switching from coal to natural gas or biomass, process heat optimization in manufacturing, and destruction of high-global-warming-potential industrial gases such as HFCs or N₂O from chemical production. The dominance of this segment stems from its relatively lower cost per credit compared to engineered removal technologies, faster project implementation timelines, and well-established methodologies for baseline setting and monitoring.
End use Industry Segment Analysis
By the end of the stipulated timeline, the power sub-segment, which is part of the end use industry, is expected to account for the third-largest share in the industrial carbon credit market. The sub-segment’s development is highly propelled by being the backbone of modernized civilization, which is crucial for regular life, industrial production, and economic growth by offering a reliable and consistent electricity supply. Based on government estimates published by the U.S. Environmental Protection Agency in June 2025, almost 90% of overall coal capacity featured 1 or more pollution control technologies in the form of selective catalytic reduction and scrubbers as of 2023. Therefore, based on this, the power industry is a significant source of emissions, especially in the U.S., effectively contributing an estimated 44% of sulphur dioxide, 11% of nitrogen oxide, and 30% of carbon emissions, thus proliferating the sub-segment’s growth.
Our in-depth analysis of the industrial carbon credit market includes the following segments:
|
Segment |
Subsegments |
|
Type of Market |
|
|
Type of Project |
|
|
End use Industry |
|
|
Enterprise Type |
|
|
Voluntary Project Type |
|
|
Removal Project Technology |
|

Vishnu Nair
Head - Global Business DevelopmentCustomize this report to your requirements — connect with our consultant for personalized insights and options.
Industrial Carbon Credit Market - Regional Analysis
APAC Market Insights
The Asia Pacific in the industrial carbon credit market is anticipated to garner the highest share of 42.7% by the end of 2035. The market’s upliftment is primarily attributed to expansion in national carbon industries across Southeast Asia, Japan, India, and China, along with expanded renewable energy projects, reforestation strategies, and an increase in sustainability commitments. According to official statistics published by the ADB Organization in October 2025, forests in the region span 6 million square kilometers, which accounts for 4.6% of the global landmass, further including 2.1 million square kilometers of primary forest. In addition, these forests are home to 38% of endemic bird species, 26% of endemic mammals, 25% of amphibians, and 23% of reptiles globally. Therefore, based on this, reforestation is essential to balance out carbon credit in the overall region.
The industrial carbon credit market in China is growing significantly, owing to strong industrial decarbonization mandates, a national emissions trading scheme, an increase in the energy power industry, the adoption of sustainable processes, and government-backed green finance mechanisms. As stated in an article published by the United Nations Environment Programme Finance Initiative (UNEP FI) in February 2026, the country is gradually developing coal infrastructure, with the intention to enhance solar and wind power by 6-times and effectively diminish greenhouse gas emissions by 7% to 10% by the end of 2035. Besides, in terms of green growth outcomes, domestic policies have facilitated social and green bond growth, with generous cumulative issuance reaching USD 555.5 billion. This is equivalent to 11.7% of worldwide bonds as of 2024, further demonstrating a 12-fold increase since previous years.
The aspects of yearly investments in carbon abatement technologies, an increase in funding for green chemistry strategies, an expansion in compliance coverage, industrial modernization demands, low-cost abatement opportunities, and a reduction in chemical industrial emissions are a few trends that are proliferating the industrial carbon credit market in India. Based on government estimates published by the PIB Government in February 2026, the government in the country established dedicated chemical facilities, with a suitable budget allocation, amounting to USD 64.1 million by the end of 2027. Besides, an allocation of USD 2.3 billion has been proclaimed for readily supporting the deployment and development of carbon capture, utilization, and storage (CCUS), thus driving the industrial carbon credit market growth.
Europe Market Insights
Europe in the industrial carbon credit market is expected to emerge as the fastest-growing region during the forecast period. The market’s development is highly propelled by the presence of strict emission reduction targets, an increase in developing voluntary carbon industries, integrating digital MRV technologies, a focus on renewable energy, and cross-border recognition. According to official statistics published by the Europe Environmental Agency (EEA) in December 2025, the region has successfully achieved 20% of its renewable energy target as of 2020. Besides, renewable energy sources demonstrated an approximate 24.5% of the regional finalized energy utilization as of 2023. Besides, the energy transition is underway, with carbon dioxide emissions in the regional electricity industry expected to increase its demand for transport and heating, which is also responsible for enhancing the industrial carbon credit market development.
Global Electricity Export-Import Analysis in Europe, 2024
|
Countries |
Export (USD) |
Import (USD) |
|
France |
8.2 billion |
1.0 billion |
|
Germany |
4.5 billion |
7.1 billion |
|
Switzerland |
4.1 billion |
2.5 billion |
|
Austria |
3.4 billion |
1.8 billion |
|
Norway |
2.1 billion |
443 million |
|
Netherlands |
2.0 billion |
1.6 billion |
|
Sweden |
2 billion |
376 million |
|
Czechia |
1.9 billion |
1.3 billion |
|
Slovakia |
1.9 billion |
1.2 billion |
|
Spain |
1.8 billion |
1.2 billion |
Source: OEC
The industrial carbon credit market in Germany is gaining increased traction, owing to leadership in the phase-out of coal-fired power generation, expansion in carbon storage and capture facilities, strict emission reduction strategies for manufacturing and chemical industries, an increase in carbon credit procurement, and a reduction in yearly emissions. Based on government estimates published by the ITA in August 2025, primary energy consumption in the country amounted to 10,478 petajoules as of 2024, which was more than 77% deriving from fossil fuels and 20% for renewable sources. In this regard, oil has positioned itself as the ultimate energy source with a 36.1% share, which is followed by 25.9% for natural gas. Besides, the phase-out of coal is predicted to be legally mandated by the end of 2038, in support from the latest coalition agreement, thus positively impacting the industrial carbon credit market development in the country.
The modernization of industrial facilities through generous funding, an increase in regional carbon industry participation, increased carbon intensity, suitable opportunities for emission-based reduction projects, and sector-wise decarbonization in coal-dependent locations are certain trends for expanding the industrial carbon credit market in Poland. As per a data report published by the OECD Organization in February 2026, 76.3% of greenhouse gas emissions in the country are subject to an optimistic net effective carbon rate (ECR). Additionally, explicit carbon prices comprise emission trading systems (ETS) permit prices and carbon taxes, deliberately covering 50.4% of greenhouse gas emissions in carbon dioxide equivalent. Moreover, the ETA roughly covers 43.1% of the domestic GHG emissions, which is more than carbon taxes, thus fueling the industrial carbon credit market exposure.
North America Market Insights
North America in the industrial carbon credit market is projected to witness considerable growth by the end of the stipulated duration. The market’s growth in the region is effectively driven by emerging compliance mechanisms, federal carbon pricing, corporate net-zero commitments, and the development of an engineered carbon removal project. Based on government estimates published by the Office of the Federal Chief Sustainability Office in 2026, the region’s federal government is expected to successfully execute a whole-of-government strategy to enhance the production, facilitation, and utilization of 100% carbon pollution-free electricity by the end of 2035. Likewise, every federal agency is poised to achieve zero-emission vehicle (ZEV) for 100% of overall light-duty vehicles by the end of 2027, and medium-and heavy-duty vehicles by 2035, thus driving the market exposure.
The industrial carbon credit market in the U.S. is gaining increased exposure, owing to the federal tax incentive, expansion in domestic compliance, an increase in the demand for data center and methane regulation, innovative funding, and government procurement. As stated in an article published by the EPA Government in February 2026, the Methane Emissions Reduction Program in the country provides USD 1.3 billion in technical and financial assistance through different funding opportunities. These opportunities include EPA to revise the Greenhouse Gas Reporting Program (GHGRP) subpart W regulations for the oil and gas industry and establish a Waste Emissions Charge (WEC) for methane. Besides, as per the May 2025 Congress Government report, the Global Methane Pledge (GMP) is considered a voluntary commitment to diminish anthropogenic methane emissions by almost 30% by the end of 2030, which is also responsible for fueling the industrial market growth in the nation.
The federal carbon pricing backstop, output-driven pricing system, Alberta’s TIER system, federal and provincial coordination, the cap-and-trade association between Quebec and California, along with ESG compliance and corporate sustainability, are certain factors for bolstering the industrial carbon credit market in Canada. As per an article published by the David Suzuki Foundation Organization in 2026, the country’s carbon levy, since its initiation at USD 14.6 per ton, gradually increased by USD 10 per year to USD 50 as of 2022. In addition, currently, it is increasing by USD 15 until 2030, by which the pricing is predicted to be worth USD 170 per ton. Besides, the most recent surge in April 2024, amounting to USD 58.6 per ton, added just 3 cents to 1 liter of gasoline, which is less than profit-based price hikes imposed by the sector, thus proliferating the market expansion.
Key Industrial Carbon Credit Market Players:
- South Pole Group (Switzerland)
- 3Degrees (U.S.)
- EKI Energy Services Ltd. (India)
- Finite Carbon (U.S.)
- Climate Impact Partners (UK)
- NativeEnergy (U.S.)
- Verra (U.S.)
- Gold Standard (Switzerland)
- ClimeCo Corporation (U.S.)
- Tasman Environmental Markets (Australia)
- Carbonbetter (U.S.)
- ClimatePartner Gmbh (Germany)
- Terrapass (U.S.)
- Carbon Credit Capital (U.S.)
- Moss Earth (U.S.)
- Cool Effect, Inc. (U.S.)
- Allcot Group (Spain)
- Climetrek Ltd. (UK)
- ClimateTrade (Spain)
- CarbonCure Technologies (Canada)
- Carbon Streaming Corporation (Canada)
- DevvStream Corp. (Canada)
- Mars Incorporated (U.S.)
- Cargill (U.S.)
- Climate Impact Partners (UK)
- Company Overview
- Business Strategy
- Key Product Offerings
- Financial Performance
- Key Performance Indicators
- Risk Analysis
- Recent Development
- 3Degrees provides comprehensive carbon offset solutions tailored for the energy and power sector, helping utilities and industrial clients navigate voluntary and compliance markets. The company focuses on high-quality, verified reduction projects, including landfill gas capture and renewable energy certificates.
- EKI Energy Services Ltd. is a dominant player in the global carbon credit supply chain, actively developing and trading offsets from industrial efficiency and fuel switching projects. The firm plays a critical role in bridging project developers in developing economies with compliance buyers in regulated markets.
- Finite Carbon specializes in developing nature-based carbon credits, primarily from improved forest management, which are increasingly utilized by power companies to offset residual emissions. The company leverages its proprietary platform to ensure transparency and long-term monitoring for industrial credit purchasers.
- Climate Impact Partners works with major energy and industrial corporations to design and procure bespoke carbon credit portfolios aligned with net-zero commitments. The firm emphasizes additionality and co-benefits, ensuring that each credit represents genuine emission reductions beyond business-as-usual scenarios.
- NativeEnergy focuses on helping businesses in the energy sector achieve carbon neutrality through verified avoidance and reduction projects, including agricultural methane capture and community-scale renewables. The company is known for its rigorous project vetting process, which appeals to industrial buyers seeking high-integrity offsets.
Here is a list of key players operating in the global market
The industrial carbon credit market features a fragmented competitive landscape dominated by project developers and standards registries. Key players, such as South Pole, 3Degrees, and EKI Energy, compete on project development scale and registry relationships. A major strategic shift is the move toward long-term offtake contracts, with forward agreement value rising significantly as buyers secure future supply. Companies are also prioritizing high-integrity credits aligned with Core Carbon Principles, as quality premiums widen. For instance, in September 2022, Carbon Streaming Corporation entered into an outstanding term sheet with Future Carbon Group for covering 4 REDD+ projects in Brazil. Based on this term sheet, the company made an advancement in Future Carbon through USD 3 million and entered into a royalty agreement to cover its interest in the projects, thus positively impacting the industrial carbon credit industry.
Corporate Landscape of the Industrial Carbon Credit Market:
Recent Developments
- In December 2025, DevvStream Corp. and Southern Energy Renewables Inc. declared a business combination by targeting low-cost production of carbon-negative sustainable aviation fuel (SAF) and green methanol by utilizing regional wood-waste biomass for delivering carbon-negative at scale.
- In October 2025, Mars Incorporated and Cargill readily developed over 224 MWac of the newest renewable energy capacity through 5 virtual power purchase agreements in Poland. This development was initiated with GoldenPeaks Capital, which is one of the fastest-growing independent producers of renewable energy in Europe.
- In March 2025, Climate Impact Partners signed a new deal with Terra Natural Capital for delivering long-lasting finance to the Panna Afforestation Project in India, based on which Microsoft purchased 1.5 million tons of verified carbon removal credits for more than 30 years, further demonstrating 50% of the project’s output.
- Report ID: 8525
- Published Date: Apr 22, 2026
- Report Format: PDF, PPT
- Explore a preview of key market trends and insights
- Review sample data tables and segment breakdowns
- Experience the quality of our visual data representations
- Evaluate our report structure and research methodology
- Get a glimpse of competitive landscape analysis
- Understand how regional forecasts are presented
- Assess the depth of company profiling and benchmarking
- Preview how actionable insights can support your strategy
Explore real data and analysis
Frequently Asked Questions (FAQ)
About this Report
Connect with our Expert

Report, 2026-2035


Copyright @ 2026 Research Nester. All Rights Reserved.
