In-Line UV-vis Spectroscopy Market Outlook:
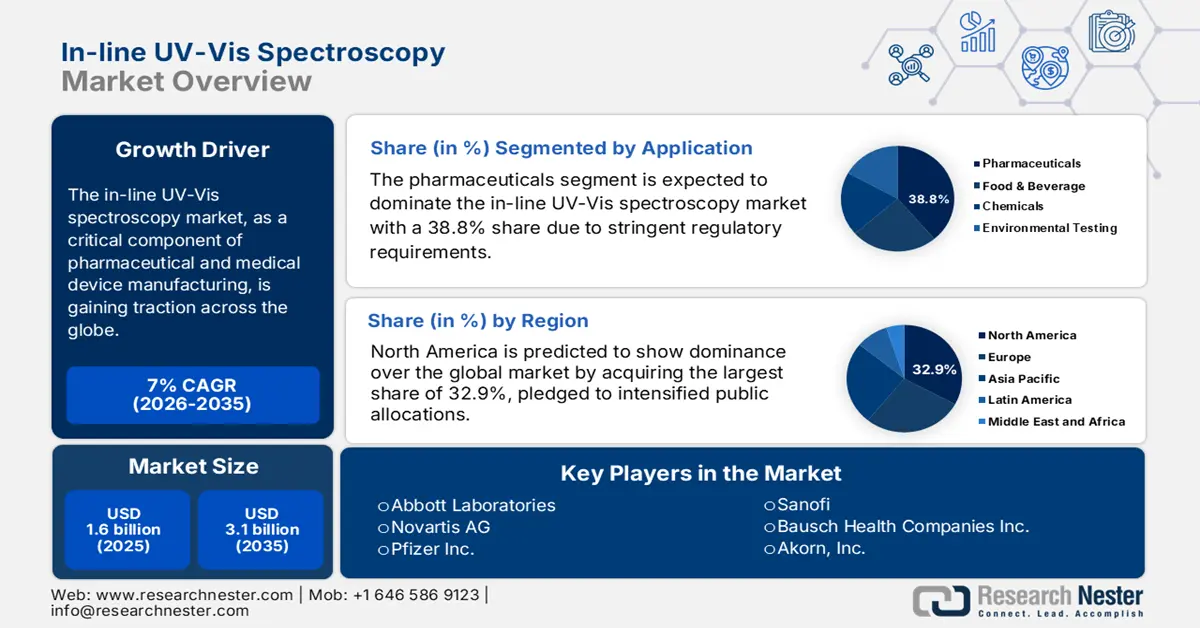
In-Line UV-vis Spectroscopy Market size was over USD 1.6 billion in 2025 and is estimated to reach USD 3.1 billion by the end of 2035, expanding at a CAGR of 7% during the forecast timeline, i.e., 2026-2035. In 2026, the industry size of in-line UV-vis spectroscopy is estimated at USD 1.7 billion.
The patient pool driving the market is related to the high volume of people requiring continuous pharmaceutical treatments. for instance, the management of chronic conditions such as diabetes, cardiovascular diseases, and cancer involves long-term, often lifelong, drug regimens. According to the WHO September 2025 report, 43 million individuals died in 2021 due to non-communicable diseases, creating a sustained need for reliable drug manufacturing. For manufacturers catering to this market, In-Line UV-vis technology is essential since it is heavily impacted by the increasingly stringent quality control standards for the manufacturing of drugs and APIs.
On the pharmaceutical supply chain side, the In-Line UV-vis Spectroscopy is critical due to its role in Process Analytical Technology, which facilitates greater control, quality, and efficiency from API synthesis right through to the final product. Based on Thermo Fisher's October 2025 report, UV-vis spectroscopy is used in DNA melting analysis and monitoring of absorbance changes at 260 nm as DNA shifts from a double-stranded to single-stranded structure. This aids the flexibility of technology and proves its ability to provide real-time and accurate measurements in biopharmaceutical production as well as molecular biology research to support process optimization and analytical integrity.
Key In Line UV Vis Spectroscopy Market Insights Summary:
Regional Highlights:
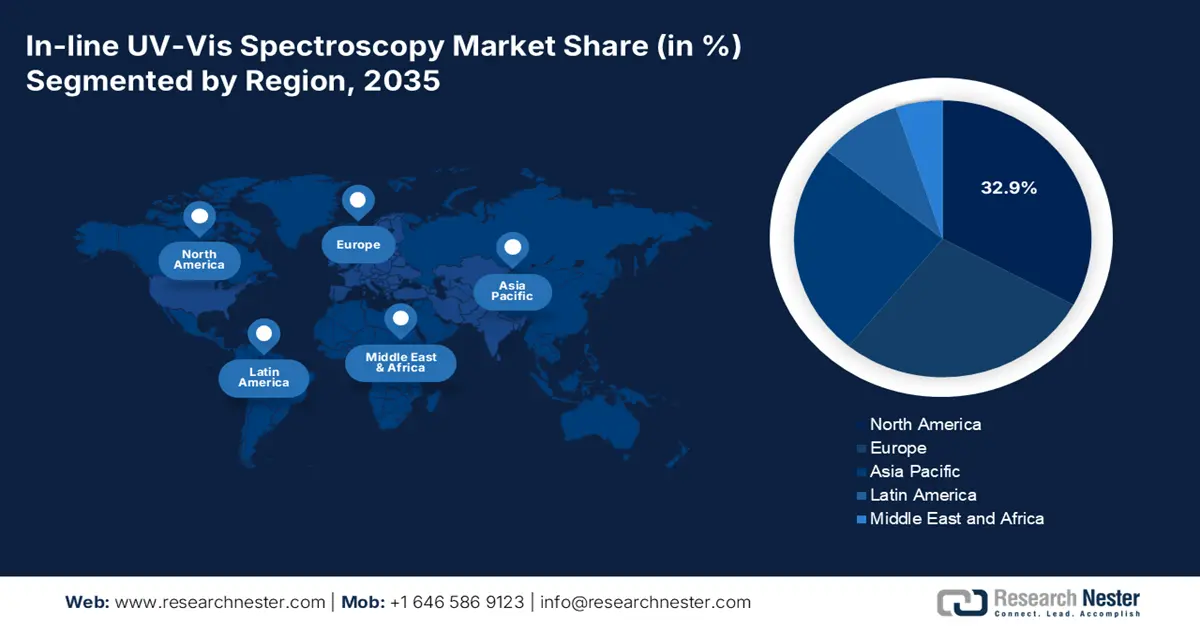
- North America is forecast to secure a 32.9% share of the In-Line UV-vis Spectroscopy Market by 2035, sustained by stricter quality-control regulations and expanded public investments in advanced manufacturing initiatives.
- Asia Pacific is anticipated to rise as the fastest-growing region by 2035, fueled by rapid pharmaceutical sector expansion and proactive government-led programs promoting advanced in-line monitoring technologies.
Segment Insights:
- The pharmaceuticals segment in the In-Line UV-vis Spectroscopy Market is projected to command a 38.8% share by 2035, reinforced by stringent regulatory expectations and escalating biologics production requirements.
- The benchtop systems segment is expected to hold a considerable share by 2035, supported by its precision, operational versatility, and strong validation within highly regulated laboratory and manufacturing environments.
Key Growth Trends:
- Clinical and economic advantages
- Enlarging patient pool in key landscapes
Major Challenges:
- Absence of harmonized standards
- Increased concern about data privacy
Key Players: Novartis AG (via Sandoz), Pfizer Inc., Sanofi, Bausch Health Companies Inc., Akorn Inc., Teva Pharmaceutical Industries Ltd., Mylan N.V. (now part of Viatris), Sun Pharmaceutical Industries Ltd., Lupin Limited, Cipla Ltd., Apotex Inc., Hikma Pharmaceuticals PLC, Fresenius Kabi, CooperVision (Thea Pharmaceuticals), Bausch + Lomb, Entod Pharmaceuticals, Alcon Inc., Medicare, Ajanta Pharma.
Global In Line UV Vis Spectroscopy Market Forecast and Regional Outlook:
Market Size & Growth Projections:
- 2025 Market Size: USD 1.6 billion
- 2026 Market Size: USD 1.7 billion
- Projected Market Size: USD 3.1 billion by 2035
- Growth Forecasts: 7% CAGR (2026-2035)
Key Regional Dynamics:
- Largest Region: North America (32.9% Share by 2035)
- Fastest Growing Region: Asia Pacific
- Dominating Countries: United States, China, Germany, Japan, United Kingdom
- Emerging Countries: India, South Korea, Brazil, Indonesia, Mexico
Last updated on : 24 October, 2025
In-line UV-vis Spectroscopy Market - Growth Drivers and Challenges
Growth Drivers
- Clinical and economic advantages: The proven ability of products from the market to significantly improve pharmaceutical manufacturing efficiency is creating a sustainable consumer base. As evidence, in 2022, a study from the Agency for Healthcare Research and Quality was published, demonstrating a reduction in batch failures through the use of real-time UV-vis monitoring. The evaluation also underscored its contribution to saving from API waste every year. Such validation, coupled with enhanced efficiency gains, is amplifying its utilization among pharma manufacturers requiring optimization of their quality and cost control operations.
- Enlarging patient pool in key landscapes: A major growth driver for the in-line UV-vis spectroscopy market is notable demographic expansion. This can be testified by the report from the NLM study in January 2024 stating 27% of adults in U.S. have more than one chronic condition. With such evidence, it is clear that the technology has become indispensable for ensuring patient safety and efficacy. Moreover, the critical role of these systems in modernizing drug manufacturing and quality assurance processes is sustaining the use of spectroscopic technologies in both clinical trials and production.
- Rigorous R&D participation and allocation: One of the major growth drivers in the market is the substantial investments in innovation. For instance, in 2025 alone, allocations to R&D, which includes associated technologies, reached USD 26,281,551,872, specifically sanctioned to escalate the scale of AI-driven process automation, as unveiled by the AAMC August 2025 report. Additionally, the Horizon Europe program is committed to maintain consistency in advances of industrial spectroscopy. Furthermore, the regional efforts to concur in precision pharmaceutical and chemical manufacturing are fueling the progress of this field.
Some Major Innovations in In-Line UV-vis Spectroscopy
|
Year |
Innovation |
Advancement |
Application Area |
|
2020 |
Development and validation of an in-line UV-vis spectroscopy method for quantifying active pharmaceutical ingredient (API) concentration in continuous manufacturing |
Introduced UV-vis as a robust process analytical technology (PAT) for real-time drug content uniformity and solubility monitoring in pharmaceutical manufacture |
Pharmaceutical continuous manufacturing |
|
2021 |
Chemometric integration for quantifying rare-earth ions (Nd(III), Er(III), Cu(II)) using UV-vis spectroscopy |
Used partial least squares (PLS) regression to improve spectral accuracy in complex ion solution measurements |
Nuclear fuel processing and material characterization |
|
2024 |
Machine learning-assisted VUV/UV gas-phase spectral prediction model using molecular features (ABOCH algorithm) |
mplemented molecular feature engineering and random forest regression to predict UV-vis absorption spectra with 0.715 R² accuracy across 1,397 volatile compounds |
Fuels, environmental forensics, pharmaceutical analytics |
|
2025 |
High-temperature modular optical cell combining UV-vis and LIBS spectroscopy for in-line vapor-phase chemical monitoring |
Developed dual spectroscopy cell design (operating up to 450°C) with tunable optical paths and a cover gas buffer to prevent window fouling during continuous monitoring |
Molten salt reactors, environmental and process gas monitoring |
Challenges
- Absence of harmonized standards: The regulatory divergence between major landscapes often creates volatility in efficiency gain in the in-line UV-vis spectroscopy market. For instance, the differing FDA and EMA calibration requirements increased compliance costs for manufacturers. Moreover, this discrepancy adds significant operational complexity and expense by forcing companies to maintain separate validation protocols. Thus, the lack of harmonized frameworks creates barriers to accomplishing commercial goals, discouraging manufacturers and pharmaceutical producers from adopting these systems.
- Increased concern about data privacy: The market often faces hurdles from stringent data protection regulations. This can be exemplified by the fines, implemented by the General Data Protection Regulation (GDPR), for cloud-based spectroscopy data breaches in 2023, as unveiled by the European Data Protection Board (EDPB). Such financial losses and complications create hesitation about investing in and applying next-generation technologies, as the assurance of robust cybersecurity measures is mandated to avoid penalties.
In-line UV-vis Spectroscopy Market Size and Forecast:
| Report Attribute | Details |
|---|---|
|
Base Year |
2025 |
|
Forecast Year |
2026-2035 |
|
CAGR |
7% |
|
Base Year Market Size (2025) |
USD 1.6 billion |
|
Forecast Year Market Size (2035) |
USD 3.1 billion |
|
Regional Scope |
|
In-line UV-vis Spectroscopy Market Segmentation:
Application Segment Analysis
The pharmaceuticals segment in the market is expected to dominate with a 38.8% share by the end of 2035. The stringent regulatory requirements and biologics production needs are the basis of this leadership. The NLM study in November 2023 discussed on the in-line UV/Vis spectroscopy technique to monitor the active pharmaceutical ingredient (API) content in tablets. Based on the analysis, it is found that the tablet's composition consisted of 7% to 13% wt theophylline monohydrate as API, magnesium stearate, and lactose monohydrate. As a result, the technology is rapidly adopted in the pharmaceutical industry for formulation optimization and quality assurance.
Type Segment Analysis
The benchtop systems segment is poised to hold a considerable share in the in-line UV-vis spectroscopy market over the analyzed period. The enhanced accuracy, viability, and flexibility in handling diverse sample types in controlled environments are making these instruments the preferred option for laboratory operations and manufacturing administration. Thus, despite the growing interest in portable alternatives, benchtop spectrometers continue to maintain their importance in pharmaceutical testing and research. Moreover, the validation gained in highly regulated industries solidifies the forefront position for this product category.
Component Segment Analysis
Detectors are anticipated to be crucial assets for the market as they enable a continuous, real-time measurement of substances directly in the production process every 10 seconds or less, without sampling, interruptions, or delays, based on the ColVisTec report in 2024. Continuous technological advances and evolving consumer requirements are creating a sustainable demand for this component. As evidence, the governing body of Germany is dedicated to empower its Industry 4.0 initiative with integrated smart detectors. This underscores the critical role of these essentials in the modernization of pharmaceutical and industrial processes.
Our in-depth analysis of the in-line UV-vis spectroscopy market includes the following segments:
|
Segment |
Subsegments |
|
Application |
|
|
Component |
|
|
Type |
|
|
End user |
|

Vishnu Nair
Head - Global Business DevelopmentCustomize this report to your requirements — connect with our consultant for personalized insights and options.
In-line UV-vis Spectroscopy Market - Regional Analysis
North America Market Insights
North America market is predicted to show dominance by acquiring the largest share of 32.9% throughout the assessed tenure. In this landscape, the U.S. accounts for the largest regional share on account of the tightening quality control regulations. The proprietorship is also pledged to intensified public allocations in extended advancements and deployments. Government spending in the U.S., through initiatives like the National Institute of Standards and Technology's (NIST) Advanced Manufacturing programs, supports technological advancement.
The U.S. leads the regional market, which is backed by robust biologics manufacturing and rigorous financial backing. In this regard, in June 2025, NIH allocated USD 48 billion in investment in medical research supports innovation in biotechnology and pharmaceutical sectors, hence indirectly driving the in-line UV-vis spectroscopy systems demands that are used in molecular analysis, process monitoring, and quality control. Further, the U.S. FDA's Emerging Technology Program collaborates with industry leaders to enable and surge the advanced manufacturing technologies.
Canada is also cultivating a strong foundation for the market and is driven by coordinated public health investments, domestic manufacturing, and regulatory advancements. This is a direct response to vulnerabilities that were mainly exposed during the COVID-19 pandemic. The Government of Canada's report in July 2025 depicts that the federal government's Biomanufacturing and Life Sciences Strategy, backed by a USD 2.2 billion investment, explicitly aims to build a resilient, domestic vaccine and therapeutic production network.
APAC Market Insights
Asia Pacific market is emerging as the fastest-growing region by the end of 2035. Robust pharmaceutical sector expansion and proactive government initiatives are the propellers of the region's augmentation in this sector. For instance, the accelerated PMDA pathway resulted in an increase in spectrometer adoption in Japan. India's Production Linked Incentive (PLI) scheme for pharmaceuticals commits approximately ₹15,000 crore in 2021, as per the PIB report in August 2025 to bolster domestic manufacturing of key products and APIs, directly fostering demand for advanced manufacturing technologies like in-line monitoring. On the other hand, the K-BioHealth Plan prioritizes AI-powered spectroscopy, which is an indication of progress in this sector in South Korea, as unveiled by the Ministry of Food and Drug Safety (MFDS). Besides, the Medical Device Authority of Malaysia enforced ISO 13485 standards for imports to ensure quality while stimulating local market growth.
China established its significance in the in-line UV-vis spectroscopy market by capturing a highest percentage of regional revenue share. The tightening regulatory mandates and large-scale pharmaceutical production capacity of the country reflects the presence of a favorable atmosphere to concur this sector with greater outcomes. As evidence, the National Medical Products Administration enacted new regulations requiring spectroscopy in API manufacturing facilities. Whereas the 2025 NMPA mandate is regulated to extend the same setting for all injectable drugs. This is ultimately supporting patients, who relies on spectroscopically validated medications, according to the National Health Commission.
India is rapidly growing as a lucrative scope of investment for the market in APAC. Its thriving generic drug industry and strong government support are cultivating an attractive opportunity for pioneers to gain maximum profit from this sector. As evidence of the pharmaceutical market in the country is expected to reach USD 130 billion in the next five years, enhancing pharmaceutical production quality, based on the Invest India report in February 2023. Besides, the production linked incentive (PLI) scheme is encouraging local manufacturing hubs to participate in this field, targeting domestic spectrometer production by 2030.
Europe Market Insights
Europe is expected to maintain its significance as the second-largest shareholder in the global in-line UV-vis spectroscopy market during the tenure between 2026 and 2035. The consistent performance in this category is underpinned by targeted regulatory policy enactments and robust biopharmaceutical industry expansion. This can be testified by the EMA’s 2025 guidelines mandating real-time spectroscopy for advanced therapies. Besides, the 2024 HAS policy of France has already fostered a YoY demand increase in API production applications. Moreover, Italy and Spain are also emerging as high-potential marketplaces, solidifying the region’s position as a compliance-driven spectroscopy hub.
Germany dominates the Europe market, which is primarily propelled by the increased Industry 4.0 adoption. As evidence of the positive impact of such initiatives, the German Medical Association (BÄK) revealed that pharma plants now utilize AI-powered spectroscopy systems. Further, the Federal Ministry of Education and Research data in November 2022 depicts that the state government has invested 50 million euros for the implementation of the bioeconomy strategy’s measures from 2020 to 2024, as the part of investment drives the expansion of biomanufacturing facilities, R&D centers, and biotechnology hubs, which directly boosts demand for advanced process analytical technologies like in-line UV-vis spectroscopy.
The UK holds a significant share of the Europe in-line UV-vis spectroscopy market on account of post-Brexit regulatory reforms and targeted healthcare investments. For instance, the Medicines and Healthcare products Regulatory Agency mandated spectroscopy for all biosimilars. Besides, the investment from the National Health Service empowered the development of portable units, escalating the adoption of localized laboratories. This further spurred a surge in biopharmaceutical demand for spectroscopy, as reported by the Association of the British Pharmaceutical Industry.
Key In-Line UV-vis Spectroscopy Market Players:
- Abbott Laboratories (USA)
- Company Overview
- Business Strategy
- Key Product Offerings
- Financial Performance
- Key Performance Indicators
- Risk Analysis
- Recent Development
- Regional Presence
- SWOT Analysis
- Novartis AG (via Sandoz) (Switzerland)
- Pfizer Inc. (USA)
- Sanofi (France)
- Bausch Health Companies Inc. (Canada / USA)
- Akorn, Inc. (USA)
- Teva Pharmaceutical Industries Ltd. (Israel)
- Mylan N.V. (now part of Viatris) (USA)
- Sun Pharmaceutical Industries Ltd. (India)
- Lupin Limited (India)
- Cipla Ltd. (India)
- Apotex Inc. (Canada)
- Hikma Pharmaceuticals PLC (United Kingdom)
- Fresenius Kabi (Germany)
- CooperVision (Thea Pharmaceuticals) (United Kingdom / France)
- Bausch + Lomb (USA / Canada)
- Entod Pharmaceuticals (India)
- Alcon Inc. (Switzerland / USA)
- Medicare (India)
- Ajanta Pharma (India)
- Abbott Laboratories is a key player in incorporating diagnostic and device technology, mainly in cardiology and diabetes care. In the fiscal year 2024 to 2025, the company has launched 7 new products. In the Market, Abbott uses the latest technology within its bioprocessing systems to enable the real-time monitoring of critical process parameters, including protein concentration and cell density, during the production of pharmaceutical and biologics compounds.
- Novartis is a global leader in biosimilar and generics, and uses advanced manufacturing technologies to ensure that quality and efficiency are satisfied. In 2024, the company achieved a net sale of USD 50.3 billion and is focused on creating new ways to change lives. In the Market, the company employs this analytical technique directly within its production lines for APIs. This enables real-time monitoring of chemical reactions and solution concentrations during synthesis and assures the potency, purity, and consistency of generic drugs and biosimilars.
- Pfizer Inc. is a research-based biopharmaceutical company that has a diverse product portfolio. The company is enabled with advanced manufacturing operations and is a key adopter of in-line UV-vis spectroscopy. The technology is vital for monitoring of bioreactor conditions. Further, the data available from this technology ensures the robust quality and efficacy of its pharmaceuticals.
- Sanofi is a global healthcare leader focused on vaccines, rare diseases, and chronic medicines by utilizing advanced process analytical technology (PAT) in its biomanufacturing. In the Market, the company incorporates these systems to monitor key fermentation and cell culture processes in real-time, allowing for the dynamic control of nutrient feeds and early detection of process deviations.
- Bausch Health concentrates on production efficiency for its portfolio of therapeutics. For its line of therapeutics in the Market, the company applies this technology to track and regulate the production of APIs of its branded, generic, and specialty pharmaceuticals. This real-time analysis ensures consistent product quality, reduces batch failures, and improves the overall efficiency of its manufacturing operations for various products.
Here is a list of key players operating in the global market:
The in-line UV-vis spectroscopy market is highly consolidated, where Thermo Fisher and Agilent are maintaining their leadership on account of their capabilities in AI integration and regulatory-compliant solutions development. On the other hand, Shimadzu and PerkinElmer are augmenting through extended biopharma applications, while Bruker utilizes its specialization in nanomaterials. Furthermore, key players such as Gilson announced the introduction of a new UV-VIS detector to its VERITY line of purification systems in July 2022, whereas firms in emerging marketplaces are targeting cost-sensitive generic drug demand and consumer bases.
Corporate Landscape of the In-Line UV-vis Spectroscopy Market:
Recent Developments
- In April 2025, Marama Labs announced the launch of a new version of its new CloudSpec instrument. This UV-vis spectrophotometer is developed to enhance the development times for nanoparticle drug formulations used in cancer treatments, vaccines, and gene therapies, addressing a requirement in the industry
- In January 2025, Repligen Corporation announced the launch of its CTech SoloVPE PLUS System, which is the most advanced UV-based Variable Pathlength Technology system available to biopharmaceutical manufacturers.
- Report ID: 7986
- Published Date: Oct 24, 2025
- Report Format: PDF, PPT
- Explore a preview of key market trends and insights
- Review sample data tables and segment breakdowns
- Experience the quality of our visual data representations
- Evaluate our report structure and research methodology
- Get a glimpse of competitive landscape analysis
- Understand how regional forecasts are presented
- Assess the depth of company profiling and benchmarking
- Preview how actionable insights can support your strategy
Explore real data and analysis
Frequently Asked Questions (FAQ)
In Line UV Vis Spectroscopy Market Report Scope
Free Sample includes current and historical market size, growth trends, regional charts & tables, company profiles, segment-wise forecasts, and more.
Connect with our Expert


Copyright @ 2026 Research Nester. All Rights Reserved.
