Electricity Trading Market Outlook:
Electricity Trading Market size was over USD 95.1 billion in 2025 and is estimated to reach USD 173.3 billion by the end of 2035, expanding at a CAGR of 6.9% during the forecast timeline, i.e., 2026-2035. In 2026, the industry size of electricity trading is evaluated at USD 101.6 billion.
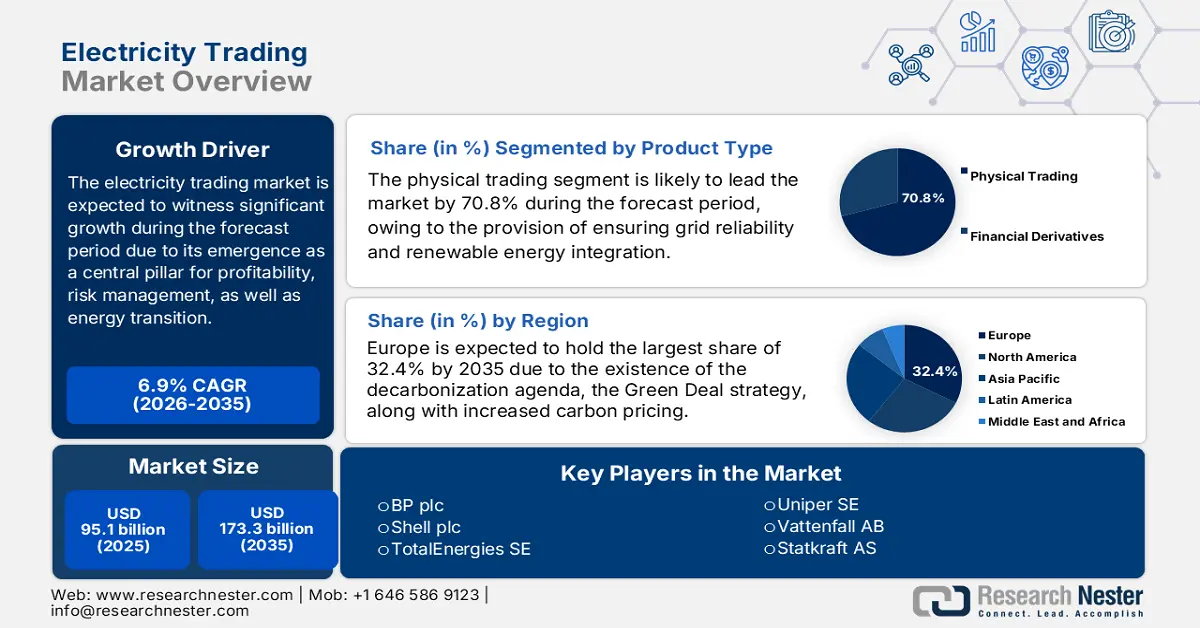
The international electricity trading market is currently witnessing a profound structural transformation, shifting from a cost-driven ancillary function into a strategic and centralized pillar for energy transition, risk management, and profitability. This transition is readily catalyzed by power grids' decarbonization, market liberalization, and energy assets digitalization. According to an article published by the Zero Carbon Analytics Organization in March 2024, electricity grids are considered the backbone of international energy systems that tend to diminish emissions and restrict global warming to 15 degrees Celsius. Besides, to gain net-zero emissions by the end of 2050, solar and wind need to cater to nearly 80% of electricity generation, thus demanding a significant increase in the international renewable capacity, which in turn is creating an optimistic outlook for the overall electricity trading market.
Furthermore, the aspect of artificial intelligence (AI) and digitalization dominance, a rise of corporate power purchase agreements, growth of distributed energy resource aggregation, and rapid expansion of cross-border market coupling are also fueling the electricity trading market’s growth. As per an article published by the EIB Organization in July 2022, renewable energies, including solar and wind power, have emerged as the mainstream source of electricity, accounting for 70% of investment in power generation internationally. Besides, corporations significantly purchased 31.1 gigawatts of clean power through long-lasting contracts. For instance, Amazon has successfully signed power purchase deals with 44 renewable energy projects across 9 different nations, accounting for an overall capacity of 6.2GW. In addition, it has been further projected to operate with 100% renewable energy by the end of 2030 and also ensure zero carbon emissions by the end of 2040.
Key Electricity Trading Market Insights Summary:
Regional Highlights:
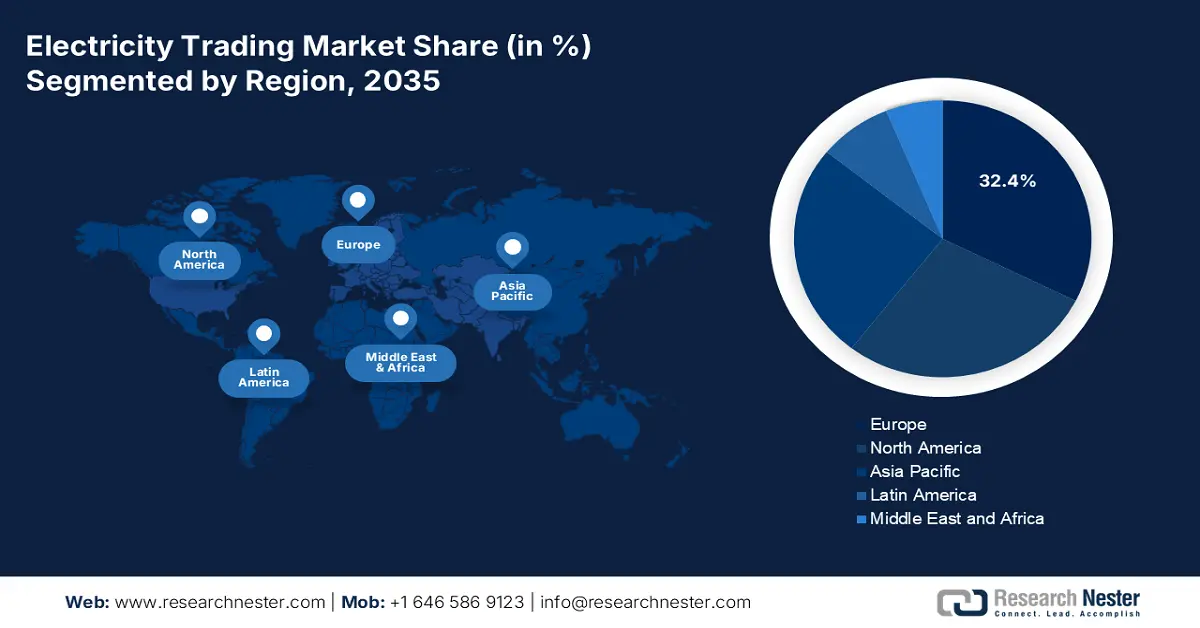
- By 2035, Europe is expected to command a 32.4% share in the electricity trading market, supported by its ambitious decarbonization agenda and the Europe Green Deal.
- Over 2026-2035, Asia Pacific is set to emerge as the fastest-growing region as its expansion is reinforced by large-scale renewable integration, ongoing market liberalization, and rising electricity demand from industries such as chemicals.
Segment Insights:
- By 2035, the physical trading segment is projected to hold a 70.8% share in the electricity trading market, bolstered by its importance for ensuring grid reliability, integrating renewable energy, and balancing supply and demand by permitting regions with surplus to commercialize to nations with a deficit.
- Across 2026-2035, the exchange-based trading sub-segment is anticipated to secure the second-largest share as its advancement is strengthened by offering immediate liquidity, mitigating counterparty credit risk, and enabling price transparency through a centralized clearinghouse.
Key Growth Trends:
- Integration of renewable energy
- Increased demand for electrification
Major Challenges:
- Policy uncertainty and regulatory fragmentation
- Infrastructure deficits and physical grid constraints
Key Players: Vitol Group (Switzerland), Glencore plc (Switzerland), Trafigura Group Pte. Ltd. (Singapore), Gunvor Group (Switzerland), Mercuria Energy Group (Switzerland), Koch Supply & Trading (U.S.), BP plc (U.K.), Shell plc (U.K.), TotalEnergies SE (France), Uniper SE (Germany), Vattenfall AB (Sweden), Statkraft AS (Norway), Ørsted A/S (Denmark), EDF (France), Engie (France), Mitsubishi Corporation (Japan), Mitsui & Co., Ltd. (Japan), Macquarie Group (Australia), Posco International (South Korea), JERA Co., Inc. (Japan).
Global Electricity Trading Market Forecast and Regional Outlook:
Market Size & Growth Projections:
- 2025 Market Size: USD 95.1 billion
- 2026 Market Size: USD 101.6 billion
- Projected Market Size: USD 173.3 billion by 2035
- Growth Forecasts: 6.9% CAGR (2026-2035)
Key Regional Dynamics:
- Largest Region: Europe (32.4% Share by 2035)
- Fastest Growing Region: Asia Pacific
- Dominating Countries: United States, China, Germany, United Kingdom, Japan
- Emerging Countries: India, South Korea, Brazil, Saudi Arabia, Australia
Last updated on : 1 December, 2025
Electricity Trading Market - Growth Drivers and Challenges
Growth Drivers
- Integration of renewable energy: An increase in the deployment of intermittent wind and solar power is considered the single greatest driver for the electricity trading market globally. Their variability has created continuous imbalances in supply and demand, which has hugely increased volatility and volume in short-term economies. According to a data report published by the IEA Organization in 2025, solar photovoltaic (PV) generation has readily increased by 320 TWh, which denotes a 25% rise from 2023, and has readily reached more than 1,600 TWh. Likewise, the wind electricity generation has surged by 216 TWh, which is 10%, and reached over 2,330 TWh as of 2023. Besides, there has been a rise in investments for solar PV by 30%, surpassing USD 480 billion. Meanwhile, in the case of wind, investments reached almost USD 180 billion as of 2023, thereby suitable for boosting the market’s exposure.
Renewable Electricity Generation by Solar and Wind Comparison (2024-2030)
|
Years |
Solar PV |
Wind |
|
2024 |
6.8% |
8.2% |
|
2025 |
8.3% |
9.2% |
|
2026 |
9.8% |
9.9% |
|
2027 |
11.4% |
10.7% |
|
2028 |
12.9% |
11.6% |
|
2029 |
14.5% |
12.5% |
|
2030 |
16.1% |
13.4% |
Source: IEA Organization
- Increased demand for electrification: The massive electrification of electric vehicles, industrial processes, and heating has created flexible and new electricity sources demand. This eventually requires proactive management, which is deliberately uplifting the electricity trading market internationally. As stated in a data report published by the IEA Organization in 2025, there has been an upsurge in the demand for electricity by 4.3% as of 2024, a rise from 2.5% in 2023. Besides, the average pace of electricity requirement has also grown by 2.7% in the same year, which further denotes twice the rate of the overall energy upliftment. Therefore, based on this growth, electrification has readily been integrated by different sectors, which has further raised the electricity demand in the majority of economies.
- Liberalization in the market: The aspect of emerging economies in Latin America and Asia has progressed and restructured their power industries. This has resulted in developing high-growth and new opportunities for the electricity trading market by attracting international players. As stated in an article published by Energy Policy in January 2025, the energy industry liberalization in Germany is aligned with policy interventions that transformed the energy landscape by increasing the renewables share in gross electricity consumption from 6.3% to 54.4% as of 2024. Besides, as per the April 2025 EMBER Energy Organization article, the worldwide electricity share accounts for 40.9% from low-carbon sources in 2024. Additionally, the solar generation growth rate also exceeded more than 29%, thus making it suitable for the market’s upliftment.
Challenges
- Policy uncertainty and regulatory fragmentation: The greatest challenge for the electricity trading market is navigating a fragmented, frequently volatile, and complicated regulatory landscape. Unlike internationally standardized commodity markets, the aspect of electricity trading is readily governed by regional and national rules governing subsidy schemes, carbon pricing, grid codes, and market accessibility. This particular fragmentation has created significant operational inefficiencies and restricted cross-border arbitrage opportunities. Moreover, unpredictable and sudden transitions in energy policy, including uncertainty, have deterred long-lasting investments and increased the capital expense for overall participants, thus leading to a negative impact on the overall electricity trading market internationally.
- Infrastructure deficits and physical grid constraints: The physical facility of the power grid, especially in the case of transmission lines, has been unable to keep pace with the modified nature of electricity flow and generation. This has created a fundamental physical roadblock for the electricity trading market. The energy transition is gradually shifting generation from central fossil-fuel-based plants to frequently and remotely located renewable centers. This, in turn, has led to persistent grid congestion, wherein power is unable to flow from surplus areas to high-demand locations. Besides, for traders, congestion has split the market into small and less liquid zones with effective price differentiation, thereby making it challenging to execute a unified and single strategy.
Electricity Trading Market Size and Forecast:
| Report Attribute | Details |
|---|---|
|
Base Year |
2025 |
|
Forecast Period |
2026-2035 |
|
CAGR |
6.9% |
|
Base Year Market Size (2025) |
USD 95.1 billion |
|
Forecast Year Market Size (2035) |
USD 173.3 billion |
|
Regional Scope |
|
Electricity Trading Market Segmentation:
Product Type Segment Analysis
The physical trading segment, part of the product type, is anticipated to hold the largest share of 70.8% in the electricity trading market by the end of 2035. The segment’s growth is highly propelled by its importance for ensuring grid reliability, implementing renewable energy, and balancing supply and demand by permitting regions with surplus to commercialize to nations with a deficit. According to an article published by the World Trade Organization in November 2024, the aspect of trading renewable electricity across different nations can diminish the total expense of net-zero energy transmission by almost USD 3 trillion. Besides, there has been growth in the international electricity trade by USD 99.8 billion, thus denoting a 64% surge. Moreover, the global electricity trade, in terms of gross imports, was 2.8% of the 809 TWh, thus making it suitable for the segment’s growth.
Distribution Channel Segment Analysis
The exchange-based trading sub-segment, which is part of the distribution channel segment, is projected to account for the second-largest share in the electricity trading market during the forecast period. The market’s growth is highly driven by offering immediate liquidity, essential mitigation of counterparty credit risk, and price transparency through a centralized clearinghouse. This particular sub-segment is presently witnessing massive growth, which is propelled by the energy transition’s inherent volatility. Besides, the fluctuating nature of renewable generation has necessitated continuous rebalancing and generously funneling huge volumes into balancing markets. Furthermore, participants from agile traders to corporates, market liberalization is mandated to be utilized for exchanges, pertaining to risk management advantages.
End user Segment Analysis
The industrial and commercial segment in the electricity trading market is predicted to garner the third-largest share by the end of the stipulated timeline. The segment’s development is extremely fueled by the imperative approach to effectively manage energy expenses that cater to volatile and major operational spending. This is readily compounded by intensified pressure from supply chain requirements and corporate sustainability mandates to decarbonize, as well as make long-lasting Power Purchase Agreements for renewable energy a dominant strategic initiative. Moreover, by directly contracting for green energy, large-scale organizations are significantly investing in the newest renewable generation and emerging as standard players in the electricity trading market, which in turn is boosting the segment’s exposure.
Our in-depth analysis of the electricity trading market includes the following segments:
|
Segment |
Subsegments |
|
Product Type |
|
|
Distribution Channel |
|
|
End user |
|
|
Power Source |
|
|
Pricing Type |
|
|
Type |
|

Vishnu Nair
Head - Global Business DevelopmentCustomize this report to your requirements — connect with our consultant for personalized insights and options.
Electricity Trading Market - Regional Analysis
Europe Market Insights
Europe in the electricity trading market is forecasted to garner the largest share of 32.4% by the end of 2035. The market’s upliftment in the region is highly attributed to the presence of the ambitious decarbonization agenda, as well as the Europe Green Deal. Besides, escalation in the carbon pricing under the regional Emissions Trading System (EU ETS) and the phase-out of fossil-fuel generation for increasing dependency on intermittent renewables are also driving the electricity trading market. According to an article published by Energy in May 2025, the Corporate Power Purchase Agreement (CPPA) contract capacity has reached 44.7 GW by the end of 2024. However, in 2023, 10.8 GW were readily contracted through PPAs, along with an additional 7.8 GW by the mid of 2024. In addition, 4.3% of the capacity has been contracted by utilities, with the majority gained by private organizations, thereby making it suitable for proliferating the market.
The electricity trading market in Germany growing significantly due to a decisive energy transition policy, its crucial role as the region’s largest power customer, and its centralized geographic position. Moreover, the accelerated retirement of coal-based plants, along with the mandated phase-out of nuclear power, has created a huge generation gap that needs to be filled by imported power and renewables. According to the 2024 Cefic Organization article, the chemical and pharmaceutical sector in the country accounts for €225.5 billion in turnover, with €14 billion in research and development-based investment, 2,094 organizations, 479,542 employees, and capital expenditure of €9.4 billion. This sector is continuously expanding, and is under huge pressure from the regional ETS and high energy, which is suitable for bolstering the market’s exposure.
The UK in the electricity trading market is also growing, owing to the target of emerging as a completely decarbonized power system by the end of 2035. This particular objective demands an unprecedented build-out of renewables and offshore wind, which has inherently increased the demand for a liquid short-term and flexible market to balance their intermittency. As per an article published by the UK Government in April 2025, the industry and government in the country are operating in partnership, and have the objective to invest nearly £40 billion every year for the upcoming 6 years. The focus is to overcome barriers and ensure growth in the electricity demand, which caters to the market’s expansion. As part of this investment, the country will comprise 43 GW to 50 GW of offshore wind, followed by 27 GW to 29 GW of onshore wind, and 45 GW to 47 GW of solar power. This is projected to further comply with 23 GW to 27 GW of battery capacity, along with 4 GW to 6 GW of long-lasting energy storage.
APAC Market Insights
Asia Pacific is predicted to evolve as the fastest-growing region during the forecast timeline in the electricity trading market. The market’s development in the region is highly propelled by huge renewable energy integration, continuous market liberalization, and a surge in the electricity demand from industries, such as chemicals. As stated in a data report published by the IEA Organization in 2025, coal accounts for 57% of the overall electricity generation in the region as of 2023. In addition, the total electricity production in the region caters to 15,489,513 GWh, denoting a 266% increase between 2000 and 2023, and constituting 51% of the global share. Moreover, the electricity consumption in the region is 3.5 MWh per capita as of 2023, displaying a 192% growth between the same duration, thereby creating an optimistic outlook for the overall electricity trading market.
Electricity Production and Consumption Comparison in the Asia Pacific (2023)
|
Countries |
Electricity Production |
Electricity Consumption |
|
|
GWh |
% |
MWh per capita |
|
|
China |
9,547,540 |
61.6 |
6.5 |
|
India |
1,986,776 |
12.8 |
1.1 |
|
Japan |
1,002,648 |
6.5 |
7.6 |
|
Korea |
610,685 |
3.9 |
11.4 |
|
Indonesia |
433,460 |
2.8 |
1.4 |
|
Australia |
274,474 |
1.8 |
9.8 |
|
Vietnam |
274,016 |
1.8 |
2.5 |
|
Malaysia |
192,986 |
1.2 |
5.0 |
Source: IEA Organization
China in the electricity trading market is gaining increasing traction, owing to the scale of the power system, along with the state-directed transition to a market-based and low-carbon grid. Additionally, the National Energy Administration (NEA) and the National Development and Reform Commission (NDRC) have methodically extended pilot markets and established a national unified electricity market. As per the September 2025 ITA data report, the country is rapidly making expansion in renewable energy capacity by installing 373.6 GW as of 2023, particularly in wind and solar. This has readily brought the nation’s overall renewable energy capacity to 1,827.3 GW, which has successfully exceeded the 1,200 GW target of installed solar and wind by the end of 2030. Besides, the pumped hydro storage significantly accounts for deployed energy storage, which has reached 58.9 million kW by the end of 2024, thus deliberately boosting the market’s growth.
India in the electricity trading market is also developing due to the potent combination of rapid renewable energy deployment, advanced market liberalization, and a surge in electricity demand. As mentioned in a data report published by the Ministry of Power in September 2023, the country’s government has targeted to establish 50% of cumulative electric power installed capacity from non-fossil fuel energy resources by the end of 2030. In this regard, transmission schemes for integrating 66.5GW renewable generation in states such as Tamil Nadu, Andhra Pradesh, Karnataka, Madhya Pradesh, Maharashtra, Gujarat, and Rajasthan have been significantly planned and are currently under implementation stages. Furthermore, nearly 55.08 GW of renewable potential has been recognized in Ladakh, Himachal Pradesh, Gujarat, and Rajasthan, based on which the transmission system planning has been successfully carried out.
North America Market Insights
North America market is projected to witness steady and considerable growth by the end of the stipulated period. The market’s exposure in the region is highly driven by the presence of independent system operators (ISOs), such as ERCOT and PJM, which are characterized by sophisticated and highly liquid financial products. In addition, the escalated energy transition, fueled by the federal policy and the Inflation Reduction Act (IRA) is catalyzing huge investments in grid modernization and renewable generation are driving the market. As per an article published by the EIA Government in November 2025, the retail price for nominal-grade gasoline amounted to USD 3.06 per gallon, denoting only 2 cents per gallon higher than the previous year. Additionally, the price usually ranged between USD 3.05 to USD 3.06 per gallon within the same timeline, demonstrating an increase of 0.017 from last year. Likewise, an increase in diesel fuel pricing also denotes a huge growth of the overall market in the region.
Gasoline and Diesel Fuel Payment Update in America (2025)
|
Components |
Regular Gasoline |
Diesel |
|
Overall Price |
USD 3.06 per gallon |
USD 3.68 per gallon |
|
Crude Oil |
49% |
41% |
|
Refining |
14% |
23% |
|
Distribution and Marketing |
21% |
20% |
|
Tax |
17% |
16% |
Source: EIA Government
The electricity trading market in the U.S. is gaining increased exposure due to the existence of an intense chemical industry, the Department of Energy (DOE) Loan Programs Office, and the increased focus on sustainability and innovative manufacturing. For instance, in March 2024, the U.S. Environmental Protection Agency (EPA) successfully identified 103 manufacturing plants that readily earned the Agency’s ENERGY STAR certification in 2023. This is considered a designation, which is reserved for manufacturing facilities with 25% of energy efficiency in this sector. These facilities have the capability to combat over 8 million metric tons of carbon dioxide emissions, which is equivalent to electricity emissions from more than 1.5 million households. Besides, the industrial sector in the country accounts for 30% of greenhouse gas emissions, usually from energy utilization in manufacturing plants, thus suitable for boosting the market.
The electricity trading market in Canada is also growing, owing to the federal carbon price, the Clean Electricity Regulations (CER), interprovincial transmission build-out, grid modernization, an increase in the corporate demand for renewable energy, electrification of the economy, and Hydro-Québec’s role as a continental battery. According to an article published by the Transportation Research Interdisciplinary Perspectives in November 2024, the country’s government unveiled a CAD 15 per ton of carbon dioxide equivalent greenhouse gas emissions fee between 2023 and 2030. Besides, the livestock and agriculture production industry, excluding emissions from fertilizer manufacturing or fossil fuel utilization, contributes to 10% of the nation’s greenhouse gas emissions. Therefore, to keep control, the country performs competitive evaluation by catering to 80% of emissions from medium or low risk, along with 90% of 95% for high risk, thus making it suitable for the market’s upliftment.
Key Electricity Trading Market Players:
- Vitol Group (Switzerland)
- Company Overview
- Business Strategy
- Key Product Offerings
- Financial Performance
- Key Performance Indicators
- Risk Analysis
- Recent Development
- Regional Presence
- SWOT Analysis
- Glencore plc (Switzerland)
- Trafigura Group Pte. Ltd. (Singapore)
- Gunvor Group (Switzerland)
- Mercuria Energy Group (Switzerland)
- Koch Supply & Trading (U.S.)
- BP plc (U.K.)
- Shell plc (U.K.)
- TotalEnergies SE (France)
- Uniper SE (Germany)
- Vattenfall AB (Sweden)
- Statkraft AS (Norway)
- Ørsted A/S (Denmark)
- EDF (France)
- Engie (France)
- Mitsubishi Corporation (Japan)
- Mitsui & Co., Ltd. (Japan)
- Macquarie Group (Australia)
- Posco International (South Korea)
- JERA Co., Inc. (Japan)
- Vitol Group is considered one of the world’s largest independent energy traders that tend to manage huge volumes of refined products, crude oil, along with power and LNG. The organization’s logistical expertise and scale offer essential liquidity to international markets and allow it to leverage complicated physical supply chains. Therefore, as stated in its 2024 annual report, the organization generated USD 331 billion as turnover, 537 TOE delivery, as well as 7.2 mbpd of crude oil and products, 8GW gross generation capacity, 850kbpd refining capacity, and c10,000 service stations.
- Glencore plc is the dominating and unique player with a suitable benefit through its ownership of the massive portfolio of oil and mining production assets. This particular vertical integration permits the company to supply commodities from its sources, offering supply chain control and unparalleled market intelligence.
- Trafigura Group Pte. Ltd. is recognized as a notable commodity trading conglomerate, well-known for its robust focus and entrepreneurial culture on oil and metals. The organization has positioned itself as the pioneer in developing infrastructure and securing finances to create a new source of supply to the market. Therefore, as per its 2024 annual report, the organization generated USD 243.2 billion in group revenue, USD 8.1 billion in underlying EBITDA, USD 2.8 billion as net profit, USD 16.3 billion as total group equity, along with USD 76.4 billion in total assets.
- Gunvor Group is one of the traders of refined petroleum products, LNG, and crude oil, with an aggressive focus on terminal facilities and seaborne transportation. The firm has tactically developed its reputation on its risk management and operational excellence in Europe and the international energy complex.
- Mercuria Energy Group has significantly developed into a top-tier commodities and global energy trader with a robust focus on digitalization and technology. The organization is also considered a significant investor in the energy transition, which has channelized capital into decarbonization and renewable power technologies.
Here is a list of key players operating in the global electricity trading market:
The worldwide electricity trading market is significantly competitive, and is dominated by North America and Europe-based integrated energy majors and commodity traders. The landscape is further characterized by a tactical arms race in analytics and digitalization, with leaders readily investing in machine learning and artificial intelligence to improve forecast volatile renewable generation and trading algorithms. Moreover, a notable strategy is the vertical integration into battery storage and renewable energy assets, permitting organizations to capitalize on arbitrage and control physical supply. Besides, in February 2025, Uniper generated €2,612 million in EBITDA through green transformation implementation, which initiated standard progress. In addition, the organization also recorded yearly earnings amounting to €7,164 million, owing to hedging transactions, especially for coal and gas-fired power generation, along with the midstream gas business, which is contributing to the electricity trading market’s growth.
Corporate Landscape of the Electricity Trading Market:
Recent Developments
- In October 2024, bp successfully acquired the 50.0% interest of Lightsource bp, with the intention of making expansion for its presence across different nations, particularly in the onshore renewable energy sector, with operations spanning 19 economies and a 62GW development pipeline.
- In June 2024, Hitachi Energy announced its investment of USD 4.5 billion in partnerships, research and development, digital, engineering, and manufacturing by the end of 2027, through which consumers’ commitments and market demand will be catered to by developing capacity for high-voltage products and transformers.
- Report ID: 2977
- Published Date: Dec 01, 2025
- Report Format: PDF, PPT
- Explore a preview of key market trends and insights
- Review sample data tables and segment breakdowns
- Experience the quality of our visual data representations
- Evaluate our report structure and research methodology
- Get a glimpse of competitive landscape analysis
- Understand how regional forecasts are presented
- Assess the depth of company profiling and benchmarking
- Preview how actionable insights can support your strategy
Explore real data and analysis
Frequently Asked Questions (FAQ)
Electricity Trading Market Report Scope
Free Sample includes current and historical market size, growth trends, regional charts & tables, company profiles, segment-wise forecasts, and more.
Connect with our Expert


Copyright @ 2026 Research Nester. All Rights Reserved.
