Global Electrical Insulation Materials Market
1. An Outline of the Global Electrical Insulation Materials Market
1.1. Market Definition and Segmentation
1.2. Study Assumptions and Abbreviations
2. Research Methodology & Approach
2.1. Primary Research
2.2. Secondary Research
2.3. Data Triangulation
2.4. SPSS Methodology
3. Executive Summary
4. Growth Drivers
5. Major Roadblocks
6. Opportunities
7. Prevalent Trends
8. Government Regulation
9. Growth Outlook
10. Competitive White Space Analysis – Identifying Untapped Market Gaps
11. Risk Overview
12. SWOT
13. Technological Advancement
14. Technology Maturity Matrix for the Electrical Insulation Materials Market: Recent News
15. Regional Demand
16. Global Electrical Insulation Materials by Geography – Strategic Comparative Analysis
17. Strategic Segment Analysis: Electrical Insulation Materials Demand Landscape
18. Electrical Insulation Materials Demand Trends Driven by rising investments in office buildings, airports, shopping malls, hotels, hospitals, warehouses, and educational facilities worldwide, the need for professional cleaning equipment to maintain large commercial spaces is increasing. (2027-2037)
19. Root Cause Analysis (RCA) for discovering problems of the Electrical Insulation Materials Market
20. Porter Five Forces
21. PESTLE
22. Comparative Positioning
23. Global Electrical Insulation Materials – Key Player Analysis (2037)
24. Competitive Landscape: Key Suppliers/Players
25. Competitive Model: A Detailed Inside View for Investors
26. Company Market Share, 2037 (%)
26.1. BASF SE
26.2. Celanese Corporation
26.3. ELANTAS (ALTANA Group)
26.4. Huntsman International LLC
26.5. Mitsubishi Chemical Group Corporation
26.6. Olin Corporation
26.7. SABIC
26.8. Solvay
26.9. Sumitomo Bakelite Co., Ltd.
26.10. Wacker Chemie AG
27. Global Electrical Insulation Materials Market Outlook
27.1. Market Overview
27.1.1. Market Revenue by Value (USD Million), by Volume (Tons), and Compound Annual Growth Rate (CAGR)
27.2. Electrical Insulation Materials Market Segmentation Analysis (2027-2037)
27.2.1. By Material Type
27.2.1.1. Thermoset Insulation Materials, Market Value (USD Million), and CAGR, 2027-2037F
27.2.1.1.1. Epoxy Resins, Market Value (USD Million), and CAGR, 2027-2037F
27.2.1.1.2. Phenolic Resins, Market Value (USD Million), and CAGR, 2027-2037F
27.2.1.1.3. Unsaturated Polyester Resins, Market Value (USD Million), and CAGR, 2027-2037F
27.2.1.1.4. Polyurethane Resins, Market Value (USD Million), and CAGR, 2027-2037F
27.2.1.1.5. Silicone Resins, Market Value (USD Million), and CAGR, 2027-2037F
27.2.1.1.6. Melamine Resins, Market Value (USD Million), and CAGR, 2027-2037F
27.2.1.1.7. Others, Market Value (USD Million), and CAGR, 2027-2037F
27.2.1.2. Thermoplastic Insulation Materials, Market Value (USD Million), and CAGR, 2027-2037F
27.2.1.2.1. Polyamide (PA6, PA66), Market Value (USD Million), and CAGR, 2027-2037F
27.2.1.2.2. Polybutylene Terephthalate (PBT), Market Value (USD Million), and CAGR, 2027-2037F
27.2.1.2.3. Polyethylene Terephthalate (PET), Market Value (USD Million), and CAGR, 2027-2037F
27.2.1.2.4. Polyphenylene Sulfide (PPS), Market Value (USD Million), and CAGR, 2027-2037F
27.2.1.2.5. Polyether Ether Ketone (PEEK), Market Value (USD Million), and CAGR, 2027-2037F
27.2.1.2.6. Polyetherimide (PEI), Market Value (USD Million), and CAGR, 2027-2037F
27.2.1.2.7. Polycarbonate (PC), Market Value (USD Million), and CAGR, 2027-2037F
27.2.1.2.8. Polyethylene (PE), Market Value (USD Million), and CAGR, 2027-2037F
27.2.1.2.9. Liquid Crystal Polymer (LCP), Market Value (USD Million), and CAGR, 2027-2037F
27.2.1.2.10. Polyvinyl Chloride (PVC), Market Value (USD Million), and CAGR, 2027-2037F
27.2.1.2.11. Others, Market Value (USD Million), and CAGR, 2027-2037F
27.2.1.3. Others, Market Value (USD Million), and CAGR, 2027-2037F
27.2.2. By Application
27.2.2.1. Electrical Equipment, Market Value (USD Million), and CAGR, 2027-2037F
27.2.2.1.1. Transformers, Market Value (USD Million), and CAGR, 2027-2037F
27.2.2.1.2. Switchgear, Market Value (USD Million), and CAGR, 2027-2037F
27.2.2.1.3. Circuit Breakers, Market Value (USD Million), and CAGR, 2027-2037F
27.2.2.1.4. Others, Market Value (USD Million), and CAGR, 2027-2037F
27.2.2.2. Rotating Equipment, Market Value (USD Million), and CAGR, 2027-2037F
27.2.2.2.1. Electric Motors, Market Value (USD Million), and CAGR, 2027-2037F
27.2.2.2.2. Generators, Market Value (USD Million), and CAGR, 2027-2037F
27.2.2.2.3. Others, Market Value (USD Million), and CAGR, 2027-2037F
27.2.2.3. Electronic Components, Market Value (USD Million), and CAGR, 2027-2037F
27.2.2.3.1. Sensors, Market Value (USD Million), and CAGR, 2027-2037F
27.2.2.3.2. Ignition Coils, Market Value (USD Million), and CAGR, 2027-2037F
27.2.2.3.3. Others, Market Value (USD Million), and CAGR, 2027-2037F
27.2.2.4. Wire & Cable, Market Value (USD Million), and CAGR, 2027-2037F
27.2.2.4.1. Power Cables, Market Value (USD Million), and CAGR, 2027-2037F
27.2.2.4.2. Magnet Wires, Market Value (USD Million), and CAGR, 2027-2037F
27.2.2.4.3. Others, Market Value (USD Million), and CAGR, 2027-2037F
27.2.2.5. Battery & Energy Storage Systems, Market Value (USD Million), and CAGR, 2027-2037F
27.2.2.5.1. Battery Packs, Market Value (USD Million), and CAGR, 2027-2037F
27.2.2.5.2. Others, Market Value (USD Million), and CAGR, 2027-2037F
27.2.2.6. Power Electronics, Market Value (USD Million), and CAGR, 2027-2037F
27.2.2.6.1. Inverters, Market Value (USD Million), and CAGR, 2027-2037F
27.2.2.6.2. Converters, Market Value (USD Million), and CAGR, 2027-2037F
27.2.2.6.3. Others, Market Value (USD Million), and CAGR, 2027-2037F
27.2.3. By End use Industry
27.2.3.1. Automotive, Market Value (USD Million), and CAGR, 2027-2037F
27.2.3.2. Consumer Electronics, Market Value (USD Million), and CAGR, 2027-2037F
27.2.3.3. Aerospace and Defense, Market Value (USD Million), and CAGR, 2027-2037F
27.2.3.4. Industrial, Market Value (USD Million), and CAGR, 2027-2037F
27.2.3.5. Energy and Utility, Market Value (USD Million), and CAGR, 2027-2037F
27.2.3.6. Others, Market Value (USD Million), and CAGR, 2027-2037F
27.2.4. By Voltage
27.2.4.1. Up to 1 kV, Market Value (USD Million), and CAGR, 2027-2037F
27.2.4.2. 1–35 kV, Market Value (USD Million), and CAGR, 2027-2037F
27.2.4.3. 35–230 kV, Market Value (USD Million), and CAGR, 2027-2037F
27.2.4.4. Above 230 kV, Market Value (USD Million), and CAGR, 2027-2037F
27.2.5. Regional Synopsis, Value (USD Million), 2027-2037
27.2.5.1. North America Market Value (USD Million) and CAGR & Y-o-Y Growth Trend, 2027-2037F
27.2.5.2. Europe Market Value (USD Million) and CAGR & Y-o-Y Growth Trend, 2027-2037F
27.2.5.3. Asia Pacific Market Value (USD Million) and CAGR & Y-o-Y Growth Trend, 2027-2037F
27.2.5.4. Latin America Market Value (USD Million) and CAGR & Y-o-Y Growth Trend, 2027-2037F
27.2.5.5. Middle East and Africa Market Value (USD Million) and CAGR & Y-o-Y Growth Trend, 2027-2037F
28. North America Market
28.1. Overview
28.1.1. Market Value (USD Million), Current and Future Projections, 2027-2037
28.1.2. Increment $ Opportunity Assessment, 2027-2037
28.2. Segmentation (USD Million), 2027-2037, By
28.2.1. By Material Type
28.2.1.1. Thermoset Insulation Materials, Market Value (USD Million), and CAGR, 2027-2037F
28.2.1.1.1. Epoxy Resins, Market Value (USD Million), and CAGR, 2027-2037F
28.2.1.1.2. Phenolic Resins, Market Value (USD Million), and CAGR, 2027-2037F
28.2.1.1.3. Unsaturated Polyester Resins, Market Value (USD Million), and CAGR, 2027-2037F
28.2.1.1.4. Polyurethane Resins, Market Value (USD Million), and CAGR, 2027-2037F
28.2.1.1.5. Silicone Resins, Market Value (USD Million), and CAGR, 2027-2037F
28.2.1.1.6. Melamine Resins, Market Value (USD Million), and CAGR, 2027-2037F
28.2.1.1.7. Others, Market Value (USD Million), and CAGR, 2027-2037F
28.2.1.2. Thermoplastic Insulation Materials, Market Value (USD Million), and CAGR, 2027-2037F
28.2.1.2.1. Polyamide (PA6, PA66), Market Value (USD Million), and CAGR, 2027-2037F
28.2.1.2.2. Polybutylene Terephthalate (PBT), Market Value (USD Million), and CAGR, 2027-2037F
28.2.1.2.3. Polyethylene Terephthalate (PET), Market Value (USD Million), and CAGR, 2027-2037F
28.2.1.2.4. Polyphenylene Sulfide (PPS), Market Value (USD Million), and CAGR, 2027-2037F
28.2.1.2.5. Polyether Ether Ketone (PEEK), Market Value (USD Million), and CAGR, 2027-2037F
28.2.1.2.6. Polyetherimide (PEI), Market Value (USD Million), and CAGR, 2027-2037F
28.2.1.2.7. Polycarbonate (PC), Market Value (USD Million), and CAGR, 2027-2037F
28.2.1.2.8. Polyethylene (PE), Market Value (USD Million), and CAGR, 2027-2037F
28.2.1.2.9. Liquid Crystal Polymer (LCP), Market Value (USD Million), and CAGR, 2027-2037F
28.2.1.2.10. Polyvinyl Chloride (PVC), Market Value (USD Million), and CAGR, 2027-2037F
28.2.1.2.11. Others, Market Value (USD Million), and CAGR, 2027-2037F
28.2.1.3. Others, Market Value (USD Million), and CAGR, 2027-2037F
28.2.2. By Application
28.2.2.1. Electrical Equipment, Market Value (USD Million), and CAGR, 2027-2037F
28.2.2.1.1. Transformers, Market Value (USD Million), and CAGR, 2027-2037F
28.2.2.1.2. Switchgear, Market Value (USD Million), and CAGR, 2027-2037F
28.2.2.1.3. Circuit Breakers, Market Value (USD Million), and CAGR, 2027-2037F
28.2.2.1.4. Others, Market Value (USD Million), and CAGR, 2027-2037F
28.2.2.2. Rotating Equipment, Market Value (USD Million), and CAGR, 2027-2037F
28.2.2.2.1. Electric Motors, Market Value (USD Million), and CAGR, 2027-2037F
28.2.2.2.2. Generators, Market Value (USD Million), and CAGR, 2027-2037F
28.2.2.2.3. Others, Market Value (USD Million), and CAGR, 2027-2037F
28.2.2.3. Electronic Components, Market Value (USD Million), and CAGR, 2027-2037F
28.2.2.3.1. Sensors, Market Value (USD Million), and CAGR, 2027-2037F
28.2.2.3.2. Ignition Coils, Market Value (USD Million), and CAGR, 2027-2037F
28.2.2.3.3. Others, Market Value (USD Million), and CAGR, 2027-2037F
28.2.2.4. Wire & Cable, Market Value (USD Million), and CAGR, 2027-2037F
28.2.2.4.1. Power Cables, Market Value (USD Million), and CAGR, 2027-2037F
28.2.2.4.2. Magnet Wires, Market Value (USD Million), and CAGR, 2027-2037F
28.2.2.4.3. Others, Market Value (USD Million), and CAGR, 2027-2037F
28.2.2.5. Battery & Energy Storage Systems, Market Value (USD Million), and CAGR, 2027-2037F
28.2.2.5.1. Battery Packs, Market Value (USD Million), and CAGR, 2027-2037F
28.2.2.5.2. Others, Market Value (USD Million), and CAGR, 2027-2037F
28.2.2.6. Power Electronics, Market Value (USD Million), and CAGR, 2027-2037F
28.2.2.6.1. Inverters, Market Value (USD Million), and CAGR, 2027-2037F
28.2.2.6.2. Converters, Market Value (USD Million), and CAGR, 2027-2037F
28.2.2.6.3. Others, Market Value (USD Million), and CAGR, 2027-2037F
28.2.3. By End use Industry
28.2.3.1. Automotive, Market Value (USD Million), and CAGR, 2027-2037F
28.2.3.2. Consumer Electronics, Market Value (USD Million), and CAGR, 2027-2037F
28.2.3.3. Aerospace and Defense, Market Value (USD Million), and CAGR, 2027-2037F
28.2.3.4. Industrial, Market Value (USD Million), and CAGR, 2027-2037F
28.2.3.5. Energy and Utility, Market Value (USD Million), and CAGR, 2027-2037F
28.2.3.6. Others, Market Value (USD Million), and CAGR, 2027-2037F
28.2.4. By Voltage
28.2.4.1. Up to 1 kV, Market Value (USD Million), and CAGR, 2027-2037F
28.2.4.2. 1–35 kV, Market Value (USD Million), and CAGR, 2027-2037F
28.2.4.3. 35–230 kV, Market Value (USD Million), and CAGR, 2027-2037F
28.2.4.4. Above 230 kV, Market Value (USD Million), and CAGR, 2027-2037F
28.2.5. Country Level Analysis, Value (USD Million)
28.2.5.1. U.S. Market Value (USD Million) and CAGR & Y-o-Y Growth Trend, 2027-2037F
28.2.5.2. Canada Market Value (USD Million) and CAGR & Y-o-Y Growth Trend, 2027-2037F
29. Europe Market
29.1. Overview
29.1.1. Market Value (USD Million), Current and Future Projections, 2027-2037
29.1.2. Increment $ Opportunity Assessment, 2027-2037
29.2. Segmentation (USD Million), 2027-2037, By
29.2.1. By Material Type
29.2.1.1. Thermoset Insulation Materials, Market Value (USD Million), and CAGR, 2027-2037F
29.2.1.1.1. Epoxy Resins, Market Value (USD Million), and CAGR, 2027-2037F
29.2.1.1.2. Phenolic Resins, Market Value (USD Million), and CAGR, 2027-2037F
29.2.1.1.3. Unsaturated Polyester Resins, Market Value (USD Million), and CAGR, 2027-2037F
29.2.1.1.4. Polyurethane Resins, Market Value (USD Million), and CAGR, 2027-2037F
29.2.1.1.5. Silicone Resins, Market Value (USD Million), and CAGR, 2027-2037F
29.2.1.1.6. Melamine Resins, Market Value (USD Million), and CAGR, 2027-2037F
29.2.1.1.7. Others, Market Value (USD Million), and CAGR, 2027-2037F
29.2.1.2. Thermoplastic Insulation Materials, Market Value (USD Million), and CAGR, 2027-2037F
29.2.1.2.1. Polyamide (PA6, PA66), Market Value (USD Million), and CAGR, 2027-2037F
29.2.1.2.2. Polybutylene Terephthalate (PBT), Market Value (USD Million), and CAGR, 2027-2037F
29.2.1.2.3. Polyethylene Terephthalate (PET), Market Value (USD Million), and CAGR, 2027-2037F
29.2.1.2.4. Polyphenylene Sulfide (PPS), Market Value (USD Million), and CAGR, 2027-2037F
29.2.1.2.5. Polyether Ether Ketone (PEEK), Market Value (USD Million), and CAGR, 2027-2037F
29.2.1.2.6. Polyetherimide (PEI), Market Value (USD Million), and CAGR, 2027-2037F
29.2.1.2.7. Polycarbonate (PC), Market Value (USD Million), and CAGR, 2027-2037F
29.2.1.2.8. Polyethylene (PE), Market Value (USD Million), and CAGR, 2027-2037F
29.2.1.2.9. Liquid Crystal Polymer (LCP), Market Value (USD Million), and CAGR, 2027-2037F
29.2.1.2.10. Polyvinyl Chloride (PVC), Market Value (USD Million), and CAGR, 2027-2037F
29.2.1.2.11. Others, Market Value (USD Million), and CAGR, 2027-2037F
29.2.1.3. Others, Market Value (USD Million), and CAGR, 2027-2037F
29.2.2. By Application
29.2.2.1. Electrical Equipment, Market Value (USD Million), and CAGR, 2027-2037F
29.2.2.1.1. Transformers, Market Value (USD Million), and CAGR, 2027-2037F
29.2.2.1.2. Switchgear, Market Value (USD Million), and CAGR, 2027-2037F
29.2.2.1.3. Circuit Breakers, Market Value (USD Million), and CAGR, 2027-2037F
29.2.2.1.4. Others, Market Value (USD Million), and CAGR, 2027-2037F
29.2.2.2. Rotating Equipment, Market Value (USD Million), and CAGR, 2027-2037F
29.2.2.2.1. Electric Motors, Market Value (USD Million), and CAGR, 2027-2037F
29.2.2.2.2. Generators, Market Value (USD Million), and CAGR, 2027-2037F
29.2.2.2.3. Others, Market Value (USD Million), and CAGR, 2027-2037F
29.2.2.3. Electronic Components, Market Value (USD Million), and CAGR, 2027-2037F
29.2.2.3.1. Sensors, Market Value (USD Million), and CAGR, 2027-2037F
29.2.2.3.2. Ignition Coils, Market Value (USD Million), and CAGR, 2027-2037F
29.2.2.3.3. Others, Market Value (USD Million), and CAGR, 2027-2037F
29.2.2.4. Wire & Cable, Market Value (USD Million), and CAGR, 2027-2037F
29.2.2.4.1. Power Cables, Market Value (USD Million), and CAGR, 2027-2037F
29.2.2.4.2. Magnet Wires, Market Value (USD Million), and CAGR, 2027-2037F
29.2.2.4.3. Others, Market Value (USD Million), and CAGR, 2027-2037F
29.2.2.5. Battery & Energy Storage Systems, Market Value (USD Million), and CAGR, 2027-2037F
29.2.2.5.1. Battery Packs, Market Value (USD Million), and CAGR, 2027-2037F
29.2.2.5.2. Others, Market Value (USD Million), and CAGR, 2027-2037F
29.2.2.6. Power Electronics, Market Value (USD Million), and CAGR, 2027-2037F
29.2.2.6.1. Inverters, Market Value (USD Million), and CAGR, 2027-2037F
29.2.2.6.2. Converters, Market Value (USD Million), and CAGR, 2027-2037F
29.2.2.6.3. Others, Market Value (USD Million), and CAGR, 2027-2037F
29.2.3. By End use Industry
29.2.3.1. Automotive, Market Value (USD Million), and CAGR, 2027-2037F
29.2.3.2. Consumer Electronics, Market Value (USD Million), and CAGR, 2027-2037F
29.2.3.3. Aerospace and Defense, Market Value (USD Million), and CAGR, 2027-2037F
29.2.3.4. Industrial, Market Value (USD Million), and CAGR, 2027-2037F
29.2.3.5. Energy and Utility, Market Value (USD Million), and CAGR, 2027-2037F
29.2.3.6. Others, Market Value (USD Million), and CAGR, 2027-2037F
29.2.4. By Voltage
29.2.4.1. Up to 1 kV, Market Value (USD Million), and CAGR, 2027-2037F
29.2.4.2. 1–35 kV, Market Value (USD Million), and CAGR, 2027-2037F
29.2.4.3. 35–230 kV, Market Value (USD Million), and CAGR, 2027-2037F
29.2.4.4. Above 230 kV, Market Value (USD Million), and CAGR, 2027-2037F
29.2.5. Country Level Analysis, Value (USD Million)
29.2.5.1. UK Market Value (USD Million) and CAGR & Y-o-Y Growth Trend, 2027-2037F
29.2.5.2. Germany Market Value (USD Million) and CAGR & Y-o-Y Growth Trend, 2027-2037F
29.2.5.3. France Market Value (USD Million) and CAGR & Y-o-Y Growth Trend, 2027-2037F
29.2.5.4. Italy Market Value (USD Million) and CAGR & Y-o-Y Growth Trend, 2027-2037F
29.2.5.5. Spain Market Value (USD Million) and CAGR & Y-o-Y Growth Trend, 2027-2037F
29.2.5.6. Netherlands Market Value (USD Million) and CAGR & Y-o-Y Growth Trend, 2027-2037F
29.2.5.7. Russia Market Value (USD Million) and CAGR & Y-o-Y Growth Trend, 2027-2037F
29.2.5.8. Switzerland Market Value (USD Million) and CAGR & Y-o-Y Growth Trend, 2027-2037F
29.2.5.9. Poland Market Value (USD Million) and CAGR & Y-o-Y Growth Trend, 2027-2037F
29.2.5.10. Belgium Market Value (USD Million) and CAGR & Y-o-Y Growth Trend, 2027-2037F
29.2.5.11. Rest of Europe Market Value (USD Million) and CAGR & Y-o-Y Growth Trend, 2027-2037F
30. Asia Pacific Market
30.1. Overview
30.1.1. Market Value (USD Million), Current and Future Projections, 2027-2037
30.1.2. Increment $ Opportunity Assessment, 2027-2037
30.2. Segmentation (USD Million), 2027-2037, By
30.2.1. By Material Type
30.2.1.1. Thermoset Insulation Materials, Market Value (USD Million), and CAGR, 2027-2037F
30.2.1.1.1. Epoxy Resins, Market Value (USD Million), and CAGR, 2027-2037F
30.2.1.1.2. Phenolic Resins, Market Value (USD Million), and CAGR, 2027-2037F
30.2.1.1.3. Unsaturated Polyester Resins, Market Value (USD Million), and CAGR, 2027-2037F
30.2.1.1.4. Polyurethane Resins, Market Value (USD Million), and CAGR, 2027-2037F
30.2.1.1.5. Silicone Resins, Market Value (USD Million), and CAGR, 2027-2037F
30.2.1.1.6. Melamine Resins, Market Value (USD Million), and CAGR, 2027-2037F
30.2.1.1.7. Others, Market Value (USD Million), and CAGR, 2027-2037F
30.2.1.2. Thermoplastic Insulation Materials, Market Value (USD Million), and CAGR, 2027-2037F
30.2.1.2.1. Polyamide (PA6, PA66), Market Value (USD Million), and CAGR, 2027-2037F
30.2.1.2.2. Polybutylene Terephthalate (PBT), Market Value (USD Million), and CAGR, 2027-2037F
30.2.1.2.3. Polyethylene Terephthalate (PET), Market Value (USD Million), and CAGR, 2027-2037F
30.2.1.2.4. Polyphenylene Sulfide (PPS), Market Value (USD Million), and CAGR, 2027-2037F
30.2.1.2.5. Polyether Ether Ketone (PEEK), Market Value (USD Million), and CAGR, 2027-2037F
30.2.1.2.6. Polyetherimide (PEI), Market Value (USD Million), and CAGR, 2027-2037F
30.2.1.2.7. Polycarbonate (PC), Market Value (USD Million), and CAGR, 2027-2037F
30.2.1.2.8. Polyethylene (PE), Market Value (USD Million), and CAGR, 2027-2037F
30.2.1.2.9. Liquid Crystal Polymer (LCP), Market Value (USD Million), and CAGR, 2027-2037F
30.2.1.2.10. Polyvinyl Chloride (PVC), Market Value (USD Million), and CAGR, 2027-2037F
30.2.1.2.11. Others, Market Value (USD Million), and CAGR, 2027-2037F
30.2.1.3. Others, Market Value (USD Million), and CAGR, 2027-2037F
30.2.2. By Application
30.2.2.1. Electrical Equipment, Market Value (USD Million), and CAGR, 2027-2037F
30.2.2.1.1. Transformers, Market Value (USD Million), and CAGR, 2027-2037F
30.2.2.1.2. Switchgear, Market Value (USD Million), and CAGR, 2027-2037F
30.2.2.1.3. Circuit Breakers, Market Value (USD Million), and CAGR, 2027-2037F
30.2.2.1.4. Others, Market Value (USD Million), and CAGR, 2027-2037F
30.2.2.2. Rotating Equipment, Market Value (USD Million), and CAGR, 2027-2037F
30.2.2.2.1. Electric Motors, Market Value (USD Million), and CAGR, 2027-2037F
30.2.2.2.2. Generators, Market Value (USD Million), and CAGR, 2027-2037F
30.2.2.2.3. Others, Market Value (USD Million), and CAGR, 2027-2037F
30.2.2.3. Electronic Components, Market Value (USD Million), and CAGR, 2027-2037F
30.2.2.3.1. Sensors, Market Value (USD Million), and CAGR, 2027-2037F
30.2.2.3.2. Ignition Coils, Market Value (USD Million), and CAGR, 2027-2037F
30.2.2.3.3. Others, Market Value (USD Million), and CAGR, 2027-2037F
30.2.2.4. Wire & Cable, Market Value (USD Million), and CAGR, 2027-2037F
30.2.2.4.1. Power Cables, Market Value (USD Million), and CAGR, 2027-2037F
30.2.2.4.2. Magnet Wires, Market Value (USD Million), and CAGR, 2027-2037F
30.2.2.4.3. Others, Market Value (USD Million), and CAGR, 2027-2037F
30.2.2.5. Battery & Energy Storage Systems, Market Value (USD Million), and CAGR, 2027-2037F
30.2.2.5.1. Battery Packs, Market Value (USD Million), and CAGR, 2027-2037F
30.2.2.5.2. Others, Market Value (USD Million), and CAGR, 2027-2037F
30.2.2.6. Power Electronics, Market Value (USD Million), and CAGR, 2027-2037F
30.2.2.6.1. Inverters, Market Value (USD Million), and CAGR, 2027-2037F
30.2.2.6.2. Converters, Market Value (USD Million), and CAGR, 2027-2037F
30.2.2.6.3. Others, Market Value (USD Million), and CAGR, 2027-2037F
30.2.3. By End use Industry
30.2.3.1. Automotive, Market Value (USD Million), and CAGR, 2027-2037F
30.2.3.2. Consumer Electronics, Market Value (USD Million), and CAGR, 2027-2037F
30.2.3.3. Aerospace and Defense, Market Value (USD Million), and CAGR, 2027-2037F
30.2.3.4. Industrial, Market Value (USD Million), and CAGR, 2027-2037F
30.2.3.5. Energy and Utility, Market Value (USD Million), and CAGR, 2027-2037F
30.2.3.6. Others, Market Value (USD Million), and CAGR, 2027-2037F
30.2.4. By Voltage
30.2.4.1. Up to 1 kV, Market Value (USD Million), and CAGR, 2027-2037F
30.2.4.2. 1–35 kV, Market Value (USD Million), and CAGR, 2027-2037F
30.2.4.3. 35–230 kV, Market Value (USD Million), and CAGR, 2027-2037F
30.2.4.4. Above 230 kV, Market Value (USD Million), and CAGR, 2027-2037F
30.2.5. Country Level Analysis, Value (USD Million)
30.2.5.1. China Market Value (USD Million) and CAGR & Y-o-Y Growth Trend, 2027-2037F
30.2.5.2. Japan Market Value (USD Million) and CAGR & Y-o-Y Growth Trend, 2027-2037F
30.2.5.3. India Market Value (USD Million) and CAGR & Y-o-Y Growth Trend, 2027-2037F
30.2.5.4. South Korea Market Value (USD Million) and CAGR & Y-o-Y Growth Trend, 2027-2037F
30.2.5.5. Australia Market Value (USD Million) and CAGR & Y-o-Y Growth Trend, 2027-2037F
30.2.5.6. Indonesia Market Value (USD Million) and CAGR & Y-o-Y Growth Trend, 2027-2037F
30.2.5.7. Malaysia Market Value (USD Million) and CAGR & Y-o-Y Growth Trend, 2027-2037F
30.2.5.8. Vietnam Market Value (USD Million) and CAGR & Y-o-Y Growth Trend, 2027-2037F
30.2.5.9. Thailand Market Value (USD Million) and CAGR & Y-o-Y Growth Trend, 2027-2037F
30.2.5.10. Singapore Market Value (USD Million) and CAGR & Y-o-Y Growth Trend, 2027-2037F
30.2.5.11. New Zealand Market Value (USD Million) and CAGR & Y-o-Y Growth Trend, 2027-2037F
30.2.5.12. Rest of Asia Pacific Excluding Japan Market Value (USD Million) and CAGR & Y-o-Y Growth Trend, 2027-2037F
31. Latin America Market
31.1. Overview
31.1.1. Market Value (USD Million), Current and Future Projections, 2027-2037
31.1.2. Increment $ Opportunity Assessment, 2027-2037
31.1.3. Year-on-Year Growth Forecast (%)
31.2. Segmentation (USD Million), 2027-2037, By
31.2.1. By Material Type
31.2.1.1. Thermoset Insulation Materials, Market Value (USD Million), and CAGR, 2027-2037F
31.2.1.1.1. Epoxy Resins, Market Value (USD Million), and CAGR, 2027-2037F
31.2.1.1.2. Phenolic Resins, Market Value (USD Million), and CAGR, 2027-2037F
31.2.1.1.3. Unsaturated Polyester Resins, Market Value (USD Million), and CAGR, 2027-2037F
31.2.1.1.4. Polyurethane Resins, Market Value (USD Million), and CAGR, 2027-2037F
31.2.1.1.5. Silicone Resins, Market Value (USD Million), and CAGR, 2027-2037F
31.2.1.1.6. Melamine Resins, Market Value (USD Million), and CAGR, 2027-2037F
31.2.1.1.7. Others, Market Value (USD Million), and CAGR, 2027-2037F
31.2.1.2. Thermoplastic Insulation Materials, Market Value (USD Million), and CAGR, 2027-2037F
31.2.1.2.1. Polyamide (PA6, PA66), Market Value (USD Million), and CAGR, 2027-2037F
31.2.1.2.2. Polybutylene Terephthalate (PBT), Market Value (USD Million), and CAGR, 2027-2037F
31.2.1.2.3. Polyethylene Terephthalate (PET), Market Value (USD Million), and CAGR, 2027-2037F
31.2.1.2.4. Polyphenylene Sulfide (PPS), Market Value (USD Million), and CAGR, 2027-2037F
31.2.1.2.5. Polyether Ether Ketone (PEEK), Market Value (USD Million), and CAGR, 2027-2037F
31.2.1.2.6. Polyetherimide (PEI), Market Value (USD Million), and CAGR, 2027-2037F
31.2.1.2.7. Polycarbonate (PC), Market Value (USD Million), and CAGR, 2027-2037F
31.2.1.2.8. Polyethylene (PE), Market Value (USD Million), and CAGR, 2027-2037F
31.2.1.2.9. Liquid Crystal Polymer (LCP), Market Value (USD Million), and CAGR, 2027-2037F
31.2.1.2.10. Polyvinyl Chloride (PVC), Market Value (USD Million), and CAGR, 2027-2037F
31.2.1.2.11. Others, Market Value (USD Million), and CAGR, 2027-2037F
31.2.1.3. Others, Market Value (USD Million), and CAGR, 2027-2037F
31.2.2. By Application
31.2.2.1. Electrical Equipment, Market Value (USD Million), and CAGR, 2027-2037F
31.2.2.1.1. Transformers, Market Value (USD Million), and CAGR, 2027-2037F
31.2.2.1.2. Switchgear, Market Value (USD Million), and CAGR, 2027-2037F
31.2.2.1.3. Circuit Breakers, Market Value (USD Million), and CAGR, 2027-2037F
31.2.2.1.4. Others, Market Value (USD Million), and CAGR, 2027-2037F
31.2.2.2. Rotating Equipment, Market Value (USD Million), and CAGR, 2027-2037F
31.2.2.2.1. Electric Motors, Market Value (USD Million), and CAGR, 2027-2037F
31.2.2.2.2. Generators, Market Value (USD Million), and CAGR, 2027-2037F
31.2.2.2.3. Others, Market Value (USD Million), and CAGR, 2027-2037F
31.2.2.3. Electronic Components, Market Value (USD Million), and CAGR, 2027-2037F
31.2.2.3.1. Sensors, Market Value (USD Million), and CAGR, 2027-2037F
31.2.2.3.2. Ignition Coils, Market Value (USD Million), and CAGR, 2027-2037F
31.2.2.3.3. Others, Market Value (USD Million), and CAGR, 2027-2037F
31.2.2.4. Wire & Cable, Market Value (USD Million), and CAGR, 2027-2037F
31.2.2.4.1. Power Cables, Market Value (USD Million), and CAGR, 2027-2037F
31.2.2.4.2. Magnet Wires, Market Value (USD Million), and CAGR, 2027-2037F
31.2.2.4.3. Others, Market Value (USD Million), and CAGR, 2027-2037F
31.2.2.5. Battery & Energy Storage Systems, Market Value (USD Million), and CAGR, 2027-2037F
31.2.2.5.1. Battery Packs, Market Value (USD Million), and CAGR, 2027-2037F
31.2.2.5.2. Others, Market Value (USD Million), and CAGR, 2027-2037F
31.2.2.6. Power Electronics, Market Value (USD Million), and CAGR, 2027-2037F
31.2.2.6.1. Inverters, Market Value (USD Million), and CAGR, 2027-2037F
31.2.2.6.2. Converters, Market Value (USD Million), and CAGR, 2027-2037F
31.2.2.6.3. Others, Market Value (USD Million), and CAGR, 2027-2037F
31.2.3. By End use Industry
31.2.3.1. Automotive, Market Value (USD Million), and CAGR, 2027-2037F
31.2.3.2. Consumer Electronics, Market Value (USD Million), and CAGR, 2027-2037F
31.2.3.3. Aerospace and Defense, Market Value (USD Million), and CAGR, 2027-2037F
31.2.3.4. Industrial, Market Value (USD Million), and CAGR, 2027-2037F
31.2.3.5. Energy and Utility, Market Value (USD Million), and CAGR, 2027-2037F
31.2.3.6. Others, Market Value (USD Million), and CAGR, 2027-2037F
31.2.4. By Voltage
31.2.4.1. Up to 1 kV, Market Value (USD Million), and CAGR, 2027-2037F
31.2.4.2. 1–35 kV, Market Value (USD Million), and CAGR, 2027-2037F
31.2.4.3. 35–230 kV, Market Value (USD Million), and CAGR, 2027-2037F
31.2.4.4. Above 230 kV, Market Value (USD Million), and CAGR, 2027-2037F
31.2.5. Country Level Analysis, Value (USD Million)
31.2.5.1. Brazil Market Value (USD Million) and CAGR & Y-o-Y Growth Trend, 2027-2037F
31.2.5.2. Argentina Market Value (USD Million) and CAGR & Y-o-Y Growth Trend, 2027-2037F
31.2.5.3. Mexico Market Value (USD Million) and CAGR & Y-o-Y Growth Trend, 2027-2037F
31.2.5.4. Rest of Latin America Market Value (USD Million) and CAGR & Y-o-Y Growth Trend, 2027-2037F
32. Middle East & Africa Market
32.1. Overview
32.1.1. Market Value (USD Million), Current and Future Projections, 2027-2037
32.1.2. Increment $ Opportunity Assessment, 2027-2037
32.1.3. Year-on-Year Growth Forecast (%)
32.2. Segmentation (USD Million), 2027-2037, By
32.2.1. By Material Type
32.2.1.1. Thermoset Insulation Materials, Market Value (USD Million), and CAGR, 2027-2037F
32.2.1.1.1. Epoxy Resins, Market Value (USD Million), and CAGR, 2027-2037F
32.2.1.1.2. Phenolic Resins, Market Value (USD Million), and CAGR, 2027-2037F
32.2.1.1.3. Unsaturated Polyester Resins, Market Value (USD Million), and CAGR, 2027-2037F
32.2.1.1.4. Polyurethane Resins, Market Value (USD Million), and CAGR, 2027-2037F
32.2.1.1.5. Silicone Resins, Market Value (USD Million), and CAGR, 2027-2037F
32.2.1.1.6. Melamine Resins, Market Value (USD Million), and CAGR, 2027-2037F
32.2.1.1.7. Others, Market Value (USD Million), and CAGR, 2027-2037F
32.2.1.2. Thermoplastic Insulation Materials, Market Value (USD Million), and CAGR, 2027-2037F
32.2.1.2.1. Polyamide (PA6, PA66), Market Value (USD Million), and CAGR, 2027-2037F
32.2.1.2.2. Polybutylene Terephthalate (PBT), Market Value (USD Million), and CAGR, 2027-2037F
32.2.1.2.3. Polyethylene Terephthalate (PET), Market Value (USD Million), and CAGR, 2027-2037F
32.2.1.2.4. Polyphenylene Sulfide (PPS), Market Value (USD Million), and CAGR, 2027-2037F
32.2.1.2.5. Polyether Ether Ketone (PEEK), Market Value (USD Million), and CAGR, 2027-2037F
32.2.1.2.6. Polyetherimide (PEI), Market Value (USD Million), and CAGR, 2027-2037F
32.2.1.2.7. Polycarbonate (PC), Market Value (USD Million), and CAGR, 2027-2037F
32.2.1.2.8. Polyethylene (PE), Market Value (USD Million), and CAGR, 2027-2037F
32.2.1.2.9. Liquid Crystal Polymer (LCP), Market Value (USD Million), and CAGR, 2027-2037F
32.2.1.2.10. Polyvinyl Chloride (PVC), Market Value (USD Million), and CAGR, 2027-2037F
32.2.1.2.11. Others, Market Value (USD Million), and CAGR, 2027-2037F
32.2.1.3. Others, Market Value (USD Million), and CAGR, 2027-2037F
32.2.2. By Application
32.2.2.1. Electrical Equipment, Market Value (USD Million), and CAGR, 2027-2037F
32.2.2.1.1. Transformers, Market Value (USD Million), and CAGR, 2027-2037F
32.2.2.1.2. Switchgear, Market Value (USD Million), and CAGR, 2027-2037F
32.2.2.1.3. Circuit Breakers, Market Value (USD Million), and CAGR, 2027-2037F
32.2.2.1.4. Others, Market Value (USD Million), and CAGR, 2027-2037F
32.2.2.2. Rotating Equipment, Market Value (USD Million), and CAGR, 2027-2037F
32.2.2.2.1. Electric Motors, Market Value (USD Million), and CAGR, 2027-2037F
32.2.2.2.2. Generators, Market Value (USD Million), and CAGR, 2027-2037F
32.2.2.2.3. Others, Market Value (USD Million), and CAGR, 2027-2037F
32.2.2.3. Electronic Components, Market Value (USD Million), and CAGR, 2027-2037F
32.2.2.3.1. Sensors, Market Value (USD Million), and CAGR, 2027-2037F
32.2.2.3.2. Ignition Coils, Market Value (USD Million), and CAGR, 2027-2037F
32.2.2.3.3. Others, Market Value (USD Million), and CAGR, 2027-2037F
32.2.2.4. Wire & Cable, Market Value (USD Million), and CAGR, 2027-2037F
32.2.2.4.1. Power Cables, Market Value (USD Million), and CAGR, 2027-2037F
32.2.2.4.2. Magnet Wires, Market Value (USD Million), and CAGR, 2027-2037F
32.2.2.4.3. Others, Market Value (USD Million), and CAGR, 2027-2037F
32.2.2.5. Battery & Energy Storage Systems, Market Value (USD Million), and CAGR, 2027-2037F
32.2.2.5.1. Battery Packs, Market Value (USD Million), and CAGR, 2027-2037F
32.2.2.5.2. Others, Market Value (USD Million), and CAGR, 2027-2037F
32.2.2.6. Power Electronics, Market Value (USD Million), and CAGR, 2027-2037F
32.2.2.6.1. Inverters, Market Value (USD Million), and CAGR, 2027-2037F
32.2.2.6.2. Converters, Market Value (USD Million), and CAGR, 2027-2037F
32.2.2.6.3. Others, Market Value (USD Million), and CAGR, 2027-2037F
32.2.3. By End use Industry
32.2.3.1. Automotive, Market Value (USD Million), and CAGR, 2027-2037F
32.2.3.2. Consumer Electronics, Market Value (USD Million), and CAGR, 2027-2037F
32.2.3.3. Aerospace and Defense, Market Value (USD Million), and CAGR, 2027-2037F
32.2.3.4. Industrial, Market Value (USD Million), and CAGR, 2027-2037F
32.2.3.5. Energy and Utility, Market Value (USD Million), and CAGR, 2027-2037F
32.2.3.6. Others, Market Value (USD Million), and CAGR, 2027-2037F
32.2.4. By Voltage
32.2.4.1. Up to 1 kV, Market Value (USD Million), and CAGR, 2027-2037F
32.2.4.2. 1–35 kV, Market Value (USD Million), and CAGR, 2027-2037F
32.2.4.3. 35–230 kV, Market Value (USD Million), and CAGR, 2027-2037F
32.2.4.4. Above 230 kV, Market Value (USD Million), and CAGR, 2027-2037F
32.2.5. Country Level Analysis, Value (USD Million)
32.2.5.1. Saudi Arabia Market Value (USD Million) and CAGR & Y-o-Y Growth Trend, 2027-2037F
32.2.5.2. UAE Market Value (USD Million) and CAGR & Y-o-Y Growth Trend, 2027-2037F
32.2.5.3. Israel Market Value (USD Million) and CAGR & Y-o-Y Growth Trend, 2027-2037F
32.2.5.4. Qatar Market Value (USD Million) and CAGR & Y-o-Y Growth Trend, 2027-2037F
32.2.5.5. Kuwait Market Value (USD Million) and CAGR & Y-o-Y Growth Trend, 2027-2037F
32.2.5.6. Oman Market Value (USD Million) and CAGR & Y-o-Y Growth Trend, 2027-2037F
32.2.5.7. South Africa Market Value (USD Million) and CAGR & Y-o-Y Growth Trend, 2027-2037F
32.2.5.8. Rest of Middle East & Africa Market Value (USD Million) and CAGR & Y-o-Y Growth Trend, 2027-2037F
33. Global Economic Scenario
33.1. World Economic Outlook
34. About Research Nester
34.1. Our Global Clientele
34.2. We Serve Clients Across World
Electrical Insulation Materials Market Outlook:
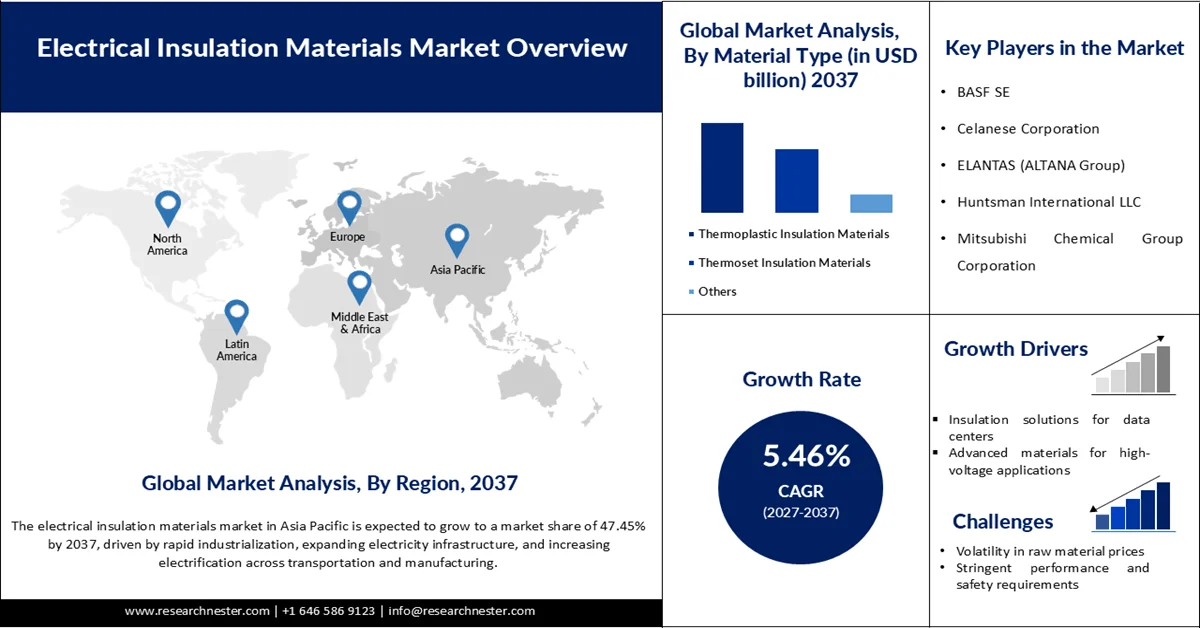
Electrical Insulation Materials Market size was valued at USD 12.77 billion in 2026 and is anticipated to reach USD 23.20 billion by the end of 2037, expanding at around 5.46% CAGR during the forecast period, i.e., between 2027-2037. In 2027, the industry size of electrical insulation materials is assessed at USD 13.64 billion.
The worldwide electrical insulation materials market is growing beyond traditional industrial forces, including grid modernization, electric vehicle adoption, regulatory compliance, demographic transition, a rise in predictive maintenance ecosystems, and underwriting standards. According to official statistics published by the Energy Transitions Commission in September 2024, in terms of net-zero scenarios, the overall length of grids is expected to grow by more than 50% by the end of 2050, demonstrating a USD 22.5 trillion investment. Besides, the International Energy Agency (IEA) demonstrated that in a grid-delay scenario, nations might miss the 58 Gt CO2 of cumulative emissions savings by the end of the same year. This is readily equivalent to worldwide power industrial carbon dioxide emissions from the past 4 years and nearly 430% of the remaining carbon budget for a 1.5 degrees Celsius scenario, thus fueling the market growth globally.
Furthermore, the workforce demographic transition in utilities, increased focus on insurance-based material specifications, and second-life polymer feedstocks from unrelated industries are a few trends that are also bolstering the electrical insulation materials market worldwide. According to official statistics published by NLM in June 2024, every year, more than 300 million tons of plastics are increasingly manufactured worldwide for consumers. In addition, the largest industry utilizing plastics is packaging, which accounts for roughly 40% of the overall plastic consumption globally, owing to the aspects of durability, lightweight, and an effective method of preservation. Besides, approximately 90.6% of plastics are usually based on fossil fuels, and other forms, such as mechanically recycled plastics, account for 8.9%. Moreover, the increased plastic utilization by different industries has resulted in optimizing polymer sustainability, which has readily emerged as a paramount objective for the overall market.
Plastic Utilization Across Different Industries for Polymer Sustainability, 2024
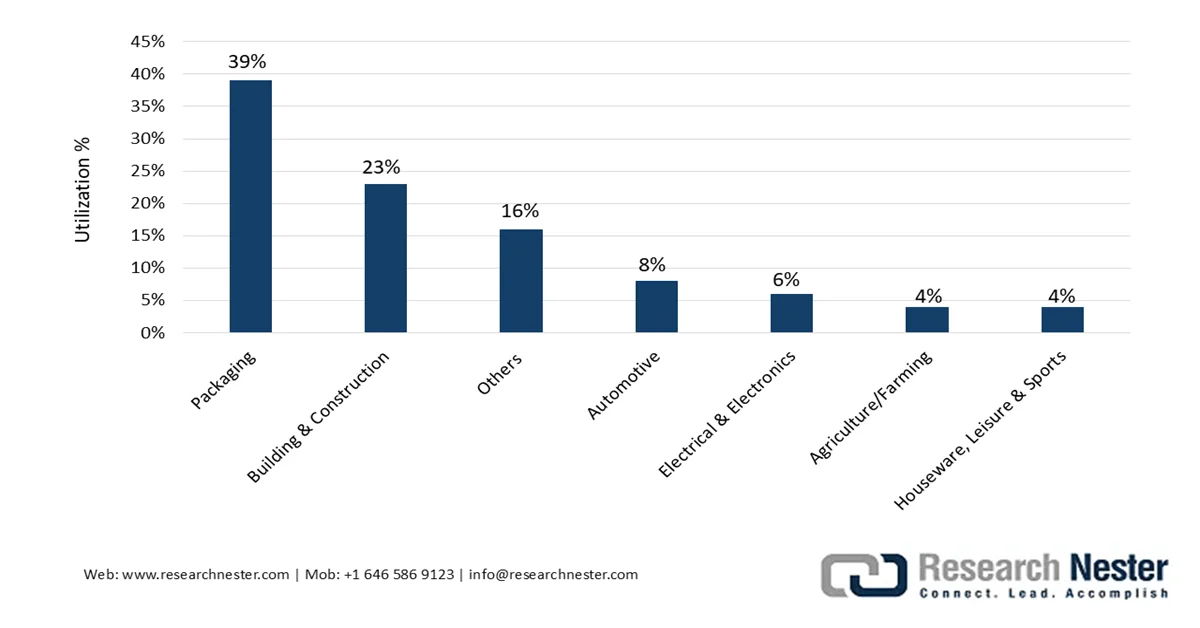
Source: NLM
Key Electrical Insulation Materials Market Insights Summary:
Regional Highlights:
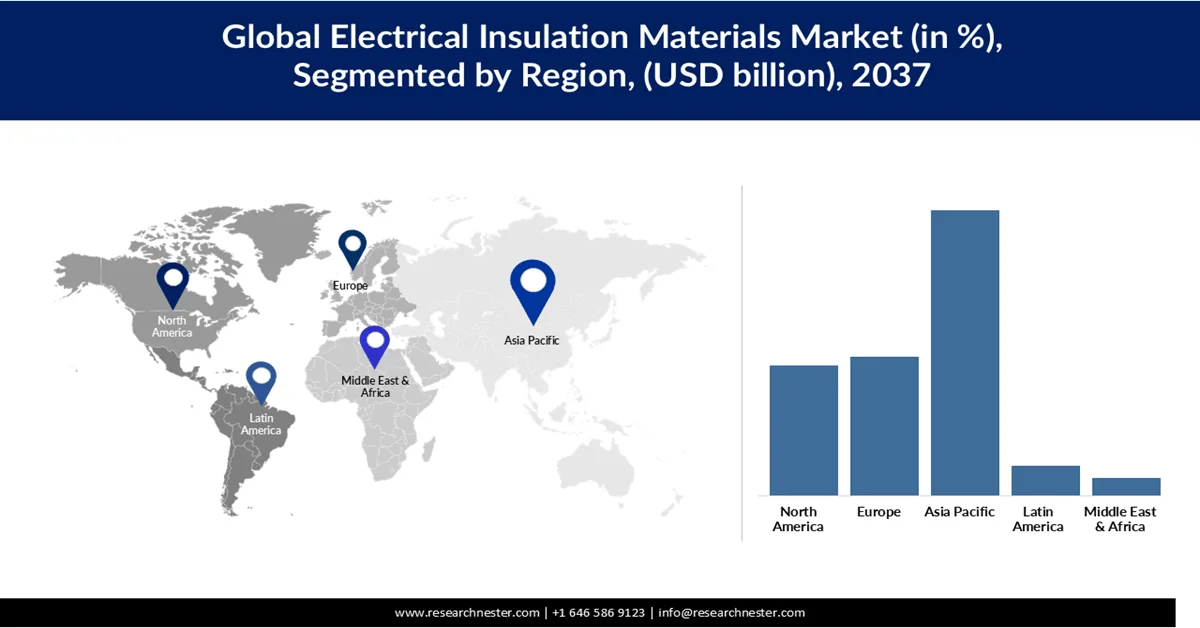
- Asia Pacific is projected to hold a 47.45% share by 2037 in the electrical insulation materials market, with its leading position underpinned by unparalleled industrial expansion, renewable energy deployment, grid modernization, and the presence of manufacturing powerhouses
- Europe is expected to capture a 23.05% share throughout the forecast period, with regional advancement stemming from modernization efforts for renewable energy integration, stringent environmental regulations, zero-pollution objectives, and increasing cross-border projects
- The U.S. is projected to account for 84.31% of the North America electrical insulation materials market share through 2036, mainly owing to extensive electrical infrastructure and a broad industrial and manufacturing base.
- The Japan commercial electrical insulation materials market volume is expected to be calculated at 171,590.99 tons in 2027, due to the strong demand for high-performance and technologically advanced insulation solutions.
Segment Insights:
- Thermoplastic insulation materials are projected to account for a 51.41% share by 2037 in the electrical insulation materials market, with their strong market position arising from recyclability, versatility, cost-efficiency, and reshaping capabilities that support modern manufacturing
- Electrical equipment is expected to command a 33.60% share through 2037, with segment growth strengthened by the essential role of insulation in reliable power equipment and continued innovations in high-power, high-voltage electric drives and power modules
Key Growth Trends:
- Data center liquid immersion cooling insulation
- Space-driven solar power transition
Major Challenges:
- Stringent and diverging regulatory compliance standards
- Technological obsolescence of legacy insulation systems
Key Players: BASF SE, Celanese Corporation, ELANTAS (ALTANA Group), Huntsman International LLC, Mitsubishi Chemical Group Corporation.
Global Electrical Insulation Materials Market Forecast and Regional Outlook:
Market Size & Growth Projections:
- 2026 Market Size: USD 12.77 billion
- 2027 Market Size: USD 13.64 billion
- Projected Market Size: USD 23.20 billion by 2037
- Growth Forecasts: 5.46% CAGR (2027-2037)
Key Regional Dynamics:
- Largest Region: Asia Pacific (47.45% Share by 2037)
- Fastest Growing Region: Asia Pacific
- Dominating Countries: China, United States, Germany, Japan, India
- Emerging Countries: India, China, South Korea, Japan, Australia
Last updated on : 21 August, 2026
Electrical Insulation Materials Market - Growth Drivers and Challenges
Growth Drivers
- Data center liquid immersion cooling insulation: The transition from air-cooled to liquid-immersed cooling across high-performance data centers has created specialized and new requirements for electrical insulation materials. Based on government estimates published by Congress in January 2026, the yearly energy utilization across data centers in the U.S. as of 2023 was approximately 176 TWh, which is roughly 4.4% of the domestic electricity consumption. Additionally, it has been predicted that data center energy consumption can double or triple by the end of 2028, further contributing to almost 12% of domestic electricity utilization. Besides, a 100- megawatt domestic data center has the ability to consume water, which is equivalent to 2,600 households, ultimately leading to direct water consumption through different cooling approaches, thus bolstering the electrical insulation materials market globally.
- Space-driven solar power transition: Space-based solar power projects are increasingly driving specialized insulation requirements for severe-environment power transmission, which is positively impacting the electrical insulation materials market. As stated in an article published by the Department of Energy in April 2026, laser solar satellites deliberately account for low startup expenses between USD 500 million and USD 1 billion. Meanwhile, microwave solar satellites provide uninterrupted and steady transmission of power through clouds, rain, and other atmospheric conditions. Additionally, these offer 1 GW of upward energy to a terrestrial receiver, which is considered to be suitable for powering a large-scale location, thereby making it suitable for the market’s expansion.
- Desert solar farm corrosion mitigation: The aspect of utility-scale solar installations in arid, dust-prone environments, such as the Atacama Desert and Arabian Peninsula, face a distinct insulation challenge. This includes abrasive dust infiltration combined with condensation-driven corrosion. Besides, unlike coastal or temperate installations, desert solar farms experience high daytime temperatures, low humidity, and sudden dew incidents at night, and condensation that results in accumulated dust, forming a conductive sludge that tracks across insulator surfaces and accelerates tracking and erosion. Moreover, standard hydrophobic silicone rubber insulators, effective in polluted industrial areas, degrade faster under this abrasive-condensation cycle because dust particles embed in the rubber surface, retaining moisture.
Challenges
- Stringent and diverging regulatory compliance standards: Manufacturers must simultaneously satisfy multiple, often contradictory, fire safety, environmental, and electrical performance regulations across different geographies. A material approved for utilization in European rail infrastructure may fail North American flame‑spread or smoke‑toxicity tests, forcing companies to maintain separate product portfolios and certification processes. The ongoing global transition away from halogenated flame retardants and certain per‑and polyfluoroalkyl substances adds another layer of complexity, as substitute materials require extensive requalification by original equipment manufacturers. Besides, regulatory bodies update their standards asynchronously, leaving manufacturers in a perpetual state of catching up rather than leading innovation, thus negatively impacting the electrical insulation materials market.
- Technological obsolescence of legacy insulation systems: A significant portion of existing electrical infrastructure, from power transformers to industrial motors, still relies on decades‑old insulation technologies that are ill‑suited for modern operating conditions. Moreover, as grids integrate intermittent renewables and EVs introduce ultra‑high‑voltage charging cycles, legacy materials, such as conventional kraft paper, oil‑impregnated systems, and standard thermoplastics, degrade faster than their original design life, raising the risk of premature failure and unplanned downtime. Therefore, retrofitting this installed base is technically complex and economically unattractive for asset owners, who prefer cheaper, immediate repairs over complete redesigns. However, continuing with outdated insulation increases maintenance frequency and reduces overall system reliability, which is causing a hindrance in the electrical insulation materials market.
Electrical Insulation Materials Market Size and Forecast:
| Report Attribute | Details |
|---|---|
|
Base Year |
2026 |
|
Forecast Year |
2027-2037 |
|
CAGR |
5.46% |
|
Base Year Market Size (2026) |
USD 12.77 billion |
|
Forecast Year Market Size (2037) |
USD 23.20 billion |
|
Regional Scope |
|
Electrical Insulation Materials Market Segmentation:
Material Type Segment Analysis
By the end of the stipulated timeline, the thermoplastic insulation materials segment, part of the material type, is expected to garner a 51.41% share of the electrical insulation materials market. The segment’s development is largely attributed to its importance in modernizing manufacturing, owing to its ability to be reshaped and remelted, providing increased recyclability, versatility, and cost-efficiency. As per a data report published by the International Institute for Sustainable Development in July 2025, an increase in thermoplastics has been predicted by an estimated 70%, from almost 350 million to 590 million tons by the end of 2050. Besides, thermoplastics comprise the category of plastics from which the majority of plastic products, such as single-use plastics, are made, including polyethylene terephthalate, polyvinyl chloride, polystyrene, polypropylene, high-density polyethylene, and low-density polyethylene, thus driving the segment’s upliftment.
Application Segment Analysis
The electrical equipment segment is projected to hold 33.60% of the electrical insulation materials market through 2037. This is mainly due to the fact that insulation is fundamental to the safe and reliable operation of equipment used across power generation, transmission, and distribution. The continuous expansion and modernization of electricity infrastructure are supporting the increasing sales of electrical equipment. In July 2026, SABIC, a leading global chemicals company, launched a new range of LNP™ THERMOCOMP™ materials designed for high-power, high-voltage electric drives and power modules, including IGBT switching devices. Thus, innovations are also driving the overall segmental growth.
End use Industry Segment Analysis
The industrial segment is projected to capture 25.68% of the global electrical insulation materials market share through 2037. Industrial facilities operate a large and diverse base of electrical equipment, which requires insulation for safe, continuous, and efficient operation. Manufacturing plants, chemical facilities, and metal processing units are creating substantial demand for insulation materials. According to the United Nations Industrial Development Organization (UNIDO), in the first quarter of 2026, global manufacturing output and exports both grew, though at different rates. For instance, production rose by 1.2% and exports by 3.5%.
Our in-depth analysis of the electrical insulation materials market includes the following segments:
|
Segments |
Subsegments |
|
Material Type |
|
|
Application
|
|
|
End use Industry |
|
|
Voltage |
|

Vishnu Nair
Head - Global Business DevelopmentCustomize this report to your requirements — connect with our consultant for personalized insights and options.
Electrical Insulation Materials Market - Regional Analysis
Asia Pacific Market Insights
The Asia Pacific in the electrical insulation materials market is anticipated to grab the largest share of 47.45% by the end of 2037. The market’s upliftment in the region is primarily attributed to the unparalleled industrial expansion, renewable energy deployment, grid modernization, and the presence of manufacturing powerhouses. According to official statistics published by the ADB Organization in April 2025, there has been a growth in clean energy investment in the region of over 900%, reaching USD 729.4 billion as of 2023, further comprising nearly 45% of worldwide investment. Besides, China accounted for the majority of this investment by collaborating with India and 7 other countries, wherein renewables surpassed 75% of the newest national energy capacity addition in 2022. Therefore, with all these developments, the market is gradually expanding in the overall region.
The electrical insulation materials market in China is growing significantly, reaching USD 5,343.11 million by 2037, owing to the existence of the largest manufacturing base for electrical equipment, robust renewable energy targets, readily prioritizing chemical and petrochemical industries, and the production of sustainable aviation fuel and green methanol. As stated in an article published by the State Council Information Office in September 2025, the country has aimed to achieve an average yearly increase of more than 5% in the added value of the chemical and petrochemical sectors by the end of 2026. This objective comprises a rebound in economic returns that marks an upsurge in technological, scientific, and industrial advancement, along with measurable reductions in both carbon emissions and pollution, thereby positively impacting the market upliftment in the country.
The aspects of revitalizing the semiconductor industry based on government strategies, the presence of an advanced electronics ecosystem, and the domestic supply dynamics for industrial equipment, automobiles, and electronics are certain factors that are proliferating the electrical insulation materials market in Japan. Besides, the domestic electrical insulation materials industry was worth USD 610.13 million as of 2026, which is projected to be valued at USD 873.45 million by the end of 2037. Moreover, as per the November 2025 ITA article, the semiconductor industry in the country reached USD 51 billion in 2025, owing to steady growth and increased investments in memory and logic integrated circuits, thus bolstering the market exposure.
Japan Semiconductor Industrial Size Analysis, 2022-2025
|
Year |
Market Size (USD Billion) |
Year-on-Year Growth |
Exchange Rate |
|
2022 |
48.1 |
10.2% |
131.4 |
|
2023 |
48.7 |
-2.9% |
140.4 |
|
2024 |
47.4 |
1.4% |
150.5 |
|
2025 |
51.8 |
9.4% |
148.9 |
Source: ITA
Japan Electrical Insulation Materials Market Size and Forecast
|
Report Attribute |
Details |
|
Base Year Market Size (2026); Volume Size (2026) |
USD 610.13 million; 166,560.33 tons |
|
Forecast Year Market Size (2037); Volume Size (2037) |
USD 873.45 million; 193,283.07 tons |
|
CAGR (2026-2037) |
3.16% |
Europe Market Insights
Europe is expected to capture 23.05% of the global electrical insulation materials market share throughout the forecast period. The market’s development in the region is highly propelled by modernization approaches for renewable energy integration, strict environmental regulations across countries, the zero-pollution objective, and an increase in cross-border projects. According to official data published by the European Commission in 2026, the zero-pollution vision for 2050 is focused on improving air quality to lower the number of premature deaths caused by air pollution by 55%. This is followed by optimizing water quality by reducing plastic and waste litter at sea by 50% and microplastics in the environment by 30%. The objective also focuses on enhancing soil quality by lowering nutrient losses and chemical pesticide utilization by 50%, thereby making it suitable for boosting market development in the region.
The electrical insulation materials market in Germany is gaining increased traction and is set to reach USD 1,363.09 million by 2037, owing to the presence of the sophisticated chemical industry, the manufacturing facility for power equipment, industrial automation, and automotive, along with strong federal policy and the grid modernization program. As stated in an article published by Green Carbon in March 2024, the German Nova Institute demonstrated the production of 373 million tons of plastic from fossil raw materials, while the Plastics Europe industry association noted 391 million tons of plastic production. Meanwhile, the Organization for Economic Cooperation and Development predicted roughly 600 million tons of plastic to be produced by the end of 2060. Therefore, with this increase in the production process, there is a huge growth opportunity for the market in the country overall.
The UK electrical insulation materials market is projected to reach USD 676.99 million by 2037. The market growth is supported by investments in grid modernization and renewable energy systems. Robust electrification and automation are also driving the sales of electrical insulation materials. The UK's transition toward a more electrified and low-carbon energy system opens lucrative opportunities for electrical insulation material companies.
North America Market Insights
North America is projected to capture 21.58% of the electrical insulation materials market by the end of the stipulated timeline. The market’s growth in the region is significantly fueled by the modernization of aging power grids, an increase in the electrification of transportation, and an expansion in renewable energy infrastructure across Canada and the U.S. According to official statistics published by the Center for Sustainable Systems in 2026, 82% of energy in the U.S. derives from fossil fuels, which is followed by 8.7% from nuclear, and 9.1% from renewable sources. In addition, solar and wind are the fastest-growing renewable sources, contributing less than 3% of overall energy utilization in the country. Besides, the country comprises approximately 463,400 TWh of renewable energy technical potential, which is more than 100 times the electricity, thus driving market growth in the region.
Renewable Energy Utilization in the U.S., 2013-2023
|
Year |
Biomass (Quads) |
Hydroelectricity (Quads) |
Wind (Quads) |
Solar (Quads) |
Geothermal (Quads) |
|
2013 |
4.8, 73.8% |
0.9, 13.9% |
0.5, 8.7% |
0.1, 1.8% |
0.1, 1.8% |
|
2014 |
5.0, 73.8% |
0.8, 13.0% |
0.6, 9.1% |
0.1, 2.4% |
0.1, 1.7% |
|
2015 |
5.0, 73.4% |
0.8, 12.4% |
0.6, 9.5% |
0.2, 2.9% |
0.1, 1.7% |
|
2016 |
5.0, 71.1% |
0.9, 12.8% |
0.7, 10.9% |
0.2, 3.5% |
0.1, 1.7% |
|
2017 |
5.0, 68.3% |
1.0, 13.9% |
0.8, 11.8% |
0.3, 4.5% |
0.1, 1.6% |
|
2018 |
5.1, 67.7% |
1.0, 13.2% |
0.9, 12.3% |
0.3, 5.1% |
0.1, 1.6% |
|
2019 |
5.0, 66.6% |
0.9, 12.9% |
1.0, 13.3% |
0.4, 5.7% |
0.1, 1.5% |
|
2020 |
4.5, 62.3% |
0.9, 13.3% |
1.1, 15.8% |
0.5, 7.0% |
0.1, 1.6% |
|
2021 |
4.7, 62.1% |
0.8, 11.2% |
1.2, 16.9% |
0.6, 8.2% |
0.1, 1.5% |
|
2022 |
4.8, 60.0% |
0.8, 10.7% |
1.4, 18.3% |
0.7, 9.4% |
0.1, 1.5% |
|
2023 |
4.9, 60.4% |
0.8, 9.8% |
1.4, 17.6% |
0.8, 10.6% |
0.1, 1.5% |
Source: Center for Sustainable Systems
The electrical insulation materials market in the U.S. is gaining increased exposure and is set to reach USD 4,222.96 million by 2037, owing to federal grid modernization funding, an increase in commercial fleet electrification, and the occurrence of extreme weather incidents. As stated in an article published by the Department of Energy in March 2026, the Office of Electricity (OE) proclaimed an estimated USD 1.9 billion funding opportunity to accelerate the upgrading of the country’s power grid. This particular investment is poised to cater to the rise in electricity demand as well as resource adequacy requirements, while diminishing electricity expenses for regional businesses and households. Based on this, different projects have been selected through the Speed to Power through Accelerated Reconductoring and other Key Advanced Transmission Technology Upgrades (SPARK), thus proliferating the market growth.
The Canada electrical insulation materials market is expected to be valued at USD 441.36 million in 2027. The presence of distinct national priorities centering on renewable energy expansion and electrification mandates, an expansion in transmission facilities, government strategies, the growing need for an electricity network, and the Pan-Canada Framework on Clean Growth and Climate Change are certain trends that are fueling the electrical insulation materials market in Canada. As per an article published by Natural Resources Canada in August 2025, the country’s clean energy gross domestic product (GDP) is expected to reach USD 107 billion, which is highly driven by USD 58 billion in yearly investments by the end of 2030 and over 600,000 employment opportunities. Besides, between 140 and 190 GW of additional clean electricity generating capacity are predicted to be required by the end of 2050, thus creating a huge growth opportunity for the market.
Key Electrical Insulation Materials Market Players:
- BASF SE (Germany)
- Celanese Corporation (U.S.)
- ELANTAS (ALTANA Group) (Germany)
- Huntsman International LLC (U.S.)
- Mitsubishi Chemical Group Corporation (Japan)
- Olin Corporation (U.S.)
- SABIC (Saudi Arabia)
- Solvay (Belgium)
- Sumitomo Bakelite Co., Ltd. (Japan)
- Wacker Chemie AG (Germany)
- Company Overview
- Business Strategy
- Key Product Offerings
- Financial Performance
- Key Performance Indicators
- Risk Analysis
- Recent Development
- Regional Presence
- SWOT Analysis
- BASF SE maintains a strong position in the electrical insulation materials landscape through its broad portfolio of engineering plastics, resins, coatings, and specialty materials. The company serves electrical and electronics, automotive, energy, and industrial applications. Its competitive strength comes from extensive R&D capabilities, global manufacturing infrastructure, application-specific material development, and a diversified customer base. BASF also emphasizes solutions supporting electrification, thermal management, lightweighting, and improved sustainability.
- Celanese Corporation competes in electrical insulation materials through its engineered materials portfolio, supplying high-performance polymers for electrical, electronic, automotive, and industrial applications. The company's competitive positioning is supported by specialized polymer technologies, global production capabilities, and application development expertise. Celanese focuses on materials offering electrical insulation, dimensional stability, thermal resistance, and mechanical performance, particularly for demanding components associated with electrification, power systems, and advanced electronic equipment.
- ELANTAS (ALTANA Group) has a specialized competitive position in electrical insulation materials, particularly through its insulating varnishes, resins, coatings, and related solutions. The company serves manufacturers of motors, generators, transformers, cables, and electronic components. Its differentiation is based on application-specific formulations, technical expertise, and global customer support. ELANTAS also continues developing materials designed for higher electrical performance, thermal resistance, energy efficiency, and evolving electrification requirements.
- Huntsman International LLC participates in the electrical insulation materials market primarily through its polyurethane, epoxy, and specialty chemical technologies. Its materials serve electrical, electronics, automotive, construction, and industrial applications where insulation, thermal management, bonding, and protection are required. Huntsman's competitive strength is supported by global manufacturing, formulation expertise, and application development capabilities. The company is positioned to benefit from increasing electrification and demand for durable, high-performance insulation systems.
- Mitsubishi Chemical Group Corporation holds a diversified position in electrical insulation materials through its advanced polymers, resins, films, composites, and specialty materials. Its portfolio supports electrical, electronics, automotive, energy, and industrial applications. The company benefits from strong materials science capabilities, extensive research infrastructure, and global operations. Its focus on high-performance materials for electrification, energy efficiency, lightweighting, and advanced electronic components strengthens its competitive position in the evolving electrical insulation materials market.
Below is the list of the key players, among several others, operating in the global electrical insulation materials market:
The electrical insulation materials market is characterized by a mature, fragmented, and competitive landscape dominated by diversified chemical and industrial conglomerates alongside specialized insulation manufacturers. The first tier of competition includes U.S.-based giants, including DuPont and 3M, European powerhouses such as Siemens and ABB, and Japan-specific leaders, including Hitachi and Nitto Denko. These players leverage extensive R&D capabilities, global distribution networks, and strong brand recognition to maintain their market positions. In August 2025, Hitachi Energy expanded its India-based transformer insulation production by aiming to double its capacity for pressboards. Based on this expansion, the factory in Mysore is projected to emerge as an ultra-low-carbon pressboard production facility by the end of 2027, with the absence of fossil fuel utilization for processing heat generation, thus boosting the electrical insulation materials industry globally.
Corporate Landscape of the Global Electrical Insulation Materials Market:
Recent Developments
- In July 2026, delfort broadened its range of specialized parts for transformer makers by adding a new pressboard production line and bringing insulation specialist Isotek into the group. “This strategic expansion and added capacity improve supply reliability for our customers,” said Olli Aho, head of electrical insulation materials at delfort.
- In October 2025, Clariant completed its USD 127.7 million investment in the Daya Bay facility, with the second production line fully operational, which further strengthened its ability to cater to the growing demand for increased sustainable flame-retardant solutions, particularly in Asia and other nations.
- In October 2025, TopBuild Corp. successfully acquired Specialty Products and Insulation for USD 1.0 billion, which was suitable for positioning the combined organization by providing consumers with advanced and high-quality solutions.
- In May 2024, BASF significantly opted for sustainable glass fiber in its Ultramid® A&B portfolio by setting up the ambitious objective of diminishing its Scope 3.1 emissions by 15% by the end of 2030 and achieving net zero by the end of 2050.
- Report ID: 8560
- Published Date: Aug 21, 2026
- Report Format: PDF, PPT
- Explore a preview of key market trends and insights
- Review sample data tables and segment breakdowns
- Experience the quality of our visual data representations
- Evaluate our report structure and research methodology
- Get a glimpse of competitive landscape analysis
- Understand how regional forecasts are presented
- Assess the depth of company profiling and benchmarking
- Preview how actionable insights can support your strategy
Explore real data and analysis
Frequently Asked Questions (FAQ)
About this Report
Connect with our Expert


Report, 2027-2037


Copyright @ 2026 Research Nester. All Rights Reserved.
