Computed Tomography Market Outlook:
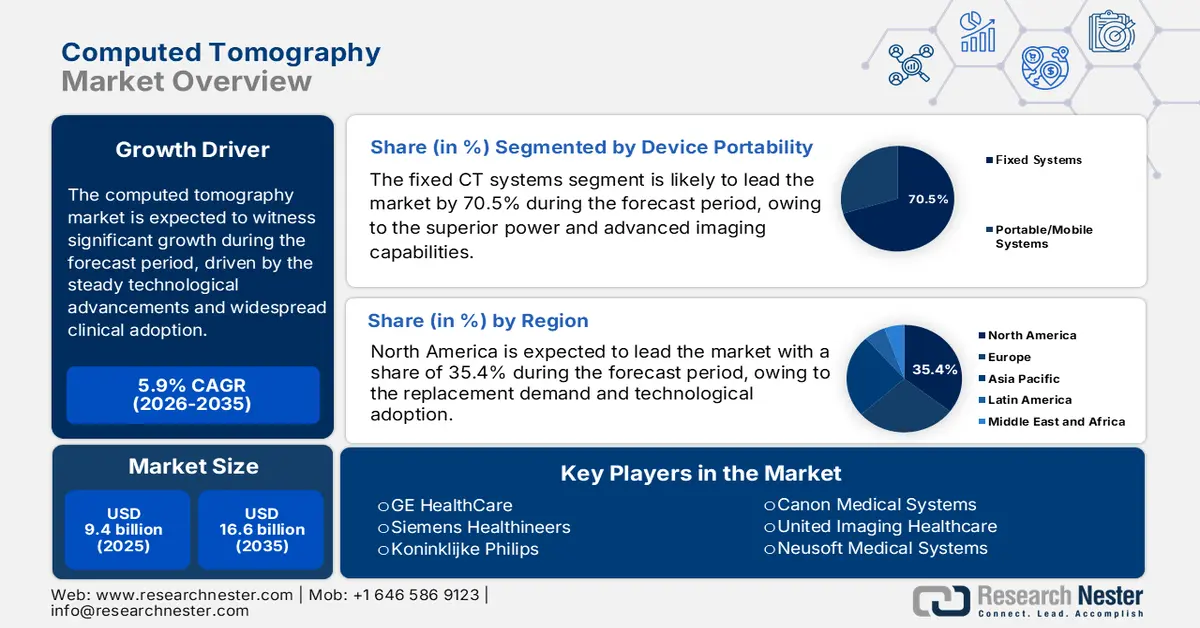
Computed Tomography Market size was valued at USD 9.4 billion in 2025 and is projected to reach USD 16.6 billion by the end of 2035, rising at a CAGR of 5.9% during the forecast period, i.e., 2026-2035. In 2026, the industry size of computed tomography is evaluated at USD 9.9 billion.
The global computed tomography market is expanding in a significant segment within the medical imaging industry and is defined by steady technological advancements and widespread clinical adoption. Growth is primarily driven by the increasing global burden of chronic diseases such as cardiovascular conditions and cancer, which require precise diagnostic tools for effective management. According to the World Health Organization data in September 2025, non-communicable diseases are responsible for approximately 75% of all deaths worldwide, underpinning a sustained demand for diagnostic imaging. Additionally, the expansion of healthcare infrastructure in developing economies and the aging global population are key demographic factors contributing to market expansion. Further, advanced image utilization is concentrated in hospital outpatient and emergency settings where CT represents one of the most frequently ordered modalities for trauma, stroke, oncology staging, and acute abdomen cases.
Besides, the computed tomography scans are essential diagnostic tools in medicine as they provide rapid high-resolution cross-sectional images of internal anatomy. They are critically employed in emergency care for the assessment of trauma, such as internal bleeding or fractures, where speed is essential. In oncology, the CT is fundamental for tumor detection, staging, and monitoring treatment response. The tool is capable of differentiating among the subtle tissue density make it indispensable for guiding biopsies, surgical planning, and diagnosing complex pulmonary and musculoskeletal disorders. A recent development in the computed tomography (CT) market is the innovative launch of Terrene, built by Trivitron Healthcare. The device aims to ensure the accessibility of advanced technology in all healthcare facilities. Further, this development highlights the industry's focus on market expansion by making advanced diagnostic capabilities economically and operationally.
Key Computed Tomography Market Insights Summary:
Regional Highlights:
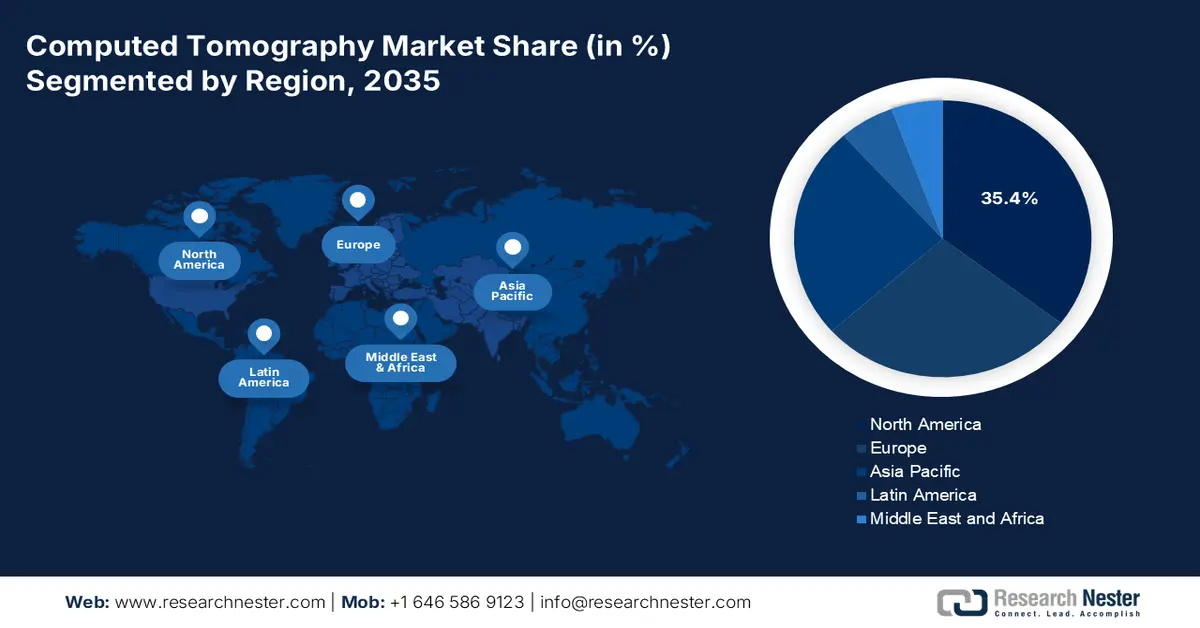
- North America is projected to command a 35.4% revenue share by 2035 in the computed tomography market, supported by accelerated replacement cycles and rapid deployment of advanced imaging technologies across well-funded healthcare systems.
- Asia Pacific is anticipated to expand at a CAGR of 6.8% during 2026–2035, underpinned by large-scale public healthcare investments and rising adoption of CT imaging across emerging and mature economies.
Segment Insights:
- Within the device portability segment, fixed CT systems are expected to retain a dominant 70.5% revenue share by 2035 in the computed tomography market, sustained by their superior imaging power and seamless integration into high-volume hospital diagnostic workflows.
- In the architecture segment, fixed/stationary CT systems continue to lead by 2035, benefiting from high throughput, diagnostic versatility, and strong return on investment that reinforce sustained capital spending by radiology departments.
Key Growth Trends:
- Rising diagnostic imaging volumes in universal health coverage programs
- Public health emergency preparedness investments
Major Challenges:
- Intense price competition and reimbursement pressure
- High R&D and capital intensity
Key Players: Siemens Healthineers (Germany), Koninklijke Philips (Netherlands), Canon Medical Systems (Japan), United Imaging Healthcare (China), Neusoft Medical Systems (China), Shenzhen Anke High-tech Co., Ltd. (China), Samsung Medison (South Korea), Hitachi Healthcare (Japan), Shimadzu Corporation (Japan), Carestream Health (U.S.), NeuroLogica Corp. (Samsung) (U.S.), Planmed Oy (Finland), AGFA HealthCare (Belgium), Koning Corporation (U.S.), CurveBeam AI (U.S.), MinFound Medical Systems (China), J.Morita Corp. (Japan), Genoray Co., Ltd (South Korea), Vatech (South Korea).
Global Computed Tomography Market Forecast and Regional Outlook:
Market Size & Growth Projections:
- 2025 Market Size: USD 9.4 billion
- 2026 Market Size: USD 9.9 billion
- Projected Market Size: USD 16.6 billion by 2035
- Growth Forecasts: 5.9% CAGR (2026-2035)
Key Regional Dynamics:
- Largest Region: North America (35.4% Share by 2035)
- Fastest Growing Region: Asia Pacific
- Dominating Countries: United States, Germany, Japan, China, United Kingdom
- Emerging Countries: India, China, South Korea, Brazil, Mexico
Last updated on : 13 January, 2026
Computed Tomography Market - Growth Drivers and Challenges
Growth Drivers
- Rising diagnostic imaging volumes in universal health coverage programs: The expansion of universal health coverage is structurally increasing the diagnostic imaging utilization in middle-income countries. The World Health Organization reports that many countries are pursuing UHC reforms. Many of which include guaranteed access to essential diagnostics. The WHO data in 2026 indicates that 3,600 million diagnostic radiology examinations are performed each year globally, with CT representing a high-value segment of imaging expenditure. In countries such as Indonesia, Brazil, and South Africa, government reimbursement expansion has shifted CT from private pay to publicly funded utilization. This policy transition from out-of-pocket to public financing is creating a more stable high-volume demand pipeline, fundamentally altering market access strategies for manufacturers who must now align with national procurement and tender processes.
- Public health emergency preparedness investments: The COVID 19 pandemic exposed critical gaps in the diagnostic infrastructure, leading to increased government spending on resilient health systems. This includes stockpiling portable imaging equipment and funding for rapid diagnostic capabilities to manage future pandemics or mass casualty events. Agencies such as the European Centre for Disease Prevention and Control highlight medical imaging capacity as a component of preparedness, influencing national procurement strategies. Further, the national stockpiling initiatives now explicitly include mobile CT units as strategic assets while fixed infrastructure grants increasingly require designs that accommodate rapid conversion for high-throughput respiratory imaging. This has led to dedicated funding lines such as the U.S. Administration for strategic preparedness and response grants for hospital readiness, which list advanced imaging capabilities as an eligible expenditure for enhancing surge capacity.
- High Import Dependence: The import data for the CT and MRI scanners underscore a powerful government-led growth driver in the computed tomography market. The strategic push is to reduce the import dependency and build domestic manufacturing capacity. The report from the CCI in August 2024 shows that India’s heavy reliance on imports with CT scanner apparatus alone amounting to INR 1,010 crore in 2022-2023 from China U.S., and Germany represents both a vulnerability and a substantial market opportunity. This import bill is coupled with the low rate of R&D units, domestic medical device factor has catalyzed policy action. Initiatives such as the production-linked incentive scheme for medical devices and the promotion of research and innovation in the pharma medtech sector scheme are direct fiscal responses designed to attract investment, boost R&D, and incentivize local production of high-end equipment. This creates a targeted demand landscape for local assembly lines, technology transfer partnerships, and component manufacturing, driving the market growth.
CT and MRI Apparatus Import (2022 to 2023)
|
Country |
CT Scan apparatus |
MRI apparatus |
||
|
Value (INR Cr) |
Quantity (in thousands) |
Value (INR Cr) |
Quantity (in thousands) |
|
|
China |
306 |
2 |
640 |
107 |
|
U.S. |
275 |
0.07 |
703 |
1034 |
|
Japan |
153 |
0.21 |
87 |
1 |
|
Singapore |
7 |
0.25 |
132 |
186 |
|
Germany |
177 |
0.05 |
200 |
4 |
|
Netherlands
|
11 |
0.04 |
290 |
190 |
Source: CCI August 2024
Challenges
- Intense price competition and reimbursement pressure: Government cost containment policies and group purchasing organizations aggressively negotiate prices, squeezing margins. New entrants cannot compete on price alone without scale. In markets such as Japan, government-led price revisions for diagnostic imaging equipment forced manufacturers to cut prices. The global market is set to rise despite the government pricing constraints in key geographies, forcing the new companies to compete on niche features rather than cost.
- High R&D and capital intensity: Developing a competitive CT scanner requires a huge amount of investment and years for R&D, advanced detector physics, and clinical validation. This creates a prohibitive barrier to entry. Startups attempt to circumvent this with a novel digital X-ray source for a lower cost system, but achieving image quality parity with top giants in the computed tomography (CT) market remains a multi year capital intensive challenge. Even though the market surges, the growth is primarily captured by incumbents who can sustain such massive R&D budgets.
Computed Tomography Market Size and Forecast:
| Report Attribute | Details |
|---|---|
|
Base Year |
2025 |
|
Forecast Year |
2026-2035 |
|
CAGR |
5.9% |
|
Base Year Market Size (2025) |
USD 9.4 billion |
|
Forecast Year Market Size (2035) |
USD 16.6 billion |
|
Regional Scope |
|
Computed Tomography Market Segmentation:
Device Portability Segment Analysis
Within the device portability segment, the fixed CT systems are projected to maintain the dominant revenue share of 70.5% by 2035. The dominance is due to their superior power, advanced imaging capabilities, and integration into high-volume clinical workflows in hospitals. While mobile portable CT units are experiencing significant growth, particularly for point of care use in ICU operating rooms and rural setting their adoption is constrained by higher slice count limitations and cost per use factors for health systems. The Fixed system remains the central investment for the core diagnostic imaging department. A recent development is that ScanTech AI Systems Inc., a top company in the computed tomography market, has announced the launch of the SENTINEL Fixed-Gantry CT Scanner in October 2025 with a customized contraband detection algorithm. These innovations highlight the platform's inherent versatility and reliability beyond traditional healthcare.
Architecture Segment Analysis
In the architecture segment, fixed/stationary CT systems are leading the architecture segment in the computed tomography (CT) market. These systems form the backbone of radiology departments due to their unmatched imaging performance stability for high-resolution scanning and the ability to house the most advanced technological components, such as dual-source detectors. While the O-arm and C-arm systems provide critical intraoperative and mobile imaging solutions for specialized applications in orthopedics and surgery, their market penetration is niche. The high throughput, diagnostic versatility, and return on investment of premium fixed systems drive sustained capital expenditure. Various government data have highlighted that the CT exams performed in the hospitals are fixed in department scanners, highlighting their fundamental and irreplaceable role in routine diagnostic care.
End user Segment Analysis
The hospitals and clinics segment is leading the end user segment in the market, accounting for the largest share of CT scanner purchases and service revenue. This dominance is driven by the high patient volume in hospitals, the need for 24/7 emergency and inpatient access to CT, and the financial capacity of large institutions to invest in the largest high-cost advanced systems. Diagnostic imaging centers are key for outpatient workflows, but lack the scale and capital for the same level of technology refresh. A report from the Competition Commission of India in August 2024 shows that GE had installed 3,671 CT scans in hospitals and clinics in India, demonstrating its central role in the industry. The strategic focus of leading manufacturers on this segment is evident in tailored service contracts and financing solutions designed specifically for large hospital networks, further entrenching their market dominance.
Number of CT scan Machines Installed in Hospitals and Clinics by DMI Equipment Manufacturer in India
|
Manufacturers |
Number of CT Machines Installed |
Market Share |
|
GE |
3,671 |
44.75 |
|
Siemens |
2,570 |
31.34 |
|
Canon and Toshiba |
860 |
10.50 |
|
Philips |
692 |
8.44 |
Source: CCI August 2024
Our in-depth analysis of the market includes the following segments:
|
Segment |
Subsegments |
|
Technology |
|
|
Architecture |
|
|
Application |
|
|
End user |
|
|
System Type |
|
|
Device Portability |
|

Vishnu Nair
Head - Global Business DevelopmentCustomize this report to your requirements — connect with our consultant for personalized insights and options.
Computed Tomography Market - Regional Analysis
North America Market Insights
North America market is dominating and is expected to hold the revenue share of 35.4% by 2035. The market is dominated by the replacement demand and technological adoption. The primary drivers of the market are the strong healthcare spending and advanced infrastructure that facilitates rapid uptake of premium systems such as photon counting and spectral CT. The key trends include the strategic shift of procedures to outpatient settings such as ambulatory surgical centers, driven by the U.S. reimbursement policies from the CMS. Both robust regulatory frameworks from the FDA and Health Canada focus on dose optimization, pushing healthcare providers to replace aging equipment with newer, safer, and more efficient models. The market growth is further sustained by high volumes in oncology and cardiology imaging, supported by established screening programs and an aging population.
The U.S. computed tomography (CT) market is shaped by the dual forces of patient safety regulation and technology-led upgrade cycles. The recent evidence from UC San Francisco in April 2025 estimates that CT scans could account for up to 5% of annual cancer cases, with 103,000 projected cancers linked to 93 million scans in 2023, which is intensifying scrutiny on radiation exposure, mainly in pediatrics and high-frequency adult imaging. Rather than suppressing demand, this is surging the replacement and retrofit activity as hospitals move toward low-dose AI-enabled systems that meet evolving FDA guidance on imaging safety. This regulatory climate directly supports market momentum as seen in Canon Medical’s March 2025 U.S. clearance for AI-enhanced CT innovations that expand access to dose optimization and image quality tools across major care settings.
The Canada computed tomography market is being shaped by the rapid utilization growth and uneven imaging capacity across regions, creating a clear demand signal for system expansion and replacement. The data from the CDA-AMC in October 2025 show that CT and MRI use in Canada has nearly doubled since 2007, with CT sites now performing an average of 16,350 examinations per year and 12,900 scans per unit, indicating sustained pressure on existing imaging fleets. The study highlights a pronounced urban-rural capacity gap where urban CT sites average 23,036 scans annually compared with 8,303 in rural and 5,999 in remote locations, a disparity that is increasingly driving the public investment in regional imaging access and mobile or satellite CT services. In parallel, academic hospitals averaging 29,024 CT exams per site are emerging as key upgrade markets for high-throughput systems, while community hospitals represent steady volume opportunities for mid-range replacements.
APAC Market Insights
Asia Pacific is the fastest-growing market and is expected to grow at a CAGR of 6.8% during the forecast period 2026 to 2035. The market is driven by massive government healthcare investment, rising medical tourism, and the increasing prevalence of chronic diseases. The growth is diversified in mature markets such as Japan and South Korea, and demand is fueled by the replacement of aging systems with premium AI-integrated spectral and photon-counting CT scanners. In high-growth economies such as China and India, the expansion is driven by the large-scale public health initiatives to install basic and mid-range CTs, aiming to improve access. A key regional trend is the rise of strong domestic manufacturers such as China’s United Imaging and India’s Trivitron, which are competing on cost and offering custom solutions.
China computed tomography (CT) market is entering a technology-driven expansion phase, underscored by the 2025 approval of Neusoft Medical Systems. NeuViz P10 photon counting CT, by the National Medical Products Administration the first system of its kind cleared in the country. This milestone positions China not only as a major consumer but also as a source of next-gen CT innovation stimulation, domestic replacement demand in tertiary hospitals and research centers seeking ultra-high resolution, low-dose imaging. The approval aligns with national healthcare modernization priorities under policy such as Healthy China 2030, which highlights advanced diagnostics, early disease detection, and reduced radiation exposure. The country is advancing with the improvement in the imaging capacity across provincial and country-level hospitals. Photon counting technology is expected to catalyze a premium segment within the CT market, supporting higher system values, strong local manufacturing competitiveness, and increased export potential of Chinese-made CT platforms into emerging markets.
India is experiencing a transformative growth and is primarily driven by the government’s dual strategy of expanding public healthcare access and aggressively promoting domestic manufacturing. Flagship initiatives such as Ayushman Bharat are establishing thousands of new health and wellness centers, creating a massive demand for diagnostic imaging. Further, the production-linked incentive scheme for medical devices is catalyzing local production to reduce the heavy import dependency. This policy-driven environment is shifting market dynamics with domestic and international manufacturers setting up local assembly lines to cater to the demand for cost-effective rugged systems suitable for high-volume, varied infrastructure settings.
List of Approved Companies under the PLI Scheme
|
Name of approved Applicant |
Name of Eligible Products |
Committed Investment (in INR Cr) |
|
Siemens Healthcare Private Limited |
CT Scan and MRI |
91.91 |
|
Allengers Medical Systems Limited (AMSL) |
CT Scan, MRI, Ultrasonography, Xray, Cath Lab, Positron Emission Tomography (PET) Systems, Single Photon Emission Tomography (SPECT), Mammography and C arm. |
50.00 |
|
Allengers OEM Private Limited (AOPL) |
X-ray Tubes, Collimators, Flat Panel Detector and Monitors’ |
40.00 |
|
Trivitron Healthcare Private Limited |
CT Scan, MRI, Ultrasonography, X Ray Equipment, Mammography, C-Arm and Cath Lab |
25.30 |
|
Wipro GE Healthcare Private Limited (WGHPL) |
‘CT Scan’, ‘Cath Lab’ and ‘Ultrasonography’ |
50.22 |
|
Philips Global Business Services LLP
|
MRI Coils |
103.46 |
Source: CCI August 2024
Europe Market Insights
The universal need for advanced diagnostic tools amid an aging population and the high prevalence of chronic diseases such as cancer and cardiovascular conditions are driving the Europe computed tomography market. The market is mature with growth primarily fueled by the replacement of aging equipment with new, more dose-efficient and technologically advanced systems. The key trends include the strong centralization of procurement in public healthcare systems and robust regulatory harmonization under the EU’s new Medical Device Regulation. The market witnesses a significant rise in demand and is driven in part by coordinated investments such as the EU4Health programme, which allocated a significant amount to strengthen health systems' resilience, including diagnostic infrastructure.
Germany computed topography market is one of the most structurally strong in Europe supported by its position as the largest medical device market in the region and the third largest globally with annual medical technology revenues of approximately USD 44 billion accounting for 26.5% of the Europe market, based on ITA August 2025. Healthcare contributes 12.8% of Germany’s GDP with USD 496 billion in gross value added in 2024 creating a stable funding base for hospital infrastructure and diagnostic imaging investment. Further, the country’s advanced manufacturing ecosystems strengthens the market exemplified by Siemens Healthineers photon counting CT systems developed domestically and widely exported with the U.S. accountign for 40% of shipments. The trade flows underline the central role in imaging equipment supply chains with USD 9.82 billion in imports of optical and medical apparatus in 2023 including USD 3.17 billion in medical instruments from the U.S. Together the healthcare speding and trade data position Germany as the core demand and innovation hub in the Europe computed tomography (CT) market.
The UK computed tomography market is being shaped by sustained pressure across the NHS, which is driving stimulated demand for diagnostic imaging capacity, faster scan turnaround, and system upgrades. According to the NHS December 2024 data, the A&E attendances in England reached 2.36 million, the highest October on record, while the emergency admissions rose to 567,000, intensifying reliance on rapid CT imaging in emergency and acute care pathways. At the same time, diagnostic backlogs remain a policy priority thought the share of patients waiting over 6 weeks for tests improved to 22.7% in September 2024. Volumes continue to rise as cancer referrals and GP appointments hit record levels, with 1.68 million GP appointments per working day. These pressures are translating into stronger procurement of high-throughput CT systems, AI-enabled workflow solutions, and mobile imaging units as NHS trusts seek to expand capacity, shorten cancer and emergency pathways, and improve winter resilience, positioning the UK as the top CT market over the coming years.
Key Computed Tomography Market Players:
- GE HealthCare (U.S.)
- Siemens Healthineers (Germany)
- Koninklijke Philips (Netherlands)
- Canon Medical Systems (Japan)
- United Imaging Healthcare (China)
- Neusoft Medical Systems (China)
- Shenzhen Anke High-tech Co., Ltd. (China)
- Samsung Medison (South Korea)
- Hitachi Healthcare (Japan)
- Shimadzu Corporation (Japan)
- Carestream Health (U.S.)
- NeuroLogica Corp. (Samsung) (U.S.)
- Planmed Oy (Finland)
- AGFA HealthCare (Belgium)
- Koning Corporation (U.S.)
- CurveBeam AI (U.S.)
- MinFound Medical Systems (China)
- J.Morita Corp. (Japan)
- Genoray Co., Ltd (South Korea)
- Vatech (South Korea)
- Company Overview
- Business Strategy
- Key Product Offerings
- Financial Performance
- Key Performance Indicators
- Risk Analysis
- Recent Development
- Regional Presence
- SWOT Analysis
- GE HealthCare is a leading player in the computed tomography market and drives innovation with its Revolution and Revolution Apex platforms. Their strategic initiatives focus on integrating advanced AI for workflow automation and pioneering the spectral imaging technology with its Deep Silicon detector to provide detailed material characterization. A key advancement is the adoption of one contrast agent for both CT and Cardiac MRI, enhancing the efficiency in the multi-modality cardiac diagnostics and streamlining patient pathways in cardiovascular care. Based on the 2024 annual report, the company has made a YoY growth of 2%.
- Siemens Healthineers aggressively shapes the market via its NAEOTOM Alpha, the world’s first photon-counting CT system. This quantum leap in detector technology provides ultra-high-resolution imaging at significantly lower radiation doses. Their strategy involves embedding AI not just for image reconstruction but across the entire clinical workflow, from personalizing scanning protocols for improved cardiac and oncological outcomes. In 2025, the company will have spent €1,958 million in R&D for innovating existing products and solutions.
- Koninklijke Philips differentiates itself in the computed tomography market with a strong focus on outcome-driven integrated solutions. Their latest spectral CT systems, such as the Spectral CT 7500, are designed for first-time right diagnosis by defaulting to spectral data acquisition. A major strategic advancement is the seamless integration of CT data with intraoperative guidance in hybrid suites and ambulatory monitoring data, creating a holistic patient management ecosystem that connects diagnostic imaging to therapy planning and longitudinal care.
- Canon Medical Systems competes in the market by emphasizing precision patient safety and operational efficiency. Their Aquilion OE/ PRISM edition platforms offer wide area detector coverage for whole organ dynamic imaging. A key advancement is the deep integration of an advanced intelligent clear IQ engine for AI-powered deep learning reconstruction, which dramatically improves the image quality from low-dose scans. This supports clearer cardiac functional analysis and enhances the diagnostic confidence in fast-paced clinical environments.
- United Imaging Healthcare has emerged as a formidable innovator in the global market, challenging incumbents with high-value technology. Their uCT series features industry-leading spatial resolution and advanced iterative reconstruction. A significant strategic advancement is their development of integrated mobile CT solutions and modular emergency/OR systems, which democratize access to high-end imaging. Further, they are pioneering the clinical integration of CT data with radiotherapy planning systems to streamline oncology workflows from diagnosis to treatment.
Here is a list of key players operating in the global market:
The global computed tomography (CT) market is defined by intense competition and technological consolidation. The landscape is dominated by a few multinational giants from the U.S., Europe, and Japan, which control the majority of the market share via continuous innovation in photon-counting spectral imaging and AI-driven workflow solutions. For example, in June 2024, Fujifilm launched the 128-slice computed tomography system, FCT iStream, with vision modeling iterative reconstruction. This innovation aims to enhance the image quality and workflow. The strategic initiatives are heavily focused on strategic partnerships, mergers, and acquisitions to expand product portfolios and significant R&D investments to develop lower-dose, faster, and more specialized systems. Emerging players from countries such as South Korea, China, and India are gaining traction by offering cost-effective alternatives and boosting their presence in growth markets, increasing the competitive pressure.
Corporate Landscape of the Computed Tomography (CT) Market:
Recent Developments
- In November 2025, Royal Philips, a global leader in health technology, announced the launch of Verida, the world’s first detector-based spectral CT fully powered by AI. This marks a transformative milestone in CT, with AI optimizing the entire imaging chain, lowering system noise, elevating image quality, and accelerating clinical workflow.
- In March 2025, GE HealthCare introduced Revolution Vibe, which is a new computed tomography (CT) system with Unlimited One-Beat Cardiac imaging to deliver consistent, high-quality images for patients, even in challenging cases like atrial fibrillation and heavily calcified coronaries.
- In December 2024, Siemens Healthineers introduced the Naeotom Alpha class, including a second dual-source scanner, Naeotom Alpha.Pro, and the world’s first single-source scanner with photon-counting technology, Naeotom Alpha.Prime.
- Report ID: 8338
- Published Date: Jan 13, 2026
- Report Format: PDF, PPT
- Explore a preview of key market trends and insights
- Review sample data tables and segment breakdowns
- Experience the quality of our visual data representations
- Evaluate our report structure and research methodology
- Get a glimpse of competitive landscape analysis
- Understand how regional forecasts are presented
- Assess the depth of company profiling and benchmarking
- Preview how actionable insights can support your strategy
Explore real data and analysis
Frequently Asked Questions (FAQ)
About this Report
Connect with our Expert


Copyright @ 2026 Research Nester. All Rights Reserved.
