Veterinary Computed Tomography Scanner Market Outlook:
Veterinary Computed Tomography Scanner Market size was valued at USD 210.6 million in 2025 and is projected to reach USD 383.8 million by the end of 2035, rising at a CAGR of 6.7% during the forecast period, i.e., 2026-2035. In 2026, the industry size of the veterinary computed tomography scanner is estimated at USD 224.3 million.
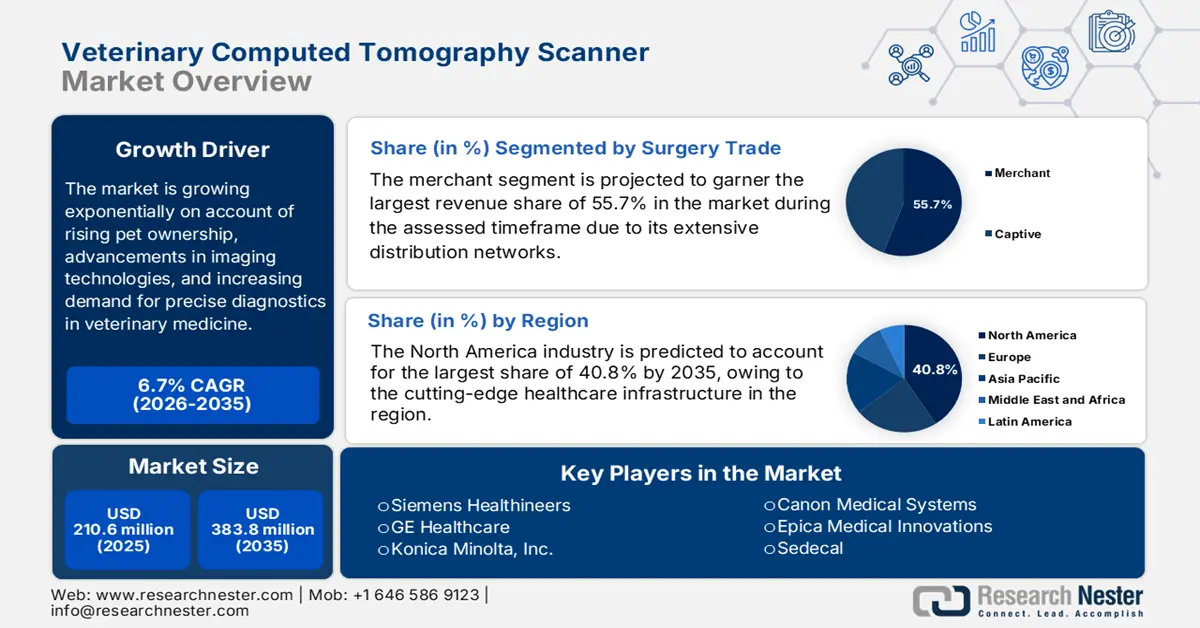
The veterinary computed tomography scanner market is growing exponentially on account of rising pet ownership, advancements in imaging technologies, and increasing demand for precise diagnostics in veterinary medicine. Testifying the same APA reported that in 2024, the U.S. pet market saw USD 152 billion in sales, wherein the pet food and treats leading at USD 65.8 billion, followed by veterinary care at USD 39.8 billion, supplies including live animals and OTC medicine at USD 33.3 billion, and other services such as boarding, grooming, and insurance totaling USD 13 billion thereby denoting a positive market outlook.
Furthermore, the private and public insurers are an asset of this landscape, providing an encouraging opportunity for the pioneers in this field. The August 2025 report from the USDA Veterinary Services Grant Program aims to address veterinarian shortages and improve access to animal healthcare, particularly in underserved rural areas. It also stated that it offers two types of grants, i.e., education, extension, and training to support veterinary workforce development, and rural practice enhancement to establish or expand veterinary practices in rural communities, and is currently operating with a USD 4 million budget.
Key Veterinary Computed Tomography Scanner Market Insights Summary:
Regional Highlights:
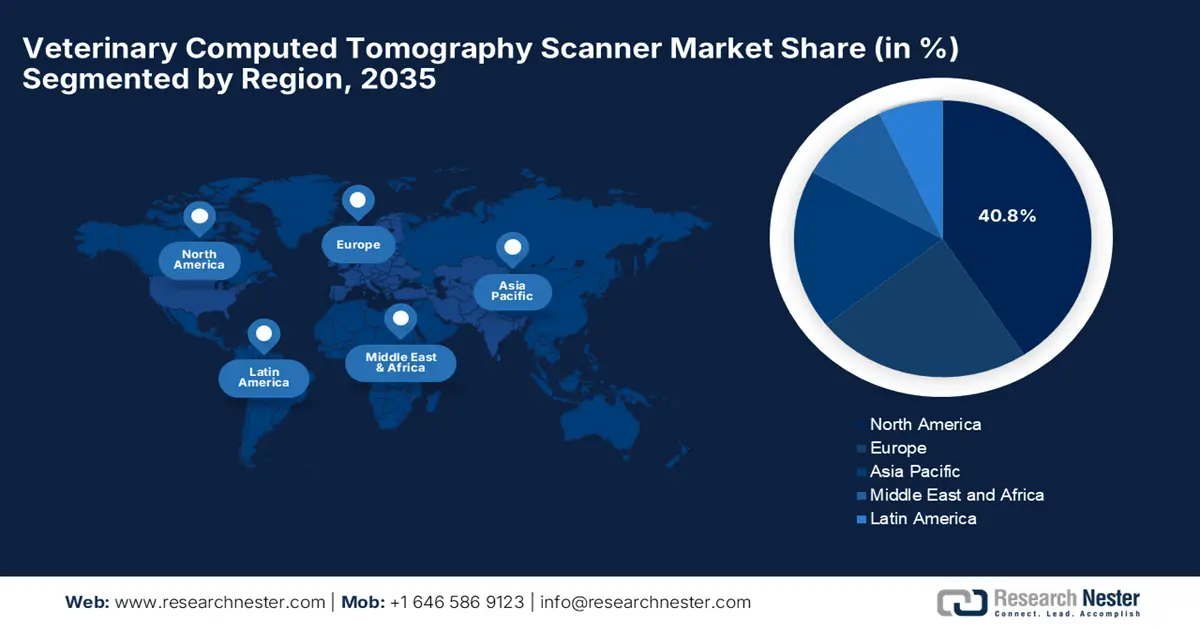
- North America is predicted to hold a 40.8% share in the veterinary computed tomography scanner market by the end of 2035, owing to advanced healthcare infrastructure and increased benefits from pet care.
- Asia Pacific is expected to emerge as the fastest growing region in the veterinary computed tomography scanner market during the forecast period 2026-2035, driven by rising pet ownership and advancements.
Segment Insights:
- The trade merchant segment is projected to garner the largest revenue share of 55.7% in the veterinary computed tomography scanner market during the forecast period 2026-2035, propelled by extensive distribution networks and increasing adoption of veterinary CT scanners.
- The veterinary hospitals segment is expected to attain a share of 48.4% by 2035, stimulated by rising awareness of advanced diagnostic procedures in animal healthcare.
Key Growth Trends:
- Rising disease burden
- Continued advancements & innovations
Major Challenges:
- High capital investments
- Lack of skilled workforce
Key Players: GE Healthcare, Konica Minolta, Inc., Canon Medical Systems, Epica Medical Innovations, Sedecal, Shimadzu Corporation, Carestream Health, Samsung Medison, IDEXX Laboratories, Inc., Mindray Animal Medical, Planmed Oy, DBC Healthcare, Esaote S.p.A., VetZ GmbH, Lepu Medical Technology, iM3 Vet Pty Ltd, Allengers Medical Systems, DMS Imaging, NeuroLogica Corporation.
Global Veterinary Computed Tomography Scanner Market Forecast and Regional Outlook:
Market Size & Growth Projections:
- 2025 Market Size: USD 15.5 billion
- 2026 Market Size: USD 17.8 billion
- Projected Market Size: USD 61.8 billion by 2035
- Growth Forecasts: 14.8% CAGR (2026-2035)
Key Regional Dynamics:
Largest Region: North America (40.8% share by 2035)
Fastest Growing Region: Asia Pacific
Dominating Countries: United States, Japan, Germany, Australia, South Korea
Emerging Countries: India, China, Brazil, Mexico, Indonesia
Last updated on : 30 September, 2025
Veterinary Computed Tomography Scanner Market - Growth Drivers and Challenges
Growth Drivers
- Rising disease burden: This is the primary fueling factor for the market to capture the expedited revenue. Besides the conditions, such as cancers, neurological disorders, and musculoskeletal injuries, are increasing the need for high-resolution imaging for diagnosis and treatment. In this regard, a February 2023 NIH article revealed that the study of 3,452 dogs diagnosed with cancer revealed a median age at diagnosis of 8.8 years, wherein heavier dogs developed cancer earlier, those ≥75 kg had a median diagnosis age of just 5 years, while smaller dogs who are 2.5kg to 5 kg were diagnosed around 11 years.
- Continued advancements & innovations: The enhanced efforts from pioneers across the world to develop new novel technologies are another driver that is positively impacting the market. For instance, in May 2024, Parkside Vets reported that it is offering on-site CT scanning, which remarkably enhances the diagnostic capabilities by providing high-resolution, 3D cross-sectional images, hence allowing a steady cash influx in this field.
- Expansion of veterinary healthcare infrastructure: The rapidly escalating number of veterinary hospitals, specialty referral centers, research institutions, and even mobile CT services is expanding capacity, fostering a favourable business environment for the market. In July 2025, Zigly reported that it had expanded into Mumbai by acquiring the established Small Animal Clinic & Surgical Centre, thereby transforming it into a pet care ecosystem that spans a 1,520 sq. ft. center offering veterinary services, diagnostics, grooming, pharmacy, and pet products.
Global Pet Industry Spending by Country and Category
|
Country/Region |
Year |
Spending Amount |
Notes |
|
U.S. |
2023 |
USD 147 billion |
Total spending on pets |
|
U.K. |
2022 |
£9.88 billion |
182% increase since 2005 |
|
Canada |
2024 |
USD 3,020 per dog owner |
Average annual cost for dog ownership |
|
European Union |
2022 |
€29.1 billion |
Spending on pet products and services |
|
Australia |
2022 |
USD 33.2 billion |
Total pet spending |
|
Latin America |
2023 |
USD 10.7 billion |
Total pet industry spending |
|
Latin America (projected) |
2032 |
USD 18.1 billion |
Projected pet care market size |
Source: WAF
Key Trends Shaping the Veterinary Computed Tomography Scanner Market 2024
|
Initiative |
Organization |
Description |
|
MyVet Imaging CT Launch at IVECCS |
Patterson Veterinary / MyVet Imaging |
Features a compact veterinary CT scanner for high-quality 3D imaging of small to large animals. |
|
Qalibra CT Scanner Installation for Horses |
Colorado State University (CSU) |
Installed a standing CT scanner enabling high-res 3D scans of equine limbs and head without anesthesia. |
|
Mella & Vetster Telemedicine Partnership |
Mella Pet Care & Vetster |
Integrated app-based telehealth solution offering 24/7 vet access in the U.S., Canada, and the UK. |
Source: Company Official Press Releases
Challenges
- High capital investments: The existence of huge investments in healthcare facilities is the biggest barrier to the market. Also, the ongoing operational costs and acquisition of advanced systems can create a restriction for small-scale veterinary clinics. Also, maintenance adds more expenses to these, limiting CT scanner adoption to larger hospitals and specialized veterinary centers.
- Lack of skilled workforce: This is yet another challenge that restricts the upliftment of the market. Veterinary radiologists with expertise in CT imaging are very low, which is causing an underutilization of the technology and longer waiting times for diagnostic procedures. Therefore, this scarcity of qualified personnel affects the efficiency and accessibility of CT-based diagnostics in this field.
Veterinary Computed Tomography Scanner Market Size and Forecast:
| Report Attribute | Details |
|---|---|
|
Base Year |
2025 |
|
Forecast Year |
2026-2035 |
|
CAGR |
6.7% |
|
Base Year Market Size (2025) |
USD 210.6 million |
|
Forecast Year Market Size (2035) |
USD 383.8 million |
|
Regional Scope |
|
Veterinary Computed Tomography Scanner Market Segmentation:
Trade Segment Analysis
Based on trade merchant segment is projected to garner the largest revenue share of 55.7% in the market during the assessed timeframe. The dominance of the segment is attributable to its extensive distribution networks and increasing adoption of veterinary CT scanners by these vendors. Also, the ability to reach diverse geographic markets supports the growth in this segment, hence denoting a positive market outlook.
End user Segment Analysis
In terms of the user, the veterinary hospitals segment is projected to attain a share of 48.4% in the market by the end of 2035. The rising awareness of advanced diagnostic procedures in animal healthcare is the key factor fueling growth in this subtype. Most of the prominent organizations emphasize the importance of veterinary diagnostics in zoonotic disease management and encourage veterinary healthcare hospitals to make investments in this field.
Technology Segment Analysis
Based on technology, the multi-slice CT technology segment is expected to gain a share of 45.4% in the market during the analyzed timeframe. The growth in the segment originates from its faster imaging and higher resolution, which are highly essential for complex veterinary diagnostics. In September 2024, IMV Imaging and Asto CT announced a strategic partnership that aims to combine IMV’s extensive experience in ultrasound, X-ray, CT, MRI, and PACS technologies with Asto CT’s Equina standing CT scanner to enhance diagnostic capabilities for veterinary professionals across all nations.
Our in-depth analysis of the global market includes the following segments:
|
Segment |
Subsegments |
|
Trade |
|
|
End user |
|
|
Technology |
|
|
Type |
|
|
Application |
|

Vishnu Nair
Head - Global Business DevelopmentCustomize this report to your requirements — connect with our consultant for personalized insights and options.
Veterinary Computed Tomography Scanner Market - Regional Analysis
North America Market Insights
North America market is anticipated to account for the largest share of 40.8% by the end of the forecast timeline. Factors such as increased benefits from pet care and cutting-edge healthcare infrastructure are readily driving the market in the region. As evidence, the 2021 HABRI Survey reported a significant majority of pet owners report improved mental and physical health due to pet ownership, with 87% experiencing mental health benefits and 76% noting overall health improvements, wherein veterinarians play a pivotal role, with many pet owners valuing discussions on the human-animal bond and its health impacts.
The market in the U.S. is gaining increased traction due to the infusion of advancements in CT scanner systems, increasing pet care expenditures, and the corporate veterinary chain. In June 2025, WFO reported that in 2023, U.S. citizens spent a total of USD 147 billion on their pets, wherein the number of insured pets in the U.S. rose by 17.1%, showing increased investment in pet health. The report also stated that on average, dog owners spend about USD 912 annually, while cat owners spend around USD 653, denoting a positive market outlook.
The veterinary computed tomography scanner market in Canada is significantly growing due to the increasing investments from the administrative bodies. Testifying this in October 2024, Agriculture and Agri-Food Canada announced a funding commitment of up to USD 13,343,409 over five years to Animal Health Canada through the AgriAssurance Program. Besides the investment, the program supports three key projects aimed at improving disease surveillance, emergency management, and animal care standards across the country’s vast geography.
National Institute of Food and Agriculture Funded Veterinary Training and Workforce Development Projects
|
Project Title |
Recipient Organization |
Project Start Date |
Project End Date |
|
Partnering with communities to enhance rural veterinary experiences in a DVM training program |
LOUISIANA STATE UNIVERSITY |
09/15/2025 |
09/14/2028 |
|
Enhancement of Livestock Veterinary Education and Livestock Extension |
UNIVERSITY OF ALASKA FAIRBANKS |
09/01/2025 |
08/31/2028 |
|
Developing a veterinary workforce to be successful in rural food animal practice |
MISSISSIPPI STATE UNIVERSITY |
08/01/2024 |
07/31/2027 |
|
Texas A&M Agrilife Extension Veterinary Science Certificate Program |
TEXAS A&M AGRILIFE EXTENSION SERVICE |
08/01/2024 |
07/31/2027 |
|
Business Fundamentals for Veterinary Practice Startup and Ownership in Rural Communities |
UNIVERSITY OF MISSOURI SYSTEM |
09/01/2023 |
08/31/2026 |
Source: USDA
APAC Market Insights
Asia Pacific is likely to showcase the fastest growth in the veterinary computed tomography scanner market during the analyzed timeframe. The growth in the region is effectively attributable to the increasing pet ownership and advancements in veterinary care. On the other hand, prominent countries such as Japan, Australia, and South Korea are leading in adopting advanced diagnostic technologies, allowing a steady cash influx in this field. Furthermore, a rising demand for non-invasive imaging techniques is also contributing to the expansion of veterinary imaging services across the region.
China is the prominent player in the market, primarily fueled by a growing pet population and heightened awareness of animal health. Besides, the market is witnessing increased investments in veterinary infrastructure and a shift towards advanced diagnostic tools. In February 2023, ITA reported that in 2021, the country’s 58 million pet cats and 54 million pet dogs benefited from USD 38.5 billion in spending, which is a 20.6% increase from the previous year, hence suitable for standard market growth.
India is gaining enhanced traction in the veterinary computed tomography scanner market on account of rising demand for quality animal healthcare and advancements in veterinary diagnostics. In April 2025, IBEF reported that the country has the third-largest pet population globally, which has 32 million pets and is expected to rise to 51 million by the end of 2028. Besides the U.S., Godrej Pet Care, a subsidiary of Godrej Consumer Products, plans to invest Rs. 500 crore (USD 59 million) over the next five years to capture this emerging opportunity.
Europe Market Insights
Europe in the veterinary computed tomography scanner market is projected to grow at a notable pace during the forecast period. This growth is fueled by components, including robust health and medical facilities, as well as strict animal welfare regulations. Additionally, the region’s progression rate is attributed to the existence of all accredited veterinary hospital centers, along with the dispersion of pet insurance. Other trends, such as artificial intelligence adoption, portable CT implementation, and administrative funding, also positively impact the market development in the region.
The veterinary computed tomography scanner market in Germany is gaining more exposure since it is anticipated to maintain the region’s largest revenue share by the end of 2035, due to the world’s most suitable and standard animal health regulatory strategies. In June 2025, Siemens Healthineers reported that it received the U.S. FDA Clearance for Magnetom Flow.Ace, which is the first helium-free 1.5 T MRI scanner for human and veterinary use and reduces helium dependency and eliminates the need for a quench pipe.
There is a huge growth opportunity for the market in the UK since it accounts for most of the region’s veterinary CT scanner requirements, which is attributed to the largest per capita pet insurance coverage policies. For instance, in December 2024, the Royal Veterinary College reported that it launched a large-bore CT scanner, which revolutionizes equine imaging by enabling scans of previously inaccessible body regions in standing, sedated horses. The system allows veterinarians to better diagnose conditions affecting the head, neck, limbs, and joints, improving early detection of diseases.
Key Veterinary Computed Tomography Scanner Market Players:
- Siemens Healthineers
- Company Overview
- Business Strategy
- Key Product Offerings
- Financial Performance
- Key Performance Indicators
- Risk Analysis
- Recent Development
- Regional Presence
- SWOT Analysis
- GE Healthcare
- Konica Minolta, Inc.
- Canon Medical Systems
- Epica Medical Innovations
- Sedecal
- Shimadzu Corporation
- Carestream Health
- Samsung Medison
- IDEXX Laboratories, Inc.
- Mindray Animal Medical
- Planmed Oy
- DBC Healthcare
- Esaote S.p.A.
- VetZ GmbH
- Lepu Medical Technology
- iM3 Vet Pty Ltd
- Allengers Medical Systems
- DMS Imaging
- NeuroLogica Corporation
The veterinary computed tomography scanner market is highly and effectively consolidated, with the existence of key organizations. Organizations such as Siemens Healthineers, GE Healthcare, Konica Minolta, Inc., together hold the largest revenue shares. Besides, noble strategies, including integration, expansion in portable CT, subscription models, and emerging marketing focus, are positively impacting the market upliftment internationally. Moreover, Mindray & Allengers effectively influence localized manufacturing and production processes to reduce prices, thus making them efficient for the global market.
Below is the list of some prominent players operating in the global market:
Recent Developments
- In October 2024, WOORIEN reported that it has launched the MyVet CT Plus, which is an advanced veterinary imaging solution that significantly reduces acquisition time by up to 80% while enhancing image quality with spiral-linear technology.
- In June 2024, Insight Mobile Veterinary Diagnostics announced that it had launched the mobile CT scanner housed in a truck, serving animal patients across Victoria, which comprises a Samsung NeuroLogica human-quality CT scanner supervised by a veterinarian and nurse.
- Report ID: 4325
- Published Date: Sep 30, 2025
- Report Format: PDF, PPT
- Explore a preview of key market trends and insights
- Review sample data tables and segment breakdowns
- Experience the quality of our visual data representations
- Evaluate our report structure and research methodology
- Get a glimpse of competitive landscape analysis
- Understand how regional forecasts are presented
- Assess the depth of company profiling and benchmarking
- Preview how actionable insights can support your strategy
Explore real data and analysis
Frequently Asked Questions (FAQ)
Veterinary Computed Tomography Scanner Market Report Scope
Free Sample includes current and historical market size, growth trends, regional charts & tables, company profiles, segment-wise forecasts, and more.
Connect with our Expert


Copyright @ 2026 Research Nester. All Rights Reserved.
