Global Carbon Black Market
1. An Outline of the Global Carbon Black Market
1.1. Market Definition and Segmentation
1.2. Study Assumptions and Abbreviations
2. Research Methodology & Approach
2.1. Primary Research
2.2. Secondary Research
2.3. Data Triangulation
2.4. SPSS Methodology
3. Executive Summary
4. Growth Drivers
5. Major Roadblocks
6. Opportunities
7. Prevalent Trends
8. Government Regulation
9. Growth Outlook
10. Competitive White Space Analysis – Identifying Untapped Market Gaps
11. Risk Overview
12. SWOT
13. Technological Advancement
14. Technology Maturity Matrix for the Carbon Black Market: Recent News
15. Regional Demand
16. Global Carbon Black by Geography – Strategic Comparative Analysis
17. Strategic Segment Analysis: Carbon Black Demand Landscape
18. Carbon Black Demand Trends Driven by technological innovations, shift toward eco-friendly materials, and expanding plastic & automotive applications. (2026-2036)
19. Root Cause Analysis (RCA) for discovering problems of the Carbon Black Market
20. Porter Five Forces
21. PESTLE
22. Comparative Positioning
23. Global Carbon Black – Key Player Analysis (2036)
24. Competitive Landscape: Key Suppliers/Players
25. Competitive Model: A Detailed Inside View for Investors
26. Company Market Share, 2036 (%)
26.1. Cabot Corporation
26.2. Birla Carbon
26.3. Orion Engineered Carbons
26.4. Continental Carbon Company
26.5. Tokai Carbon Co., Ltd.
26.6. OCI Company Ltd.
26.7. Phillips Carbon Black Limited
26.8. Jiangxi Black Cat Carbon Black Inc., Ltd.
26.9. Cancarb Limited
26.10. China Synthetic Rubber Corporation (CSRC)
26.11. Mitsubishi Chemical Corporation
26.12. Tokushu Tokai Carbon Co., Ltd.
26.13. Asahi Carbon Co., Ltd.
26.14. Denka Company Limited
26.15. Lion Specialty Chemicals Co., Ltd.
27. Global Carbon Black Market Outlook
27.1. Market Overview
27.1.1. Market Revenue by Value (USD Million), by Volume (Thousand Tons), and Compound Annual Growth Rate (CAGR)
27.2. Carbon Black Market Segmentation Analysis (2026-2036)
27.2.1. By Type
27.2.1.1. Furnace Black, Market Value (USD Million), and CAGR, 2026-2036F
27.2.1.2. Thermal Black, Market Value (USD Million), and CAGR, 2026-2036F
27.2.1.3. Acetylene Black, Market Value (USD Million), and CAGR, 2026-2036F
27.2.1.4. Channel Black, Market Value (USD Million), and CAGR, 2026-2036F
27.2.1.5. Others, Market Value (USD Million), and CAGR, 2026-2036F
27.2.2. By Grade
27.2.2.1. Standard Grade, Market Value (USD Million), and CAGR, 2026-2036F
27.2.2.2. Specialty Grade, Market Value (USD Million), and CAGR, 2026-2036F
27.2.3. By Grade Type
27.2.3.1. N330, Market Value (USD Million), and CAGR, 2026-2036F
27.2.3.2. N339, Market Value (USD Million), and CAGR, 2026-2036F
27.2.3.3. N347, Market Value (USD Million), and CAGR, 2026-2036F
27.2.3.4. N375, Market Value (USD Million), and CAGR, 2026-2036F
27.2.3.5. N550, Market Value (USD Million), and CAGR, 2026-2036F
27.2.3.6. N660, Market Value (USD Million), and CAGR, 2026-2036F
27.2.3.7. N762, Market Value (USD Million), and CAGR, 2026-2036F
27.2.3.8. N774, Market Value (USD Million), and CAGR, 2026-2036F
27.2.3.9. N990, Market Value (USD Million), and CAGR, 2026-2036F
27.2.3.10. Others, Market Value (USD Million), and CAGR, 2026-2036F
27.2.4. By Application
27.2.4.1. Tires, Market Value (USD Million), and CAGR, 2026-2036F
27.2.4.2. High Performance Coatings, Market Value (USD Million), and CAGR, 2026-2036F
27.2.4.3. Plastics, Market Value (USD Million), and CAGR, 2026-2036F
27.2.4.4. Others, Market Value (USD Million), and CAGR, 2026-2036F
27.2.5. Regional Synopsis, Value (USD Million), 2026-2036
27.2.5.1. North America Market Value (USD Million) and CAGR & Y-o-Y Growth Trend, 2026-2036F
27.2.5.2. Europe Market Value (USD Million) and CAGR & Y-o-Y Growth Trend, 2026-2036F
27.2.5.3. Asia Pacific, excluding Japan Market Value (USD Million) and CAGR & Y-o-Y Growth Trend, 2026-2036F
27.2.5.4. Latin America Market Value (USD Million) and CAGR & Y-o-Y Growth Trend, 2026-2036F
27.2.5.5. Middle East and Africa Market Value (USD Million) and CAGR & Y-o-Y Growth Trend, 2026-2036F
28. North America Market
28.1. Overview
28.1.1. Market Value (USD Million), Current and Future Projections, 2026-2036
28.1.2. Increment $ Opportunity Assessment, 2026-2036
28.2. Segmentation (USD Million), 2026-2036, By
28.2.1. By Type
28.2.1.1. Furnace Black, Market Value (USD Million), and CAGR, 2026-2036F
28.2.1.2. Thermal Black, Market Value (USD Million), and CAGR, 2026-2036F
28.2.1.3. Acetylene Black, Market Value (USD Million), and CAGR, 2026-2036F
28.2.1.4. Channel Black, Market Value (USD Million), and CAGR, 2026-2036F
28.2.1.5. Others, Market Value (USD Million), and CAGR, 2026-2036F
28.2.2. By Grade
28.2.2.1. Standard Grade, Market Value (USD Million), and CAGR, 2026-2036F
28.2.2.2. Specialty Grade, Market Value (USD Million), and CAGR, 2026-2036F
28.2.3. By Grade Type
28.2.3.1. N330, Market Value (USD Million), and CAGR, 2026-2036F
28.2.3.2. N339, Market Value (USD Million), and CAGR, 2026-2036F
28.2.3.3. N347, Market Value (USD Million), and CAGR, 2026-2036F
28.2.3.4. N375, Market Value (USD Million), and CAGR, 2026-2036F
28.2.3.5. N550, Market Value (USD Million), and CAGR, 2026-2036F
28.2.3.6. N660, Market Value (USD Million), and CAGR, 2026-2036F
28.2.3.7. N762, Market Value (USD Million), and CAGR, 2026-2036F
28.2.3.8. N774, Market Value (USD Million), and CAGR, 2026-2036F
28.2.3.9. N990, Market Value (USD Million), and CAGR, 2026-2036F
28.2.3.10. Others, Market Value (USD Million), and CAGR, 2026-2036F
28.2.4. By Application
28.2.4.1. Tires, Market Value (USD Million), and CAGR, 2026-2036F
28.2.4.2. High Performance Coatings, Market Value (USD Million), and CAGR, 2026-2036F
28.2.4.3. Plastics, Market Value (USD Million), and CAGR, 2026-2036F
28.2.4.4. Others, Market Value (USD Million), and CAGR, 2026-2036F
28.2.5. Country Level Analysis, Value (USD Million)
28.2.5.1. U.S. Market Value (USD Million) and CAGR & Y-o-Y Growth Trend, 2026-2036F
28.2.5.2. Canada Market Value (USD Million) and CAGR & Y-o-Y Growth Trend, 2026-2036F
29. Europe Market
29.1. Overview
29.1.1. Market Value (USD Million), Current and Future Projections, 2026-2036
29.1.2. Increment $ Opportunity Assessment, 2026-2036
29.2. Segmentation (USD Million), 2026-2036, By
29.2.1. By Type
29.2.1.1. Furnace Black, Market Value (USD Million), and CAGR, 2026-2036F
29.2.1.2. Thermal Black, Market Value (USD Million), and CAGR, 2026-2036F
29.2.1.3. Acetylene Black, Market Value (USD Million), and CAGR, 2026-2036F
29.2.1.4. Channel Black, Market Value (USD Million), and CAGR, 2026-2036F
29.2.1.5. Others, Market Value (USD Million), and CAGR, 2026-2036F
29.2.2. By Grade
29.2.2.1. Standard Grade, Market Value (USD Million), and CAGR, 2026-2036F
29.2.2.2. Specialty Grade, Market Value (USD Million), and CAGR, 2026-2036F
29.2.3. By Grade Type
29.2.3.1. N330, Market Value (USD Million), and CAGR, 2026-2036F
29.2.3.2. N339, Market Value (USD Million), and CAGR, 2026-2036F
29.2.3.3. N347, Market Value (USD Million), and CAGR, 2026-2036F
29.2.3.4. N375, Market Value (USD Million), and CAGR, 2026-2036F
29.2.3.5. N550, Market Value (USD Million), and CAGR, 2026-2036F
29.2.3.6. N660, Market Value (USD Million), and CAGR, 2026-2036F
29.2.3.7. N762, Market Value (USD Million), and CAGR, 2026-2036F
29.2.3.8. N774, Market Value (USD Million), and CAGR, 2026-2036F
29.2.3.9. N990, Market Value (USD Million), and CAGR, 2026-2036F
29.2.3.10. Others, Market Value (USD Million), and CAGR, 2026-2036F
29.2.4. By Application
29.2.4.1. Tires, Market Value (USD Million), and CAGR, 2026-2036F
29.2.4.2. High Performance Coatings, Market Value (USD Million), and CAGR, 2026-2036F
29.2.4.3. Plastics, Market Value (USD Million), and CAGR, 2026-2036F
29.2.4.4. Others, Market Value (USD Million), and CAGR, 2026-2036F
29.2.5. Country Level Analysis, Value (USD Million)
29.2.5.1. UK Market Value (USD Million) and CAGR & Y-o-Y Growth Trend, 2026-2036F
29.2.5.2. Germany Market Value (USD Million) and CAGR & Y-o-Y Growth Trend, 2026-2036F
29.2.5.3. France Market Value (USD Million) and CAGR & Y-o-Y Growth Trend, 2026-2036F
29.2.5.4. Italy Market Value (USD Million) and CAGR & Y-o-Y Growth Trend, 2026-2036F
29.2.5.5. Spain Market Value (USD Million) and CAGR & Y-o-Y Growth Trend, 2026-2036F
29.2.5.6. Netherlands Market Value (USD Million) and CAGR & Y-o-Y Growth Trend, 2026-2036F
29.2.5.7. Russia Market Value (USD Million) and CAGR & Y-o-Y Growth Trend, 2026-2036F
29.2.5.8. Switzerland Market Value (USD Million) and CAGR & Y-o-Y Growth Trend, 2026-2036F
29.2.5.9. Poland Market Value (USD Million) and CAGR & Y-o-Y Growth Trend, 2026-2036F
29.2.5.10. Belgium Market Value (USD Million) and CAGR & Y-o-Y Growth Trend, 2026-2036F
29.2.5.11. Rest of Europe Market Value (USD Million) and CAGR & Y-o-Y Growth Trend, 2026-2036F
30. Asia Pacific, excluding Japan Market
30.1. Overview
30.1.1. Market Value (USD Million), Current and Future Projections, 2026-2036
30.1.2. Increment $ Opportunity Assessment, 2026-2036
30.2. Segmentation (USD Million), 2026-2036, By
30.2.1. By Type
30.2.1.1. Furnace Black, Market Value (USD Million), and CAGR, 2026-2036F
30.2.1.2. Thermal Black, Market Value (USD Million), and CAGR, 2026-2036F
30.2.1.3. Acetylene Black, Market Value (USD Million), and CAGR, 2026-2036F
30.2.1.4. Channel Black, Market Value (USD Million), and CAGR, 2026-2036F
30.2.1.5. Others, Market Value (USD Million), and CAGR, 2026-2036F
30.2.2. By Grade
30.2.2.1. Standard Grade, Market Value (USD Million), and CAGR, 2026-2036F
30.2.2.2. Specialty Grade, Market Value (USD Million), and CAGR, 2026-2036F
30.2.3. By Grade Type
30.2.3.1. N330, Market Value (USD Million), and CAGR, 2026-2036F
30.2.3.2. N339, Market Value (USD Million), and CAGR, 2026-2036F
30.2.3.3. N347, Market Value (USD Million), and CAGR, 2026-2036F
30.2.3.4. N375, Market Value (USD Million), and CAGR, 2026-2036F
30.2.3.5. N550, Market Value (USD Million), and CAGR, 2026-2036F
30.2.3.6. N660, Market Value (USD Million), and CAGR, 2026-2036F
30.2.3.7. N762, Market Value (USD Million), and CAGR, 2026-2036F
30.2.3.8. N774, Market Value (USD Million), and CAGR, 2026-2036F
30.2.3.9. N990, Market Value (USD Million), and CAGR, 2026-2036F
30.2.3.10. Others, Market Value (USD Million), and CAGR, 2026-2036F
30.2.4. By Application
30.2.4.1. Tires, Market Value (USD Million), and CAGR, 2026-2036F
30.2.4.2. High Performance Coatings, Market Value (USD Million), and CAGR, 2026-2036F
30.2.4.3. Plastics, Market Value (USD Million), and CAGR, 2026-2036F
30.2.4.4. Others, Market Value (USD Million), and CAGR, 2026-2036F
30.2.5. Country Level Analysis, Value (USD Million)
30.2.5.1. China Market Value (USD Million) and CAGR & Y-o-Y Growth Trend, 2026-2036F
30.2.5.2. India Market Value (USD Million) and CAGR & Y-o-Y Growth Trend, 2026-2036F
30.2.5.3. South Korea Market Value (USD Million) and CAGR & Y-o-Y Growth Trend, 2026-2036F
30.2.5.4. Australia Market Value (USD Million) and CAGR & Y-o-Y Growth Trend, 2026-2036F
30.2.5.5. Indonesia Market Value (USD Million) and CAGR & Y-o-Y Growth Trend, 2026-2036F
30.2.5.6. Malaysia Market Value (USD Million) and CAGR & Y-o-Y Growth Trend, 2026-2036F
30.2.5.7. Vietnam Market Value (USD Million) and CAGR & Y-o-Y Growth Trend, 2026-2036F
30.2.5.8. Thailand Market Value (USD Million) and CAGR & Y-o-Y Growth Trend, 2026-2036F
30.2.5.9. Singapore Market Value (USD Million) and CAGR & Y-o-Y Growth Trend, 2026-2036F
30.2.5.10. New Zealand Market Value (USD Million) and CAGR & Y-o-Y Growth Trend, 2026-2036F
30.2.5.11. Rest of Asia Pacific Excluding Japan Market Value (USD Million) and CAGR & Y-o-Y Growth Trend, 2026-2036F
31. Latin America Market
31.1. Overview
31.1.1. Market Value (USD Million), Current and Future Projections, 2026-2036
31.1.2. Increment $ Opportunity Assessment, 2026-2036
31.1.3. Year-on-Year Growth Forecast (%)
31.2. Segmentation (USD Million), 2026-2036, By
31.2.1. By Type
31.2.1.1. Furnace Black, Market Value (USD Million), and CAGR, 2026-2036F
31.2.1.2. Thermal Black, Market Value (USD Million), and CAGR, 2026-2036F
31.2.1.3. Acetylene Black, Market Value (USD Million), and CAGR, 2026-2036F
31.2.1.4. Channel Black, Market Value (USD Million), and CAGR, 2026-2036F
31.2.1.5. Others, Market Value (USD Million), and CAGR, 2026-2036F
31.2.2. By Grade
31.2.2.1. Standard Grade, Market Value (USD Million), and CAGR, 2026-2036F
31.2.2.2. Specialty Grade, Market Value (USD Million), and CAGR, 2026-2036F
31.2.3. By Grade Type
31.2.3.1. N330, Market Value (USD Million), and CAGR, 2026-2036F
31.2.3.2. N339, Market Value (USD Million), and CAGR, 2026-2036F
31.2.3.3. N347, Market Value (USD Million), and CAGR, 2026-2036F
31.2.3.4. N375, Market Value (USD Million), and CAGR, 2026-2036F
31.2.3.5. N550, Market Value (USD Million), and CAGR, 2026-2036F
31.2.3.6. N660, Market Value (USD Million), and CAGR, 2026-2036F
31.2.3.7. N762, Market Value (USD Million), and CAGR, 2026-2036F
31.2.3.8. N774, Market Value (USD Million), and CAGR, 2026-2036F
31.2.3.9. N990, Market Value (USD Million), and CAGR, 2026-2036F
31.2.3.10. Others, Market Value (USD Million), and CAGR, 2026-2036F
31.2.4. By Application
31.2.4.1. Tires, Market Value (USD Million), and CAGR, 2026-2036F
31.2.4.2. High Performance Coatings, Market Value (USD Million), and CAGR, 2026-2036F
31.2.4.3. Plastics, Market Value (USD Million), and CAGR, 2026-2036F
31.2.4.4. Others, Market Value (USD Million), and CAGR, 2026-2036F
31.2.5. Country Level Analysis, Value (USD Million)
31.2.5.1. Brazil Market Value (USD Million) and CAGR & Y-o-Y Growth Trend, 2026-2036F
31.2.5.2. Argentina Market Value (USD Million) and CAGR & Y-o-Y Growth Trend, 2026-2036F
31.2.5.3. Mexico Market Value (USD Million) and CAGR & Y-o-Y Growth Trend, 2026-2036F
31.2.5.4. Rest of Latin America Market Value (USD Million) and CAGR & Y-o-Y Growth Trend, 2026-2036F
32. Middle East & Africa Market
32.1. Overview
32.1.1. Market Value (USD Million), Current and Future Projections, 2026-2036
32.1.2. Increment $ Opportunity Assessment, 2026-2036
32.1.3. Year-on-Year Growth Forecast (%)
32.2. Segmentation (USD Million), 2026-2036, By
32.2.1. By Type
32.2.1.1. Furnace Black, Market Value (USD Million), and CAGR, 2026-2036F
32.2.1.2. Thermal Black, Market Value (USD Million), and CAGR, 2026-2036F
32.2.1.3. Acetylene Black, Market Value (USD Million), and CAGR, 2026-2036F
32.2.1.4. Channel Black, Market Value (USD Million), and CAGR, 2026-2036F
32.2.1.5. Others, Market Value (USD Million), and CAGR, 2026-2036F
32.2.2. By Grade
32.2.2.1. Standard Grade, Market Value (USD Million), and CAGR, 2026-2036F
32.2.2.2. Specialty Grade, Market Value (USD Million), and CAGR, 2026-2036F
32.2.3. By Grade Type
32.2.3.1. N330, Market Value (USD Million), and CAGR, 2026-2036F
32.2.3.2. N339, Market Value (USD Million), and CAGR, 2026-2036F
32.2.3.3. N347, Market Value (USD Million), and CAGR, 2026-2036F
32.2.3.4. N375, Market Value (USD Million), and CAGR, 2026-2036F
32.2.3.5. N550, Market Value (USD Million), and CAGR, 2026-2036F
32.2.3.6. N660, Market Value (USD Million), and CAGR, 2026-2036F
32.2.3.7. N762, Market Value (USD Million), and CAGR, 2026-2036F
32.2.3.8. N774, Market Value (USD Million), and CAGR, 2026-2036F
32.2.3.9. N990, Market Value (USD Million), and CAGR, 2026-2036F
32.2.3.10. Others, Market Value (USD Million), and CAGR, 2026-2036F
32.2.4. By Application
32.2.4.1. Tires, Market Value (USD Million), and CAGR, 2026-2036F
32.2.4.2. High Performance Coatings, Market Value (USD Million), and CAGR, 2026-2036F
32.2.4.3. Plastics, Market Value (USD Million), and CAGR, 2026-2036F
32.2.4.4. Others, Market Value (USD Million), and CAGR, 2026-2036F
32.2.5. Country Level Analysis, Value (USD Million)
32.2.5.1. Saudi Arabia Market Value (USD Million) and CAGR & Y-o-Y Growth Trend, 2026-2036F
32.2.5.2. UAE Market Value (USD Million) and CAGR & Y-o-Y Growth Trend, 2026-2036F
32.2.5.3. Israel Market Value (USD Million) and CAGR & Y-o-Y Growth Trend, 2026-2036F
32.2.5.4. Qatar Market Value (USD Million) and CAGR & Y-o-Y Growth Trend, 2026-2036F
32.2.5.5. Kuwait Market Value (USD Million) and CAGR & Y-o-Y Growth Trend, 2026-2036F
32.2.5.6. Oman Market Value (USD Million) and CAGR & Y-o-Y Growth Trend, 2026-2036F
32.2.5.7. South Africa Market Value (USD Million) and CAGR & Y-o-Y Growth Trend, 2026-2036F
32.2.5.8. Rest of Middle East & Africa Market Value (USD Million) and CAGR & Y-o-Y Growth Trend, 2026-2036F
33. Japan Market
33.1. Overview
33.1.1. Market Value (USD Million), Current and Future Projections, 2026-2036
33.1.2. Increment $ Opportunity Assessment, 2026-2036
33.1.3. Year-on-Year Growth Forecast (%)
33.2. Segmentation (USD Million), 2026-2036, By
33.2.1. By Type
33.2.1.1. Furnace Black, Market Value (USD Million), and CAGR, 2026-2036F
33.2.1.2. Thermal Black, Market Value (USD Million), and CAGR, 2026-2036F
33.2.1.3. Acetylene Black, Market Value (USD Million), and CAGR, 2026-2036F
33.2.1.4. Channel Black, Market Value (USD Million), and CAGR, 2026-2036F
33.2.1.5. Others, Market Value (USD Million), and CAGR, 2026-2036F
33.2.2. By Grade
33.2.2.1. Standard Grade, Market Value (USD Million), and CAGR, 2026-2036F
33.2.2.2. Specialty Grade, Market Value (USD Million), and CAGR, 2026-2036F
33.2.3. By Grade Type
33.2.3.1. N330, Market Value (USD Million), and CAGR, 2026-2036F
33.2.3.2. N339, Market Value (USD Million), and CAGR, 2026-2036F
33.2.3.3. N347, Market Value (USD Million), and CAGR, 2026-2036F
33.2.3.4. N375, Market Value (USD Million), and CAGR, 2026-2036F
33.2.3.5. N550, Market Value (USD Million), and CAGR, 2026-2036F
33.2.3.6. N660, Market Value (USD Million), and CAGR, 2026-2036F
33.2.3.7. N762, Market Value (USD Million), and CAGR, 2026-2036F
33.2.3.8. N774, Market Value (USD Million), and CAGR, 2026-2036F
33.2.3.9. N990, Market Value (USD Million), and CAGR, 2026-2036F
33.2.3.10. Others, Market Value (USD Million), and CAGR, 2026-2036F
33.2.4. By Application
33.2.4.1. Tires, Market Value (USD Million), and CAGR, 2026-2036F
33.2.4.2. High Performance Coatings, Market Value (USD Million), and CAGR, 2026-2036F
33.2.4.3. Plastics, Market Value (USD Million), and CAGR, 2026-2036F
33.2.4.4. Others, Market Value (USD Million), and CAGR, 2026-2036F
34. Global Economic Scenario
34.1. World Economic Outlook
35. About Research Nester
35.1. Our Global Clientele
35.2. We Serve Clients Across World
Carbon Black Market Outlook:
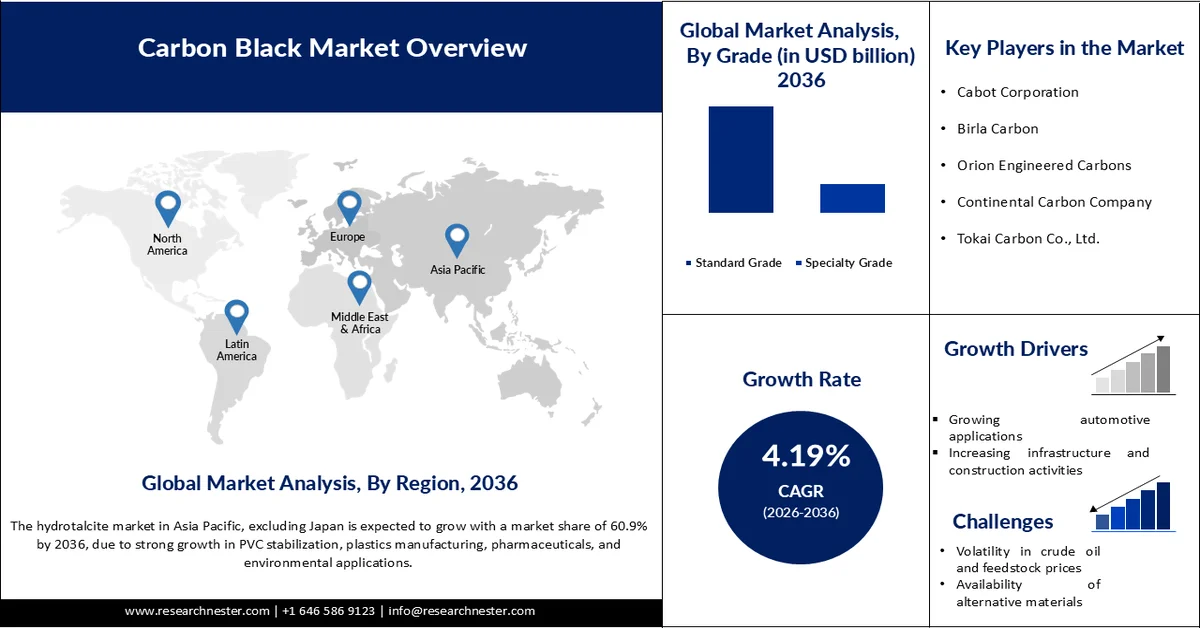
Carbon Black Market size is valued at USD 22.18 billion in 2025 and is projected to reach USD 36.40 billion by 2036, growing at a CAGR of 4.19% during the forecast period, i.e., 2026-2036. In 2026, the industry size of carbon black is estimated at USD 24.15 billion.
The robust expansion of global automotive production and commercialization is boosting the sales of carbon black materials. The durability-enhancing and wear-resistant properties are mainly fuelling the application of carbon black grades in automobile components and tires. In 2025, global car production rose by 4.2% to 78.7 million units, according to the European Automobile Manufacturers’ Association (ACEA). New passenger car registrations worldwide reached 77.6 million, up 3.5% from 2024. This growth was mainly due to government incentives, tax changes, and a strong move toward electric vehicles in several major markets.
The growth of the global vehicle base is fundamentally increasing replacement tire volumes, which directly strengthens steady carbon black consumption since replacement tires account for repeated lifecycle usage and remain the most consistent demand channel independent of short-term automotive production fluctuations. Approximately 70% of global carbon black consumption is associated with tire manufacturing, where it improves tensile strength, abrasion resistance, and overall tire lifespan. Thus, high vehicle adoption and tire replacement are pushing the consumption of carbon black materials.
Global New Car Registrations
|
Region / Country |
2023 |
2024 |
2025 |
% change |
% share |
|
Europe |
15,496,684 |
16,099,179 |
16,317,613 |
+1.4 |
21.0 |
|
European Union |
10,548,165 |
10,631,346 |
10,822,831 |
+1.8 |
14.0 |
|
United Kingdom |
1,903,054 |
1,952,778 |
2,020,523 |
+3.5 |
2.6 |
|
Russia |
1,027,985 |
1,521,549 |
1,282,153 |
-15.7 |
1.7 |
|
Türkiye |
967,341 |
980,341 |
1,084,497 |
+10.6 |
1.4 |
|
EFTA |
396,710 |
378,590 |
427,916 |
+13.0 |
0.6 |
|
Ukraine |
60,710 |
67,392 |
74,136 |
+10.0 |
0.1 |
|
Others (Europe) |
592,719 |
567,183 |
605,557 |
+6.8 |
0.8 |
|
North America |
14,721,187 |
15,410,461 |
15,571,250 |
+1.0 |
20.1 |
|
United States only |
12,324,963 |
12,701,814 |
12,822,872 |
+1.0 |
16.5 |
|
South America |
2,841,260 |
3,024,746 |
3,367,521 |
+11.3 |
4.3 |
|
Brazil only |
1,718,898 |
1,947,125 |
1,990,832 |
+2.2 |
2.6 |
|
Asia |
36,093,004 |
36,512,607 |
38,267,322 |
+4.8 |
49.3 |
|
China |
22,363,987 |
22,957,613 |
24,219,235 |
+5.5 |
31.2 |
|
India |
4,161,939 |
4,362,578 |
4,579,369 |
+5.0 |
5.9 |
|
Japan |
3,990,090 |
3,708,948 |
3,828,601 |
+3.2 |
4.9 |
|
South Korea |
1,486,349 |
1,422,405 |
1,479,897 |
+4.0 |
1.9 |
|
Others (Asia) |
4,090,639 |
4,061,062 |
4,160,220 |
+2.4 |
5.4 |
|
Middle East/Africa |
3,655,130 |
3,861,789 |
4,031,213 |
+4.4 |
5.2 |
|
World |
72,807,265 |
74,908,782 |
77,554,919 |
+3.5 |
100.0 |
Source: ACEA
Key Carbon Black Market Insights Summary:
Regional Highlights:
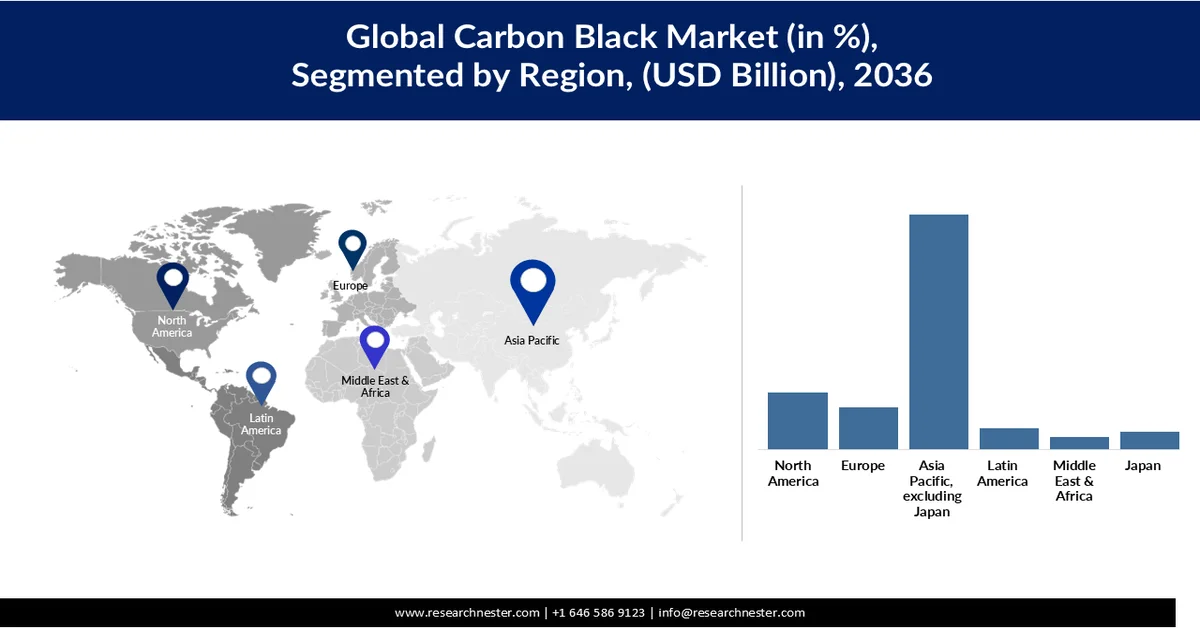
- Asia Pacific excluding Japan (APEJ) is expected to dominate the global carbon black market, accounting for a 60.9% share by 2036, driven by the strong presence of automotive and electronics manufacturing units.
- The North America carbon black market is experiencing steady growth and is projected to account for a 14.7% market share during the forecast period.
- The U.S. carbon black market is expected to grow consistently, reaching USD 4,664.17 million by 2036 at a CAGR of 3.42%, supported by aging vehicle fleets and innovations.
Segment Insights:
- • In the carbon black market, the furnace black segment is projected to command 84.5% share by 2036, attributed to technological upgrades increasing the application of carbon black
- • The standard grade segment is anticipated to hold 77.7% of the Japan market through 2036, reinforced by expansion of production units accelerating the trade of standard grade carbon black solutions
Key Growth Trends:
- Rising adoption of specialty carbon black
- Growing demand from the plastics industry
Major Challenges:
- Volatility in crude oil and feedstock prices
- Availability of alternative materials
Key Players: Cabot Corporation (U.S.), Birla Carbon (India), Orion Engineered Carbons (Germany), Continental Carbon Company (U.S.), Tokai Carbon Co., Ltd. (Japan), OCI Company Ltd. (South Korea), Phillips Carbon Black Limited (India), Jiangxi Black Cat Carbon Black Inc., Ltd. (China), Cancarb Limited (Canada), China Synthetic Rubber Corporation (CSRC) (Taiwan), Mitsubishi Chemical Corporation (Japan), Tokushu Tokai Carbon Co., Ltd. (Japan), Asahi Carbon Co., Ltd. (Japan), Denka Company Limited (Japan), Lion Specialty Chemicals Co., Ltd. (Japan).
Global Carbon Black Market Forecast and Regional Outlook:
Market Size & Growth Projections:
- 2025 Market Size: USD 22.18 billion
- 2026 Market Size: USD 24.15 billion
- Projected Market Size: USD 36.40 billion by 2036
- Growth Forecasts: 4.19% CAGR (2026-2036)
Key Regional Dynamics:
- Largest Region: Asia Pacific excluding Japan (60.9% Share by 2036)
- Fastest Growing Region: Japan
- Dominating Countries: United States, Germany, Japan, United Kingdom, Canada
- Emerging Countries: China, India, South Korea, Australia, Singapore
Last updated on : 3 June, 2026
Carbon Black Market - Growth Drivers and Challenges
Growth Drivers
- Rising adoption of specialty carbon black: The specialty carbon black materials are projected to report high adoption across mining, electronics, and heavy machinery industries due to their superior performance. The leading manufacturers are also enhancing their products to reach a wider customer base. The recent example of this is the introduction of ECOLAR 50 Powder, a bio-based carbon black designed to help coating makers, by Orion S.A. in April 2025. It offers color performance similar to standard specialty carbon blacks and can be used in many types of coating applications. Thus, innovations are expected to increase the consumption of speciality carbon black materials during the study period.
- Growing demand from the plastics industry: Carbon black is widely used across the plastics sector owing to its ultraviolet (UV) protection and enhanced durability. The study by the Plastics Europe Organization disclosed that in 2024, the global production of plastics stood at 430.9 million tonnes (Mt). This highlights that even though countries are focusing on zero-emission goals, the use of plastics is still high. Europe produced nearly 54.6 Mt of plastics, and the exports and imports totalled nearly EUR 30.7 billion and EUR 23.9 billion, respectively. Thus, as plastic consumption increases, the demand for carbon is set to boom.
- Increasing infrastructure and construction activities: The rising construction and infrastructure modernization activities are boosting the sales of carbon black. The Global Infrastructure Outlook estimates that the infrastructure investment at current trends in 2025 is USD 3 trillion and is set to reach USD 3.6 trillion by 2036. Asia Pacific, the Middle East, and Africa are witnessing a robust rise in commercial, residential, and industrial projects. Thus, the increasing smart city initiatives and rapid urbanization in developing economies are propelling the consumption of carbon black materials.
Challenges
- Volatility in crude oil and feedstock prices: The production of carbon black heavily relies on petroleum-based feedstocks; any supply chain disruptions or price changes affect their trade. From the start of 2026, the world is witnessing crude oil cost fluctuations, which are directly reflecting their influence on petroleum-based feedstocks and, subsequently, on carbon black. The small enterprises refraining from investing in costly materials are creating a challenge for the growth of the market. However, strategic diplomacy and foreign policies implemented by each country are likely to aid in overcoming this issue in the years ahead.
- Availability of alternative materials: Carbon black faces high competition from alternative materials that perform similar functions across multiple industries. For example, in tires and rubber, silica and other mineral fillers are being widely used as they help to reduce rolling resistance and fuel efficiency. Similarly, in the plastic sector, carbon black faces intense challenges from organic dyes, titanium dioxide, graphene derivatives, pigments, and coatings. To overcome this issue and increase sales, several companies are focusing on technological innovations.
Carbon Black Market Size and Forecast:
| Report Attribute | Details |
|---|---|
|
Base Year |
2025 |
|
Forecast Year |
2026-2036 |
|
CAGR |
4.19% |
|
Base Year Market Size (2025) |
USD 22.18 billion |
|
Forecast Year Market Size (2036) |
USD 36.40 billion |
|
Regional Scope |
|
Carbon Black Market Segmentation:
Type Segment Analysis
The furnace black segment is projected to capture 84.5% of the global carbon black market share through 2036. The furnace black carbon is widely demanded owing to its scalability, versatility, and cost-effectiveness. They witness high applications across rubber, automotive, plastics, and tire manufacturing sectors. In March 2024, Cabot Corporation announced the global release of PROPEL E8, a new carbon black product made for high-performance tire treads. It is designed to improve tread life while keeping rolling resistance low, and it also helps meet the extra demands of electric vehicles, which are heavier and produce more torque than conventional vehicles. This new grade adds to Cabot’s existing PROPEL E series for high-performance tires. Thus, technological upgrades are likely to increase the application of carbon black.
Grade Segment Analysis
The standard grade segment is estimated to hold 77.7% of the Japan carbon black market throughout the forecast period. The standard grade black carbon materials are mostly used in all end use industries owing to their versatility. These grades are typically produced using the furnace black process and are valued for their reinforcement properties, abrasion resistance, and durability. In January 2024, Birla Carbon announced two new carbon black plants, one in Naidupet, Andhra Pradesh, and the other in Rayong, Thailand. Each site is planned to start with a capacity of 120 kMT in 2025, with expansion later to 240 kMT. Such expansion of production units is projected to double the trade of standard grade carbon black solutions in the years ahead.
Application Segment Analysis
The tire segment is likely to account for the largest share of the Japan carbon black market through 2036. The increasing registrations of vehicles worldwide are directly fuelling the application of black carbon in tires and other components. The Federal Reserve Bank of St. Louis reveals that the producer price index of the tire manufacturing industry stood at 224.830 in April 2026. Thus, it is understood that the elevated pricing environment is reflecting continued activity within the tire manufacturing sector that directly drives the demand for carbon black as a critical reinforcing material.
Our in-depth analysis of the carbon black market includes the following segments:
|
Segments |
Subsegments |
|
Type |
|
|
Grade |
|
|
Grade Type |
|
|
Application |
|

Vishnu Nair
Head - Global Business DevelopmentCustomize this report to your requirements — connect with our consultant for personalized insights and options.
Carbon Black Market - Regional Analysis
Asia Pacific excluding Japan Market Insights
Asia Pacific, excluding Japan, is poised to report 60.9% of the global carbon black market share through 2036. The robust automobile production and rise in repair & maintenance demand are boosting the sales of carbon black materials. The ACEA disclosed that in 2025, global car production rose by 4.2% to 78.7 million units, with Asia leading the market, making up 62.1% of total output. The high volume of registrations is set to double the consumption of carbon black materials in the years ahead. Innovations and increasing adoption from the industrial and polymer applications across fast-growing economies are projected to drive the overall market growth.
China is expected to hold 52.6% of the APEJ market throughout the study timeframe. The prime factor boosting the sales of carbon black materials in the country is the high-volume production of automobiles. The International Energy Agency (IEA) revealed that China’s car production reached a record 27 million units in 2024, which was 30% higher than in 2019. The country also became the world’s largest car exporter, overtaking the European Union, with exports rising to 20% of total output from about 3% in 2019. Thus, China is one of the most lucrative marketplaces for carbon black manufacturers.
The market in India is estimated to increase at a CAGR of 5.8% from 2026 to 2036. The expanding automotive, tire, and component manufacturing industries are mainly fuelling the sales of carbon black solutions. The India Brand Equity Foundation disclosed that auto component exports increased by 8% to USD 22.90 billion in FY25, up from USD 21.20 billion in FY24. EV sales in India also rose to 2.05 million units in FY25 from 1.68 million units in FY24. In addition, the Bharat New Car Assessment Program (BNCAP) is expected to support the auto component industry by encouraging advanced manufacturing and new material innovations. Thus, supportive government policies and initiatives are poised to double the revenues of black carbon manufacturers.
Japan Market Insights
The Japan carbon black market is valued at USD 1,267.57 million in 2025 and is expected to reach USD 1,660.01 million by 2036. The high-performance automotive manufacturing facilities are boosting the consumption of carbon black materials. The steady growth in electric vehicle tire production is poised to fuel the application of carbon black materials. The increasing consumption of specialty rubber, plastics, and conductive materials used in electronics and lithium-ion batteries is further propelling the overall market growth.
In February 2024, Marubeni Corporation reached an agreement to acquire shares in RCB Nanotechnologies GmbH through a new share issue. RCBNano, based in Germany, is building a plant to produce recovered carbon black for tires. Interest in this technology has grown as the tire and rubber industry looks for more recycled materials and a more circular economy. Thus, the growing demand for specialized eco-friendly carbon black materials is set to boost the revenues of key producers during the study period.
Japan Carbon Black Market Size and Forecast
|
Report Attribute |
Details |
|
Base Year Market Size and Volume (2025) |
USD 1,267.57 million; 1,020.42 thousand tons |
|
Forecast Year Market Size and Volume (2036) |
USD 1,660.01 million; 1,125.24 thousand tons |
|
CAGR (2026-2036) |
2.32% |
North America Market Insights
North America is anticipated to capture 14.7% of the global carbon black market share throughout the forecast period. The market is growing at a healthy pace, supported by firm prices and stable demand from the automotive and industrial sectors. The carbon black demand is also being supported by tire and vehicle production and an aging vehicle fleet. The rising EV battery use for conductive grades, strong consumption in plastics and coatings, and higher investment in recovered carbon black solutions are directly contributing to the overall market growth.
The U.S market was valued at USD 2,445.86 million in 2025. The strong automotive and tire industry is fuelling the consumption of carbon black materials. Both OEM and replacement tires are driving demand for carbon black materials in the country. Specialty carbon black is increasingly used in high-performance plastics, coatings, and electronic components, reflecting a high demand for premium and technologically advanced materials.
Canada’s market is projected to reach USD 507.62 million by the end of 2035. The country’s automotive and truck industry is boosting the consumption of carbon black materials. The swift urbanization and industrial expansion activities are also contributing to the increasing sales of carbon black materials. The Observatory of Economic Complexity (OEC) reveals that the exports and imports of carbon-based electronics totalled CAD 23.5 million and CAD 601 million in 2025, respectively. Thus, Canada is one of the most profitable markets for carbon black manufacturers.
Europe Market Insights
The Europe carbon black market is expected to grow steadily from 2026 to 2036, with a CAGR of 2.65%. This growth is being supported by stricter emission rules and strong demand from the tire industry. The shift toward recycled and sustainable materials is also driving innovations in carbon black. EU carbon pricing and decarbonization policies are also encouraging producers to move toward low-carbon and recovered carbon black options. The ACEA report reveals that the new EU car registrations rose by 1.8% in 2025 compared with 2024. Thus, this higher vehicle production and sales are further supporting demand for carbon black in the region.
The Germany market is projected to reach USD 1,192.39 million by 2036. The country’s robust automotive and industrial manufacturing base is propelling the sales of carbon black materials. The German Association of the Automotive Industry (VDA) disclosed that car production in Germany stood at 403,394 units in March 2026. Beyond the automotive sector, the country’s industrial and electronics manufacturing sectors are also generating high demand for carbon black materials.
The UK market was valued at USD 416.20 million in 2025. The country’s tire, automotive components, and rubber products sectors are mainly boosting the consumption of carbon black materials. The rise in residential and commercial construction projects is fuelling the sales of carbon black-containing pipes, coatings, and cables. The environmental and regulatory considerations are further influencing the manufacturing and consumption of carbon black materials.
Key Carbon Black Market Players:
- Cabot Corporation (U.S.)
- Birla Carbon (India)
- Orion Engineered Carbons (Germany)
- Continental Carbon Company (U.S.)
- Tokai Carbon Co., Ltd. (Japan)
- OCI Company Ltd. (South Korea)
- Phillips Carbon Black Limited (India)
- Jiangxi Black Cat Carbon Black Inc., Ltd. (China)
- Cancarb Limited (Canada)
- China Synthetic Rubber Corporation (CSRC) (Taiwan)
- Mitsubishi Chemical Corporation (Japan)
- Tokushu Tokai Carbon Co., Ltd. (Japan)
- Asahi Carbon Co., Ltd. (Japan)
- Denka Company Limited (Japan)
- Lion Specialty Chemicals Co., Ltd. (Japan)
- Company Overview
- Business Strategy
- Key Product Offerings
- Financial Performance
- Key Performance Indicators
- Risk Analysis
- Recent Development
- Regional Presence
- SWOT Analysis
- Cabot Corporation is a global leader in both commodity and specialty carbon black, serving tires, automotive, plastics, coatings, and electronics industries. The company emphasizes innovation and sustainability, investing heavily in R&D for conductive and high-performance carbon blacks. Its global manufacturing footprint and strategic acquisitions have strengthened its market presence across North America, Europe, and Asia. Cabot is recognized for its focus on clean production technologies, recovered carbon black, and tailored solutions that cater to evolving industrial and automotive needs.
- Birla Carbon is one of the largest carbon black producers globally, with a strong presence in tires, rubber, and industrial applications. The company focuses on high-volume production, consistent quality, and expanding its international footprint, particularly in Europe and Asia. Strategic investments in sustainable manufacturing, energy efficiency, and recovered carbon black technologies strengthen its competitive position. Birla Carbon also emphasizes specialty grades for coatings, plastics, and inks, positioning itself as a versatile supplier in a highly competitive global market.
- Orion Engineered Carbons is a leading German carbon black manufacturer with a strong emphasis on specialty and high-performance grades. The company serves the tire, automotive, plastics, and coatings sectors across Europe, North America, and Asia. Orion focuses on technological innovation, sustainability, and expanding its global production capabilities. The company’s strategic initiatives include mergers, acquisitions, and R&D investments aimed at conductive carbon black, recovered materials, and premium specialty solutions, enhancing its competitiveness in the specialty market.
- Continental Carbon Company specializes in both standard and high-performance carbon blacks for tires, rubber, plastics, and coatings. The company leverages advanced manufacturing processes to produce consistent, high-quality products and focuses on niche applications requiring specialty grades. Continental Carbon emphasizes global expansion, operational efficiency, and sustainability initiatives, including energy-efficient production and recycled carbon black. Its market strategy targets industrial clients and automotive manufacturers seeking high-performance, durable, and environmentally compliant solutions.
- Tokai Carbon Co., Ltd. is a leading Japanese manufacturer of specialty and high-performance carbon blacks, serving automotive, electronics, and industrial markets. The company invests heavily in R&D to develop conductive, UV-resistant, and durable carbon black products tailored for high-value applications. Tokai Carbon also focuses on sustainable manufacturing, recovered carbon black, and energy-efficient production to meet stringent environmental standards. With a strong domestic base and expanding international presence, Tokai Carbon is recognized for technological innovation and premium specialty solutions in the global market.
Below is the list of the key players operating in the global carbon black market:
The global carbon black market is characterized by the strong presence of established manufacturers are increasing emergence of new companies. The key players are employing both organic and inorganic marketing strategies to boost their revenue shares. They are investing heavily in R&D activities to introduce next-gen carbon black materials. Some are entering into strategic collaborations with others to enhance their product offerings. The gigantic companies are also expanding their operations overseas to earn high profits from trending opportunities.
Corporate Landscape of the Global Market:
Recent Developments
- In January 2025, Sumitomo Rubber Industries and Mitsubishi Chemical Corporation began a joint project to recycle carbon black, a key tire material. Under this plan, Sumitomo Rubber is set to send rubber scraps from tire production and crushed end-of-life tires to Mitsubishi Chemical, where they are expected to be processed for chemical recycling to make carbon black again. This recycled carbon black is then to be used by Sumitomo Rubber in tire production.
- In October 2024, Hankook Tire & Technology began large-scale production of tires made with three types of ISCC PLUS-certified carbon black. This material, produced from oil recovered through tire pyrolysis, was developed under the Tire-to-Tire Circular Economy Model consortium.
- Report ID: 8601
- Published Date: Jun 03, 2026
- Report Format: PDF, PPT
- Explore a preview of key market trends and insights
- Review sample data tables and segment breakdowns
- Experience the quality of our visual data representations
- Evaluate our report structure and research methodology
- Get a glimpse of competitive landscape analysis
- Understand how regional forecasts are presented
- Assess the depth of company profiling and benchmarking
- Preview how actionable insights can support your strategy
Explore real data and analysis
Frequently Asked Questions (FAQ)
Carbon Black Market Report Scope
Free Sample includes current and historical market size, growth trends, regional charts & tables, company profiles, segment-wise forecasts, and more.
Connect with our Expert


Copyright @ 2026 Research Nester. All Rights Reserved.
