Bubble Tea Market Outlook:
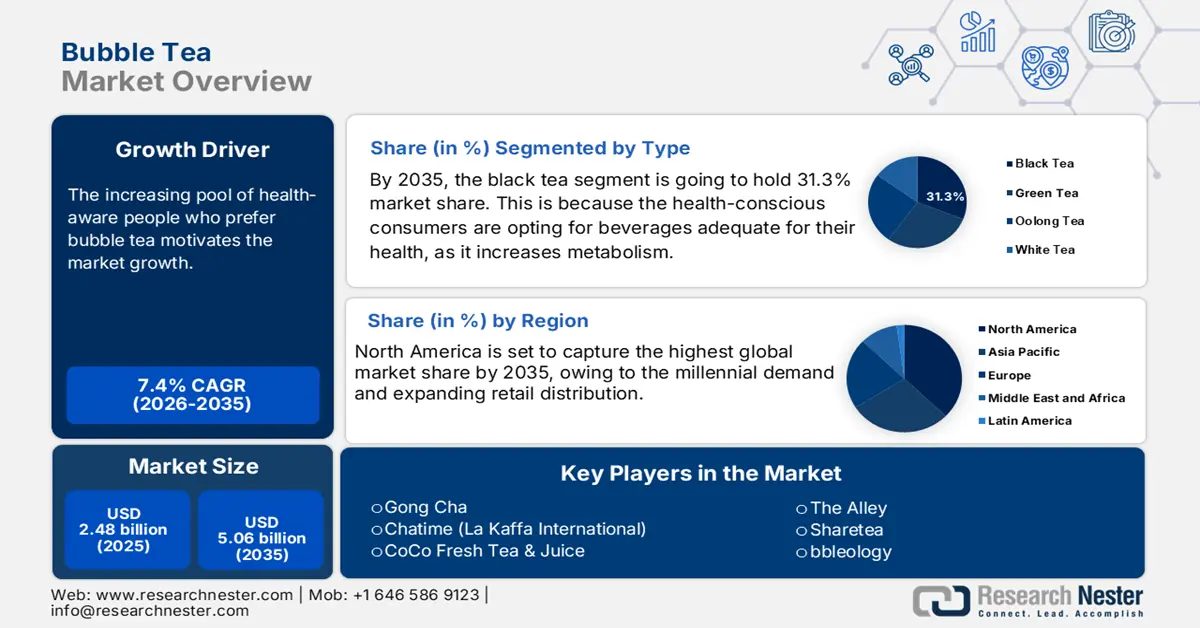
Bubble Tea Market size was valued at approximately USD 2.48 billion in 2025 and is projected to reach around USD 5.06 billion by the end of 2035, rising at a CAGR of approximately 7.4% during the forecast period, i.e., between 2026-2035. In 2026, the industry size of bubble tea is assessed at USD 2.66 billion.
The global bubble tea market relies on an intricate supply chain and the procurement of raw materials, including tea leaves and tapioca, which are primarily sourced from the Asia Pacific. The largest exporter of bubble tea ingredients remains Taiwan, with a surge in exports of the pearl milk tea base ingredient in recent years. The application of import tariffs and trade restrictions complicates logistics. For instance, the tariffs on tapioca pearls from the U.S. have raised the operational costs and influenced the pricing strategies.
The humongous investment in technological advancements on the factory floors is streamlining production and distribution. The inclusion of automation in tapioca pearl manufacturing has upgraded the packaging solutions. Moreover, the digital ordering platforms have expanded accessibility to the market. Additionally, the surge in predictive modelling and data analytics has aided the companies in depicting the trends and optimizing the pricing strategy. Also, the advent of advanced cold chain logistics is being extensively used to restore the freshness of the ingredients during worldwide transportation.
Key Bubble Tea Market Insights Summary:
Regional Highlights:
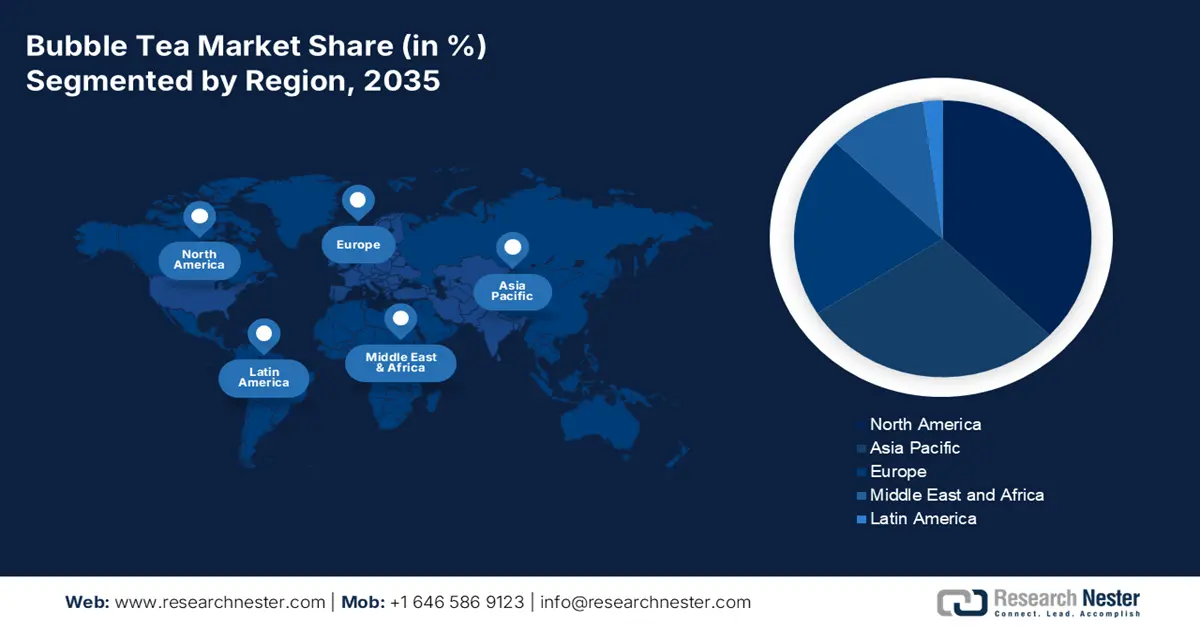
- North America is projected to expand notably in the bubble tea market by 2034, capturing a leading regional position as rising millennial demand and the influence of social-media-driven beverage trends stimulate consumption.
- Europe is anticipated to strengthen its foothold between 2026 and 2035, supported by shifting preferences toward low-sugar beverages and increased adoption across multicultural urban centers.
Segment Insights:
- By 2035, the café segment in the bubble tea market is estimated to secure a 42.1% share, propelled by growing consumer preference for customizable café-style beverage experiences.
- The black tea segment is set to attain a 31.3% share by 2035, encouraged by rising health awareness linked to its antioxidative and metabolic benefits.
Key Growth Trends:
- Rising number of health-conscious consumers
- Increase in demand for customization and flavor innovation
Major Challenges:
- Volatility in the raw material prices
- Waste management and sustainability pressure
Key Players: Chatime (La Kaffa International), CoCo Fresh Tea & Juice, The Alley, Sharetea, Bubbleology, Boba Guys, Kung Fu Tea, Tiger Sugar, Happy Lemon, Dakasi, Chaiiwala, Presotea, Tea Time, Tealive (Loob Holding), Tapioca Land, Mottramite Tea, Pearl Lady, Sweets Pearl.
Global Bubble Tea Market Forecast and Regional Outlook:
Market Size & Growth Projections:
- 2025 Market Size: USD 2.48 billion
- 2026 Market Size: USD 2.66 billion
- Projected Market Size: USD 5.06 billion by 2035
- Growth Forecasts: 7.4% CAGR (2026-2035)
Key Regional Dynamics:
- Largest Region: North America (Highest Share by 2034)
- Fastest Growing Region: Europe
- Dominating Countries: United States, Germany, United Kingdom, China, Japan
- Emerging Countries: India, Brazil, South Korea, Indonesia, Mexico
Last updated on : 7 October, 2025
Bubble Tea Market - Growth Drivers and Challenges
Growth Drivers
- Rising number of health-conscious consumers: There has been a burgeoning demand for healthier bubble tea varieties owing to increased concerns for diabetes and obesity. Various companies, such as BUBLUV Inc., have launched low-calorie sugar-free bubble tea in response to this trend. Companies are launching low-calorie options with natural sweetener alternatives. Also, oat and coconut milk-based bubble teas are preferred by health-conscious people. In 2024, a survey conducted by IFIC Food & Health in the U.S. found that 72% of citizens are proactively raising their protein intake. Many people are adding a protein-rich topping to the bubble tea, which fulfills the protein needs and further augments the market growth.
- Increase in demand for customization and flavor innovation: The bubble tea is appealing to a vast portion of the population owing to its versatility. The highly customizable nature of the bubble tea allows customers to customize sweetness levels and milk alternatives. The facility of personalization bolsters the value of the brand and increases customer retention. For instance, TeaBot is Singapore’s 1st bubble tea vending machine, aiming to serve as many people with freshly made and customizable bubble teaanytime of the day and anywhere in the world.
- Social media and Gen Z influence: The visual appeal of bubble tea through its vibrant colors and customizable toppings makes it suitable for social media platforms. Social media has made bubble tea shareable and aesthetically pleasing. Also, various brands such as Gong Cha are partnering with K-pop stars to entice Gen Z. By leveraging such digital trends, companies are witnessing higher growth in comparison with the conventional players. On Instagram, #bubbletea has more than 4.1 million posts, mainly from Gen Z. These factors are augmenting the market growth during the forecasted period.
Challenges
- Volatility in the raw material prices: The most prominent challenge for the bubble tea market is the fluctuation in the prices for raw material prices. The worldwide supply of tapioca starch has faced significant price fluctuations in price in last few years. The surge in input costs has lowered the profit margins, resulting in increased retail prices.
- Waste management and sustainability pressure: Sustainability has become non-negotiable among consumers, and the bubble tea industry faces a surge in scrutiny over its impact on the environment. There are regulations across the world for the usage of single-use directives and compelling market players to cling to reusable packaging options.
Bubble Tea Market Size and Forecast:
| Report Attribute | Details |
|---|---|
|
Base Year |
2025 |
|
Forecast Year |
2026-2035 |
|
CAGR |
7.4% |
|
Base Year Market Size (2025) |
USD 2.48 billion |
|
Forecast Year Market Size (2035) |
USD 5.06 billion |
|
Regional Scope |
|
Bubble Tea Market Segmentation:
Distribution Channel Segment Analysis
The café segment is projected to dominate the market, registering 42.1% of the market share due to its direct engagement with consumers. The young population prefers café-style experiences, savoring bubble tea that incorporates personalization in terms of toppings and flavors. According to the U.S. Small Business Administration, the trends for food service highlight that specialty beverages such as bubble tea are expected to get high foot traffic in various cafes, owing to their appeal and variants. These factors are propelling the segment growth during the forecasted period.
Type Segment Analysis
The black tea segment is expected to account for 31.3% of the market share by 2035, driven by its rich antioxidant profile. The health-conscious consumers are opting for beverages adequate for their health. Black tea contains catechins that help enhance metabolism. The USDA studies corroborated that black tea has good health effects and helps lower cholesterol. The black bubble tea is the most popular variant due to its versatility. It is also linked to enhancing gut health and regulating blood sugar.
Component Segment Analysis
The Tapioca pearls segment is set to garner 33.1% share by 2035. The growth of the segment can be attributed to its chewy taste. The demand is further fueled by a surge in international trade practices and upgraded processing technologies. The low cost and culinary versatility of tapioca pearls are propelling the usage in bubble tea and other fusion with various desserts globally. There has been an increase in the popularity of Asian desserts worldwide, expanding the segment growth globally. Additionally, the increase in penetration of ready-to-drink bubble tea in retail and convenience stores has amplified the mass production of shelf-stable tapioca pearls.
Our in-depth analysis of the bubble tea market includes the following segments:
|
Segments |
Subsegments |
|
Type |
|
|
Flavor |
|
|
Component |
|
|
Distribution Channel |
|

Vishnu Nair
Head - Global Business DevelopmentCustomize this report to your requirements — connect with our consultant for personalized insights and options.
Bubble Tea Market - Regional Analysis
North America Market Insights
The bubble tea market in North America is set to register significant growth by the end of 2034, driven by millennial demand and expanding retail distribution. The social media trends for uploading aesthetic food products are making bubble tea a shareable product. The market in the U.S. is continuing to expand significantly, due to a surge in consumer demand for health-related beverages. Also, the advent of Taiwanese immigrants in California has brought this drink, and over time, it has transitioned from an “ethnic specialty” to a mainstream lifestyle drink.
The market in Canada is bolstered by a surge in the launch of wellness products. Prominent brands are expanding by launching food trucks and kiosks in metro areas such as Vancouver and Montreal. Also, there has been a rising demand for healthier options that are rich in antioxidants with tea bases and low in sugar. Prominent companies in Canada, such as Gotcha Bubble Tea, are continuously introducing new product series and are currently developing Bubble Tea Gelato, which is in high demand.
APAC Market Insights
The market in the Asia Pacific is catalysed by strong consumer demand and increasing urbanization. China is anticipated to hold the highest revenue share, fueled by significant domestic consumption and ICT integration. Also, delivery platforms such as Meituan and Ele.me, register a large number of sales of bubble tea in the country. Various brands are also pushing through franchising and by establishing cloud kitchens in malls. People are more inclined towards bubble tea as it is considered to be a “modern twist” on the country’s deep-rooted tea culture, making it culturally resonant.
In India, the growth of the market is driven by the rising cases of cancer and increasing advancements in pharmaceutical research. Various government programs are endeavoring to enhance the healthcare infrastructure and access to treatments. Moreover, the market is also promoted by the rising partnerships and collaborations between the companies involved in making beverages. Also, the Indian students returning from the UK, Taiwan, and Korea bring back a taste for boba. Companies are willing to experiment with packaging and are ready to drink beverages, which is also fueling the market growth in the country.
Cassava Exports (2023)
|
Rank |
Country |
Export Value (USD) |
|
1 |
Thailand |
$1.3B |
|
2 |
Cambodia |
$436M |
|
3 |
Laos |
$337M |
Cassava Imports (2023)
|
Rank |
Country |
Import Value (USD) |
|
1 |
China |
$1.5B |
|
2 |
Thailand |
$577M |
|
3 |
Vietnam |
$231M |
Source: OEC
Europe Market Insights
The market in Europe is witnessing significant expansion, fostered by changes in consumer preferences and health trends. The low-sugar beverage options are rising owing to burgeoning cases of obesity and diabetes. Germany is forecasted to register the highest share supported by strategic government investment. Various smart vending machines are deployed in the Tier 1 cities of the country. Also, the multicultural urban centers in Munich and Berlin are becoming hotspots for the adoption of bubble tea. The country is Europe’s largest tourist hub and international visitors often seek familiar drinks like bubble tea, that is further propelling the market growth.
In the UK, the market is bolstered by rising demand for customizable drinks and the expansion of urban cafes. There is a significant increase in the establishment of chains such as Gong Cha and Chatime, mainly in prominent cities. Also, people are preferring to order online, further propelling the market growth. The government is supporting digitally enabled micro food businesses, including bubble tea ventures. The popularity of Asian cuisine is on the rise in the UK, and large-scale immigration has propelled cultural diversity.
Key Bubble Tea Market Players:
- Gong Cha
- Company Overview
- Business Strategy
- Key Product Offerings
- Financial Performance
- Key Performance Indicators
- Risk Analysis
- Recent Development
- Regional Presence
- SWOT Analysis
- Chatime (La Kaffa International)
- CoCo Fresh Tea & Juice
- The Alley
- Sharetea
- Bubbleology
- Boba Guys
- Kung Fu Tea
- Tiger Sugar
- Happy Lemon
- Dakasi
- Chaiiwala
- Presotea
- Tea Time
- Tealive (Loob Holding)
- Tapioca Land
- Mottramite Tea
- Pearl Lady
- Sweets Pearl
- Bull Pulu
The global market is partially consolidated, with prominent players utilizing digital ordering platforms to scale up the business. Brands from Taiwan are continuing to dominate owing to their authenticity and control in the supply chain. Various strategic programs incorporate AI-enabled flavor development, aggressive expansion, and the advent of eco-friendliness. Various cross-border collaborations and humongous investments are also reinforcing brand positioning. Key players are adopting several strategies, such as mergers and acquisitions, joint ventures, partnerships, and novel product launches, to enhance their product base and strengthen their market position.
Here is a list of key players operating in the global market:
Recent Developments
- In January 2025, Chi Cha San Chen—a premium Taiwan-based chain—opened its first Houston location in Asiatown. The brand is known for its "teaspresso" brewing method and award-winning teas. Mexican brand Hey Tea is also slated to open in the same area.
- In December 2024, Gong Cha began deploying AI-powered self-service kiosks in organized retail locations across major U.S. and Canadian cities. These installations were situated in high-footfall grocery stores and shopping malls. The initiative led to an increase in brand footprint penetration in metropolitan areas.
- Report ID: 7961
- Published Date: Oct 07, 2025
- Report Format: PDF, PPT
- Explore a preview of key market trends and insights
- Review sample data tables and segment breakdowns
- Experience the quality of our visual data representations
- Evaluate our report structure and research methodology
- Get a glimpse of competitive landscape analysis
- Understand how regional forecasts are presented
- Assess the depth of company profiling and benchmarking
- Preview how actionable insights can support your strategy
Explore real data and analysis
Frequently Asked Questions (FAQ)
Bubble Tea Market Report Scope
Free Sample includes current and historical market size, growth trends, regional charts & tables, company profiles, segment-wise forecasts, and more.
Connect with our Expert


Copyright @ 2026 Research Nester. All Rights Reserved.
