Animal Feed Additives Market Outlook:
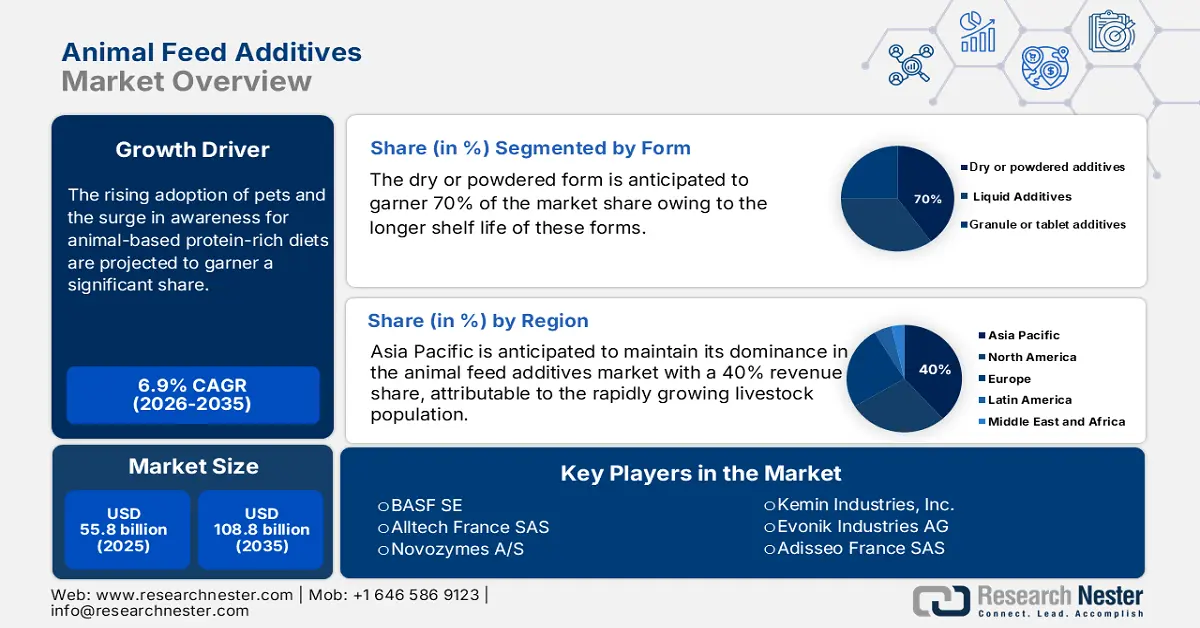
Animal Feed Additives Market was over USD 55.8 billion in 2025 and is projected to reach USD 108.8 billion by 2035, witnessing a CAGR of 6.9% during the forecast period, i.e., between 2026-2035. In 2026, the industry size of animal feed additives is assessed at USD 59.7 billion.
The surge in exports and imports of animal food is prominently propelling the growth of global animal feed additives market. With the increased import, countries are accessing specialized additives such as vitamins and additives. The higher volumes of trade foster the manufacturers to scale up the economy and invest in product innovation while remaining compliant with the international quality standards, while improving the overall quality of the product. Moreover, the dynamic exchange of technology as well as products speeds up the adoption of the feed additives and expands the market reach.
|
Rank |
Leading Exporters (2023) |
Value (USD Billion) |
Leading Importers (2023) |
Value (USD Billion) |
|
1 |
Germany |
4.68 |
Germany |
3.35 |
|
2 |
United States |
4.26 |
United States |
2.62 |
|
3 |
Netherlands |
4.16 |
United Kingdom |
2.13 |
Source: OEC
Also, the governments across the globe are implementing strict regulations on production to ensure food safety, animal welfare, and environmental sustainability. Companies are getting subsidies and research funding for safe and high-quality feed additives, which further encourage producers to adopt advanced additives. Regulatory approvals for probiotics and natural additives are shaping the animal feed additives market by guaranteeing both efficiency and safety. Regulatory approvals for probiotics and natural additives, such as plant-derived phytogenics and organic acids, are shaping the market by guaranteeing efficacy, safety, and traceability.
Key Animal Feed Additives Market Insights Summary:
Regional Highlights:
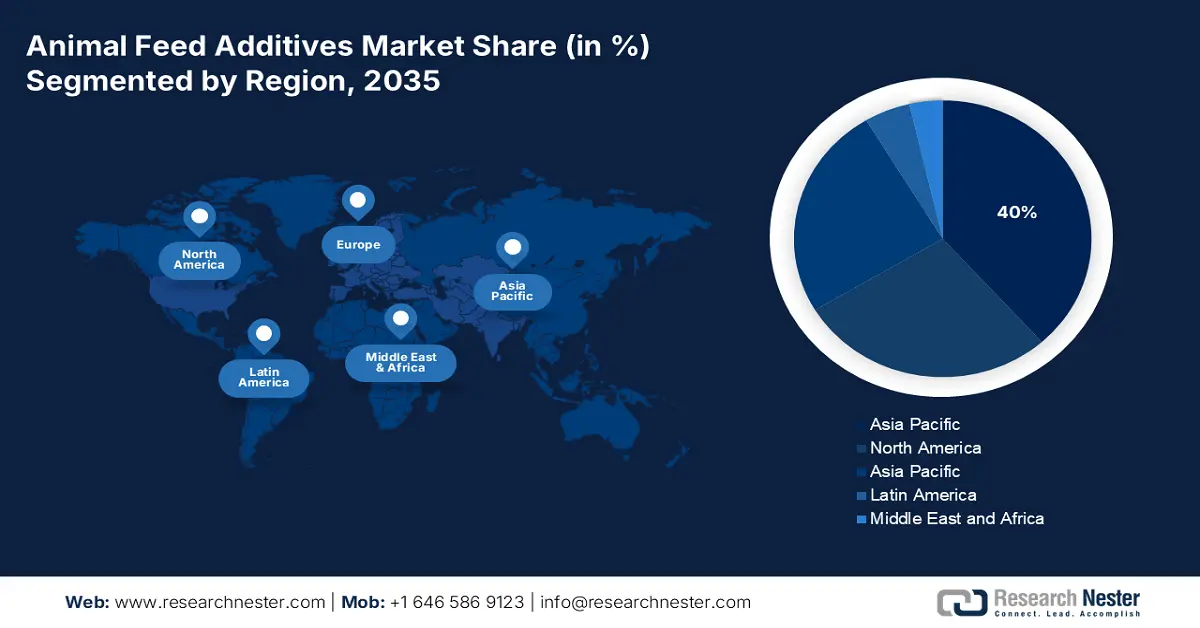
- Asia Pacific animal feed additives market is anticipated to hold a 40% share by 2035, impelled by the large livestock population and rising consumption of dairy and meat products.
- North America market is expanding due to the surge in adoption of antibiotic-free and clean-label feed solutions.
Segment Insights:
- Poultry sub-segment is expected to dominate with a 45% share in the animal feed additives market during the forecast period 2026-2035, owing to the shorter production cycles and higher feed turnover.
- Nutritional additive sub-segment is projected to account for 60% share by 2035, driven by their crucial role in enhancing livestock productivity and health in the market.
Key Growth Trends:
- Intensification of animal farming and rising awareness of the protein intake
- Expansion of the aquaculture industry
Major Challenges:
- Rising cost of raw materials
- Concerns over safety and residues
Key Players: BASF SE (Germany), Archer Daniels Midland Company, Evonik Industries AG (Germany), Koninklijke DSM N.V. (Netherlands), Kemin Industries, Inc. (USA), Novus International, Inc. (USA), Alltech, Inc. (USA), Adisseo France SAS (France), Novozymes A/S (Denmark).
Global Animal Feed Additives Market Forecast and Regional Outlook:
Market Size & Growth Projections:
- 2025 Market Size: USD 55.8 billion
- 2026 Market Size: USD 59.7 billion
- Projected Market Size: USD 108.8 billion by 2035
- Growth Forecasts: 6.9% CAGR (2026-2035)
Key Regional Dynamics:
- Largest Region: Asia Pacific (40% Share by 2035)
- Fastest Growing Region: North America
- Dominating Countries: China, USA, Brazil, Germany, India
- Emerging Countries: Vietnam, Thailand, Indonesia, Mexico, South Africa
Last updated on : 6 November, 2025
Animal Feed Additives Market – Growth Drivers and Challenges
Growth Drivers
- Intensification of animal farming and rising awareness of the protein intake: The global demand for animal protein is increasing significantly, owing to a surge in awareness of the protein intake. According to data published by Harvard Health in June 2023, the recommended dietary allowance for protein must be 0.36 grams per pound of body weight, and people are relying on completing this intake from animals. However, high stocking densities result in nutrient deficiency in animals. In such cases, feed additives play a pivotal role in enhancing overall performance. Countries are adopting intensive livestock production and becoming major consumers of the feed additives.
- Expansion of the aquaculture industry: Aquaculture is expanding at a rapid pace to meet the burgeoning demand for seafood and fish, propelled by population growth and changing preferences for protein-rich diets. Aquatic feed needs additives to improve its nutrient absorption and increase the survival rates of shrimp and farmed fish. Moreover, functional feed additives such as organic acids are utilized to lower the mortality and prevent diseases. According to data published by the Food and Agriculture Organization, global aquaculture and fisheries production surged to 223.2 million tons in 2022, which is a 4.4% increment from the year 2020.
- Growing pet food industries: The rapidly widening pet food industry is acting as a catalyst for the growth of the animal feed additives market. In past years, there has been an exponential surge in pet ownership that has augmented the demand for nutritionally balanced and superior quality pet foods. According to data published by World Animal Foundation in April 2025, there are more than 900 million dogs worldwide out of which 470 million as pets. Also, there were 600 million cats, with 370 million kept as pets. Pet owners are becoming aware of health and wellness, resulting in the rise in demand for premium pet food products with additives.
Challenges
- Rising cost of raw materials: Feed additives depend significantly on raw materials such as vitamins, various herbal extracts, etc., many of which are subject to price volatility. the surge in cost of production usually translates into exorbitant prices for farmers, potentially lowering the rate of adoption, mainly in price-sensitive and emerging markets. Also, there is huge competition from the alternative livestock nutrition strategies.
- Concerns over safety and residues: The issue of residues is a major concern with the synthetic growth promoters and feed additives. Consumers have negative perceptions, which can restrict the product usage, resulting in banning or limiting the key markets. Ensuring safety as well as compliance is a persistent hurdle for manufacturers, needing significant investment in testing and quality assurance. Also, manufacturers are facing the challenge of minimizing the impact on the environment.
Animal Feed Additives Market Size and Forecast:
| Report Attribute | Details |
|---|---|
|
Base Year |
2025 |
|
Forecast Year |
2026-2035 |
|
CAGR |
6.9% |
|
Base Year Market Size (2025) |
USD 55.8 billion |
|
Forecast Year Market Size (2035) |
USD 108.8 billion |
|
Regional Scope |
|
Animal Feed Additives Market Segmentation:
Livestock Type Segment Analysis
The poultry sub-segment is projected to hold the largest animal feed additives market share of 45% during the forecasted period. The dominance of the segment is primarily driven by the shorter cycle of production with higher feed turnover in comparison with other livestock. The burgeoning demand for eggs and poultry meat has propelled farmers to adopt feed additives to enhance the growth rates. The inclusion of intensive and semi-intensive farming practices further increases the requirement for specialized feed solutions.
Function Segment Analysis
The nutritional additive sub-segment is predicted to account for 60% animal feed additives market share by 2035. The dominance of the sub-segment is mainly augmented by the fundamental role of additives in increasing productivity and overall health of the livestock. Nutritional additives render the building blocks required for adequate metabolism and immune functions in animals. Also, the nutritional additives are applicable for a myriad of range of types such as swine, poultry, and aquaculture, ensuring a consistent high demand during the forecasted period.
Form Segment Analysis
The dry or powdered form is set to garner 70% of the market share by 2035, mainly due to ease of handling and storage, as these dry additives have a longer shelf life with a lesser risk related to moisture contamination. Moreover, dry additives are cost-efficient owing to streamlined logistics and adequate formulations, making them a convenient choice for large-scale livestock operations. On the back of these factors, the dry or powdered form sub-segment is experiencing high demand amongst consumers.
Our in-depth analysis of the animal feed additives market includes the following segments:
|
Segment |
Subsegment |
|
Product Type |
|
|
Function
|
|
|
Livestock Type |
|
|
By Form |
|

Vishnu Nair
Head - Global Business DevelopmentCustomize this report to your requirements — connect with our consultant for personalized insights and options.
Animal Feed Additives Market - Regional Analysis
Asia Pacific Market Insights
The Asia Pacific region is anticipated to hold 40% of the animal feed additives market share by 2035, and the dominance is driven by the large livestock population and a surge in consumption of dairy and meat products. Also, the rapid urbanization and increasing disposable incomes are shifting diets towards higher consumption of animal protein. According to UN-Habitat, by 2050, the urban population in Asia is projected to grow by 50% reaching 3.4 billion. Moreover, the governments in the region are supporting feed addictive market by providing subsidies and conducting intensive research initiatives.
The market in India is experiencing staggering growth on the back of the presence of a large livestock population. There is a surge in consumption of milk, and with rising dairy farming, there is a higher need for healthier livestock. The utilization of feed additives aids dairy farmers in garnering increased milk yields and superior quality milk while lowering disease occurrence and reducing the reliance on antibiotics. According to the Press Information Bureau in India, in FY 2023-2024, the milk production reached 239.2 million tons.
The China animal feed additives market growth is driven by the increased meat and egg production in the country. Also, the industry is facing immense pressure to adopt sustainable practices to lower the impact and enhance feed conversion. The farm operations in the country are becoming more commercialized, and there is a higher need for enhancing feed efficiency while keeping cost efficiency intact. The utilization of these additives helps feed formulators optimize protein, reduce waste, and find efficiencies, subsequently propelling the market growth.
North America Market Insights
The North America animal feed additives market is growing with a surge in the shift towards antibiotic-free and clean-label feed solutions. Large commercial livestock operations are being conducted in the region with precision feeding systems and higher adoption of functional additives. In Canada, the growth of the market is propelled by the growing red meat and pork exports, showcasing higher livestock output. Also, export markets need stringent quality and safety standards, and to meet these requirements, farmers are adopting advanced feed additives to ensure healthier animals.
Canada’s Red Meat Exports by Country
|
Country |
2025 Aug (CAD) |
2024 Aug (CAD) |
|
United States |
2,637,820,905 |
2,410,635,276 |
|
Japan |
248,047,507 |
258,201,153 |
|
Mexico |
213,992,863 |
193,602,151 |
|
South Korea |
102,468,278 |
102,496,343 |
|
Vietnam |
73,220,928 |
68,536,744 |
|
Hong Kong |
24,068,716 |
20,921,555 |
|
Colombia |
6,783,781 |
7,855,691 |
|
Philippines |
11,846,225 |
10,210,533 |
|
Taiwan |
15,408,496 |
11,033,605 |
|
Saudi Arabia |
8,982,833 |
8,527,386 |
|
Total Beef Export |
3,371,736,943 |
3,131,857,130 |
Canada’s Red Meat Exports by Country
|
Country |
2025 Aug (CAD) |
2024 Aug (CAD) |
|
Japan |
1,229,929,827 |
972,341,073 |
|
United States |
1,193,199,202 |
1,184,227,908 |
|
South Korea |
332,495,436 |
267,258,398 |
|
Mexico |
328,453,179 |
301,047,441 |
|
China |
269,491,787 |
293,710,375 |
|
Philippines |
179,067,458 |
210,273,390 |
|
Taiwan |
122,749,544 |
90,499,093 |
|
Colombia |
54,832,071 |
43,673,498 |
|
Malaysia |
22,259,693 |
30,555,724 |
|
Australia |
20,647,902 |
31,317,652 |
|
Total (Pork) |
3,899,314,000 |
3,585,949,754 |
Source: Government of Canada
In the U.S, the animal feed additives market growth is driven by exponentially rising demand for high-protein animal products. Also, the consumer preference for antibiotic-free animal production is propelling the demand for superior-quality animal feed. According to data published by Texas Farm Bureau in May 2025, meat consumption among Americans remains high, with 80% of Americans saying they eat meat. Consumers are adopting additives that enhance the absorption of nutrients and lower waste, considered to be important for large-scale U.S. livestock operations.
Europe Market Insights
The animal feed additives market in Europe is fueled by the rise in focus on food safety and antibiotic reduction. The governments in Europe are emphasizing on production of sustainable livestock and doing resource-efficient farming with high demand for phytogenic additives across countries. The demand for more refined feed additives formulations is aiding the growth of the market. The growth in compound feed production and the large tonnage feed base reflects the underlying feed volume demand that creates the addressable market for additives.
The market in the UK is mainly driven by the implementation of the stringent food‑safety and antibiotic‑reduction regulations. There has been a surge in consumer demand for safe and high-quality animal protein products, such as meat and eggs, that are pushing producers to enhance the efficiency of feeds and the performance of the livestock with advanced additives. According to data published by the government in the UK in July 2025, 264 million dozen eggs were produced for human consumption in Q2 2025. The high production volume showcases strong feed demand across the country.
The market in Germany is fueled by the expansion of intensive livestock farming, which has raised the overall feed volume, supporting higher additive adoption. Also, the surge in instances of heat stress is adversely affecting the performance of the livestock. The inclusion of the feed additives ameliorates gut health and immunity and acts as a crucial product to maintain production efficiency. Additionally, the consumers in the country are favoring clean labels on animal products, compelling the feed manufacturers to innovate the functionality of the additives.
Key Animal Feed Additives Market Players:
- BASF SE (Germany)
- Company Overview
- Business Strategy
- Key Product Offerings
- Financial Performance
- Key Performance Indicators
- Risk Analysis
- Recent Development
- Regional Presence
- SWOT Analysis
- Archer Daniels Midland Company
- Evonik Industries AG (Germany)
- Koninklijke DSM N.V. (Netherlands)
- Kemin Industries, Inc. (USA)
- Novus International, Inc. (USA)
- Alltech, Inc. (USA)
- Adisseo France SAS (France)
- Novozymes A/S (Denmark)
The key players in the global animal feed additives market operate in a highly competitive environment. Competition is expected to intensify over the coming years as numerous small and regional manufacturers introduce innovative, cost-effective, and specialty feed additives, such as natural growth promoters, probiotics, and enzyme-based solutions. While a significant portion of the market is dominated by established global companies, smaller players maintain a strong presence in regional and local markets, catering to specific livestock types and niche farming needs.
Below is the list of the key players operating in the global animal feed additives market:
Recent Developments
- In October 2025, BASF introduced Lutavit® A/D3 1000/200 NXT, a next-generation vitamin formulation for animal nutrition that combines vitamin A and vitamin D3 in a single micro‑encapsulated product. The product is manufactured at BASF’s advanced vitamin A formulation plant located at their Verbund site in Ludwigshafen, Germany, leveraging state-of-the-art production facilities.
- In October 2025, DSM‑Firmenich and Bayer signed a Memorandum of Understanding (MOU) to collaborate on sustainability in the animal agriculture sector. The partnership will combine Bayer’s expertise in primary crop life‑cycle assessment (LCA) data with DSM‑Firmenich’s Sustell solution, which is an ISO‑assured framework for environmental footprinting of animal‑protein value chains.
- Report ID: 8226
- Published Date: Nov 06, 2025
- Report Format: PDF, PPT
- Explore a preview of key market trends and insights
- Review sample data tables and segment breakdowns
- Experience the quality of our visual data representations
- Evaluate our report structure and research methodology
- Get a glimpse of competitive landscape analysis
- Understand how regional forecasts are presented
- Assess the depth of company profiling and benchmarking
- Preview how actionable insights can support your strategy
Explore real data and analysis
Frequently Asked Questions (FAQ)
Animal Feed Additives Market Report Scope
Free Sample includes current and historical market size, growth trends, regional charts & tables, company profiles, segment-wise forecasts, and more.
Connect with our Expert


Copyright @ 2026 Research Nester. All Rights Reserved.
