Global Semiconductor Gas Market
1. An Outline of the Global Semiconductor Gas Market
1.1. Market Definition and Segmentation
1.2. Study Assumptions and Abbreviations
2. Research Methodology & Approach
2.1. Primary Research
2.2. Secondary Research
2.3. Data Triangulation
2.4. SPSS Methodology
3. Executive Summary
4. Growth Drivers
5. Major Roadblocks
6. Opportunities
7. Prevalent Trends
8. Government Regulation
9. Growth Outlook
10. Competitive White Space Analysis – Identifying Untapped Market Gaps
11. Risk Overview
12. SWOT
13. Technological Advancement
14. Technology Maturity Matrix for the Semiconductor Gas Market: Recent News
15. Regional Demand
16. Global Semiconductor Gas by Geography – Strategic Comparative Analysis
17. Strategic Segment Analysis: Semiconductor Gas Demand Landscape
18. Semiconductor Gas Demand Trends Driven by rising demand for renewable energy and power management chips, and advancements in semiconductor fabrication equipment and processes. (2027-2036)
19. Root Cause Analysis (RCA) for discovering problems of the Semiconductor Gas Market
20. Porter Five Forces
21. PESTLE
22. Comparative Positioning
23. Global Semiconductor Gas – Key Player Analysis (2036)
24. Competitive Landscape: Key Suppliers/Players
25. Competitive Model: A Detailed Inside View for Investors
26. Company Market Share, 2036 (%)
26.1. Linde
26.2. Air Products
26.3. Air Liquide
26.4. Entegris
26.5. Versum Materials (Merck KGaA)
26.6. BASF
26.7. Solvay
26.8. Taiyo Nippon Sanso
26.9. Showa Denko
26.10. Mitsui Chemicals
26.11. Air Water Inc.
26.12. Chinese Specialty Gas (CSG)
26.13. Yingde Gases
26.14. SK Materials
26.15. SABIC Industrial Gas Division
27. Global Semiconductor Gas Market Outlook
27.1. Market Overview
27.1.1. Market Revenue by Value (USD Million), by Volume (Thousand Kg), and Compound Annual Growth Rate (CAGR)
27.2. Semiconductor Gas Market Segmentation Analysis (2027-2036)
27.2.1. By Gas Type
27.2.1.1. Hydrogen (H₂), Market Value (USD Million), and CAGR, 2027-2036F
27.2.1.2. Carbon Dioxide (CO₂), Market Value (USD Million), and CAGR, 2027-2036F
27.2.1.3. Others, Market Value (USD Million), and CAGR, 2027-2036F
27.2.2. By Process Functions
27.2.2.1. Deposition (CVD / ALD / Epitaxy), Market Value (USD Million), and CAGR, 2027-2036F
27.2.2.2. Etching, Market Value (USD Million), and CAGR, 2027-2036F
27.2.2.3. Cleaning, Market Value (USD Million), and CAGR, 2027-2036F
27.2.2.4. Annealing, Market Value (USD Million), and CAGR, 2027-2036F
27.2.2.5. Oxidation & Reduction, Market Value (USD Million), and CAGR, 2027-2036F
27.2.2.6. Lithography Support, Market Value (USD Million), and CAGR, 2027-2036F
27.2.2.7. Packaging & Back-End, Market Value (USD Million), and CAGR, 2027-2036F
27.2.3. By Semiconductor Manufacturing Stage
27.2.3.1. Front-End-of-Line (FEOL), Market Value (USD Million), and CAGR, 2027-2036F
27.2.3.2. Middle-End-of-Line (MEOL), Market Value (USD Million), and CAGR, 2027-2036F
27.2.3.3. Back-End-of-Line (BEOL), Market Value (USD Million), and CAGR, 2027-2036F
27.2.4. By Application
27.2.4.1. Logic ICs, Market Value (USD Million), and CAGR, 2027-2036F
27.2.4.2. Memory, Market Value (USD Million), and CAGR, 2027-2036F
27.2.4.3. Power Semiconductors, Market Value (USD Million), and CAGR, 2027-2036F
27.2.4.4. Analog & Mixed Signal, Market Value (USD Million), and CAGR, 2027-2036F
27.2.4.5. RF & Communication Chips, Market Value (USD Million), and CAGR, 2027-2036F
27.2.4.6. Packaging, Market Value (USD Million), and CAGR, 2027-2036F
27.2.4.7. Others, Market Value (USD Million), and CAGR, 2027-2036F
27.2.5. By Purity Level
27.2.5.1. Ultra-High Purity (UHP) — 99.999%+, Market Value (USD Million), and CAGR, 2027-2036F
27.2.5.2. Electronic Grade, Market Value (USD Million), and CAGR, 2027-2036F
27.2.5.3. Others, Market Value (USD Million), and CAGR, 2027-2036F
27.2.6. By End user
27.2.6.1. Integrated Device Manufacturers (IDMs), Market Value (USD Million), and CAGR, 2027-2036F
27.2.6.2. Foundries, Market Value (USD Million), and CAGR, 2027-2036F
27.2.6.3. OSAT (Outsourced Semiconductor Assembly & Test), Market Value (USD Million), and CAGR, 2027-2036F
27.2.6.4. Others, Market Value (USD Million), and CAGR, 2027-2036F
27.2.7. Regional Synopsis, Value (USD Million), 2027-2036
27.2.7.1. North America Market Value (USD Million) and CAGR & Y-o-Y Growth Trend, 2027-2036F
27.2.7.2. Europe Market Value (USD Million) and CAGR & Y-o-Y Growth Trend, 2027-2036F
27.2.7.3. Asia Pacific, excluding Japan Market Value (USD Million) and CAGR & Y-o-Y Growth Trend, 2027-2036F
27.2.7.4. Latin America Market Value (USD Million) and CAGR & Y-o-Y Growth Trend, 2027-2036F
27.2.7.5. Middle East and Africa Market Value (USD Million) and CAGR & Y-o-Y Growth Trend, 2027-2036F
28. North America Market
28.1. Overview
28.1.1. Market Value (USD Million), Current and Future Projections, 2027-2036
28.1.2. Increment $ Opportunity Assessment, 2027-2036
28.2. Segmentation (USD Million), 2027-2036, By
28.2.1. By Gas Type
28.2.1.1. Hydrogen (H₂), Market Value (USD Million), and CAGR, 2027-2036F
28.2.1.2. Carbon Dioxide (CO₂), Market Value (USD Million), and CAGR, 2027-2036F
28.2.1.3. Others, Market Value (USD Million), and CAGR, 2027-2036F
28.2.2. By Process Functions
28.2.2.1. Deposition (CVD / ALD / Epitaxy), Market Value (USD Million), and CAGR, 2027-2036F
28.2.2.2. Etching, Market Value (USD Million), and CAGR, 2027-2036F
28.2.2.3. Cleaning, Market Value (USD Million), and CAGR, 2027-2036F
28.2.2.4. Annealing, Market Value (USD Million), and CAGR, 2027-2036F
28.2.2.5. Oxidation & Reduction, Market Value (USD Million), and CAGR, 2027-2036F
28.2.2.6. Lithography Support, Market Value (USD Million), and CAGR, 2027-2036F
28.2.2.7. Packaging & Back-End, Market Value (USD Million), and CAGR, 2027-2036F
28.2.3. By Semiconductor Manufacturing Stage
28.2.3.1. Front-End-of-Line (FEOL), Market Value (USD Million), and CAGR, 2027-2036F
28.2.3.2. Middle-End-of-Line (MEOL), Market Value (USD Million), and CAGR, 2027-2036F
28.2.3.3. Back-End-of-Line (BEOL), Market Value (USD Million), and CAGR, 2027-2036F
28.2.4. By Application
28.2.4.1. Logic ICs, Market Value (USD Million), and CAGR, 2027-2036F
28.2.4.2. Memory, Market Value (USD Million), and CAGR, 2027-2036F
28.2.4.3. Power Semiconductors, Market Value (USD Million), and CAGR, 2027-2036F
28.2.4.4. Analog & Mixed Signal, Market Value (USD Million), and CAGR, 2027-2036F
28.2.4.5. RF & Communication Chips, Market Value (USD Million), and CAGR, 2027-2036F
28.2.4.6. Packaging, Market Value (USD Million), and CAGR, 2027-2036F
28.2.4.7. Others, Market Value (USD Million), and CAGR, 2027-2036F
28.2.5. By Purity Level
28.2.5.1. Ultra-High Purity (UHP) — 99.999%+, Market Value (USD Million), and CAGR, 2027-2036F
28.2.5.2. Electronic Grade, Market Value (USD Million), and CAGR, 2027-2036F
28.2.5.3. Others, Market Value (USD Million), and CAGR, 2027-2036F
28.2.6. By End user
28.2.6.1. Integrated Device Manufacturers (IDMs), Market Value (USD Million), and CAGR, 2027-2036F
28.2.6.2. Foundries, Market Value (USD Million), and CAGR, 2027-2036F
28.2.6.3. OSAT (Outsourced Semiconductor Assembly & Test), Market Value (USD Million), and CAGR, 2027-2036F
28.2.6.4. Others, Market Value (USD Million), and CAGR, 2027-2036F
28.2.7. Country Level Analysis, Value (USD Million)
28.2.7.1. U.S. Market Value (USD Million) and CAGR & Y-o-Y Growth Trend, 2027-2036F
28.2.7.2. Canada Market Value (USD Million) and CAGR & Y-o-Y Growth Trend, 2027-2036F
29. Europe Market
29.1. Overview
29.1.1. Market Value (USD Million), Current and Future Projections, 2027-2036
29.1.2. Increment $ Opportunity Assessment, 2027-2036
29.2. Segmentation (USD Million), 2027-2036, By
29.2.1. By Gas Type
29.2.1.1. Hydrogen (H₂), Market Value (USD Million), and CAGR, 2027-2036F
29.2.1.2. Carbon Dioxide (CO₂), Market Value (USD Million), and CAGR, 2027-2036F
29.2.1.3. Others, Market Value (USD Million), and CAGR, 2027-2036F
29.2.2. By Process Functions
29.2.2.1. Deposition (CVD / ALD / Epitaxy), Market Value (USD Million), and CAGR, 2027-2036F
29.2.2.2. Etching, Market Value (USD Million), and CAGR, 2027-2036F
29.2.2.3. Cleaning, Market Value (USD Million), and CAGR, 2027-2036F
29.2.2.4. Annealing, Market Value (USD Million), and CAGR, 2027-2036F
29.2.2.5. Oxidation & Reduction, Market Value (USD Million), and CAGR, 2027-2036F
29.2.2.6. Lithography Support, Market Value (USD Million), and CAGR, 2027-2036F
29.2.2.7. Packaging & Back-End, Market Value (USD Million), and CAGR, 2027-2036F
29.2.3. By Semiconductor Manufacturing Stage
29.2.3.1. Front-End-of-Line (FEOL), Market Value (USD Million), and CAGR, 2027-2036F
29.2.3.2. Middle-End-of-Line (MEOL), Market Value (USD Million), and CAGR, 2027-2036F
29.2.3.3. Back-End-of-Line (BEOL), Market Value (USD Million), and CAGR, 2027-2036F
29.2.4. By Application
29.2.4.1. Logic ICs, Market Value (USD Million), and CAGR, 2027-2036F
29.2.4.2. Memory, Market Value (USD Million), and CAGR, 2027-2036F
29.2.4.3. Power Semiconductors, Market Value (USD Million), and CAGR, 2027-2036F
29.2.4.4. Analog & Mixed Signal, Market Value (USD Million), and CAGR, 2027-2036F
29.2.4.5. RF & Communication Chips, Market Value (USD Million), and CAGR, 2027-2036F
29.2.4.6. Packaging, Market Value (USD Million), and CAGR, 2027-2036F
29.2.4.7. Others, Market Value (USD Million), and CAGR, 2027-2036F
29.2.5. By Purity Level
29.2.5.1. Ultra-High Purity (UHP) — 99.999%+, Market Value (USD Million), and CAGR, 2027-2036F
29.2.5.2. Electronic Grade, Market Value (USD Million), and CAGR, 2027-2036F
29.2.5.3. Others, Market Value (USD Million), and CAGR, 2027-2036F
29.2.6. By End user
29.2.6.1. Integrated Device Manufacturers (IDMs), Market Value (USD Million), and CAGR, 2027-2036F
29.2.6.2. Foundries, Market Value (USD Million), and CAGR, 2027-2036F
29.2.6.3. OSAT (Outsourced Semiconductor Assembly & Test), Market Value (USD Million), and CAGR, 2027-2036F
29.2.6.4. Others, Market Value (USD Million), and CAGR, 2027-2036F
29.2.7. Country Level Analysis, Value (USD Million)
29.2.7.1. UK Market Value (USD Million) and CAGR & Y-o-Y Growth Trend, 2027-2036F
29.2.7.2. Germany Market Value (USD Million) and CAGR & Y-o-Y Growth Trend, 2027-2036F
29.2.7.3. France Market Value (USD Million) and CAGR & Y-o-Y Growth Trend, 2027-2036F
29.2.7.4. Italy Market Value (USD Million) and CAGR & Y-o-Y Growth Trend, 2027-2036F
29.2.7.5. Spain Market Value (USD Million) and CAGR & Y-o-Y Growth Trend, 2027-2036F
29.2.7.6. Netherlands Market Value (USD Million) and CAGR & Y-o-Y Growth Trend, 2027-2036F
29.2.7.7. Russia Market Value (USD Million) and CAGR & Y-o-Y Growth Trend, 2027-2036F
29.2.7.8. Switzerland Market Value (USD Million) and CAGR & Y-o-Y Growth Trend, 2027-2036F
29.2.7.9. Poland Market Value (USD Million) and CAGR & Y-o-Y Growth Trend, 2027-2036F
29.2.7.10. Belgium Market Value (USD Million) and CAGR & Y-o-Y Growth Trend, 2027-2036F
29.2.7.11. Rest of Europe Market Value (USD Million) and CAGR & Y-o-Y Growth Trend, 2027-2036F
30. Asia Pacific, excluding Japan Market
30.1. Overview
30.1.1. Market Value (USD Million), Current and Future Projections, 2027-2036
30.1.2. Increment $ Opportunity Assessment, 2027-2036
30.2. Segmentation (USD Million), 2027-2036, By
30.2.1. By Gas Type
30.2.1.1. Hydrogen (H₂), Market Value (USD Million), and CAGR, 2027-2036F
30.2.1.2. Carbon Dioxide (CO₂), Market Value (USD Million), and CAGR, 2027-2036F
30.2.1.3. Others, Market Value (USD Million), and CAGR, 2027-2036F
30.2.2. By Process Functions
30.2.2.1. Deposition (CVD / ALD / Epitaxy), Market Value (USD Million), and CAGR, 2027-2036F
30.2.2.2. Etching, Market Value (USD Million), and CAGR, 2027-2036F
30.2.2.3. Cleaning, Market Value (USD Million), and CAGR, 2027-2036F
30.2.2.4. Annealing, Market Value (USD Million), and CAGR, 2027-2036F
30.2.2.5. Oxidation & Reduction, Market Value (USD Million), and CAGR, 2027-2036F
30.2.2.6. Lithography Support, Market Value (USD Million), and CAGR, 2027-2036F
30.2.2.7. Packaging & Back-End, Market Value (USD Million), and CAGR, 2027-2036F
30.2.3. By Semiconductor Manufacturing Stage
30.2.3.1. Front-End-of-Line (FEOL), Market Value (USD Million), and CAGR, 2027-2036F
30.2.3.2. Middle-End-of-Line (MEOL), Market Value (USD Million), and CAGR, 2027-2036F
30.2.3.3. Back-End-of-Line (BEOL), Market Value (USD Million), and CAGR, 2027-2036F
30.2.4. By Application
30.2.4.1. Logic ICs, Market Value (USD Million), and CAGR, 2027-2036F
30.2.4.2. Memory, Market Value (USD Million), and CAGR, 2027-2036F
30.2.4.3. Power Semiconductors, Market Value (USD Million), and CAGR, 2027-2036F
30.2.4.4. Analog & Mixed Signal, Market Value (USD Million), and CAGR, 2027-2036F
30.2.4.5. RF & Communication Chips, Market Value (USD Million), and CAGR, 2027-2036F
30.2.4.6. Packaging, Market Value (USD Million), and CAGR, 2027-2036F
30.2.4.7. Others, Market Value (USD Million), and CAGR, 2027-2036F
30.2.5. By Purity Level
30.2.5.1. Ultra-High Purity (UHP) — 99.999%+, Market Value (USD Million), and CAGR, 2027-2036F
30.2.5.2. Electronic Grade, Market Value (USD Million), and CAGR, 2027-2036F
30.2.5.3. Others, Market Value (USD Million), and CAGR, 2027-2036F
30.2.6. By End user
30.2.6.1. Integrated Device Manufacturers (IDMs), Market Value (USD Million), and CAGR, 2027-2036F
30.2.6.2. Foundries, Market Value (USD Million), and CAGR, 2027-2036F
30.2.6.3. OSAT (Outsourced Semiconductor Assembly & Test), Market Value (USD Million), and CAGR, 2027-2036F
30.2.6.4. Others, Market Value (USD Million), and CAGR, 2027-2036F
30.2.7. Country Level Analysis, Value (USD Million)
30.2.7.1. China Market Value (USD Million) and CAGR & Y-o-Y Growth Trend, 2027-2036F
30.2.7.2. India Market Value (USD Million) and CAGR & Y-o-Y Growth Trend, 2027-2036F
30.2.7.3. South Korea Market Value (USD Million) and CAGR & Y-o-Y Growth Trend, 2027-2036F
30.2.7.4. Australia Market Value (USD Million) and CAGR & Y-o-Y Growth Trend, 2027-2036F
30.2.7.5. Indonesia Market Value (USD Million) and CAGR & Y-o-Y Growth Trend, 2027-2036F
30.2.7.6. Malaysia Market Value (USD Million) and CAGR & Y-o-Y Growth Trend, 2027-2036F
30.2.7.7. Vietnam Market Value (USD Million) and CAGR & Y-o-Y Growth Trend, 2027-2036F
30.2.7.8. Thailand Market Value (USD Million) and CAGR & Y-o-Y Growth Trend, 2027-2036F
30.2.7.9. Singapore Market Value (USD Million) and CAGR & Y-o-Y Growth Trend, 2027-2036F
30.2.7.10. New Zealand Market Value (USD Million) and CAGR & Y-o-Y Growth Trend, 2027-2036F
30.2.7.11. Rest of Asia Pacific Excluding Japan Market Value (USD Million) and CAGR & Y-o-Y Growth Trend, 2027-2036F
31. Latin America Market
31.1. Overview
31.1.1. Market Value (USD Million), Current and Future Projections, 2027-2036
31.1.2. Increment $ Opportunity Assessment, 2027-2036
31.1.3. Year-on-Year Growth Forecast (%)
31.2. Segmentation (USD Million), 2027-2036, By
31.2.1. By Gas Type
31.2.1.1. Hydrogen (H₂), Market Value (USD Million), and CAGR, 2027-2036F
31.2.1.2. Carbon Dioxide (CO₂), Market Value (USD Million), and CAGR, 2027-2036F
31.2.1.3. Others, Market Value (USD Million), and CAGR, 2027-2036F
31.2.2. By Process Functions
31.2.2.1. Deposition (CVD / ALD / Epitaxy), Market Value (USD Million), and CAGR, 2027-2036F
31.2.2.2. Etching, Market Value (USD Million), and CAGR, 2027-2036F
31.2.2.3. Cleaning, Market Value (USD Million), and CAGR, 2027-2036F
31.2.2.4. Annealing, Market Value (USD Million), and CAGR, 2027-2036F
31.2.2.5. Oxidation & Reduction, Market Value (USD Million), and CAGR, 2027-2036F
31.2.2.6. Lithography Support, Market Value (USD Million), and CAGR, 2027-2036F
31.2.2.7. Packaging & Back-End, Market Value (USD Million), and CAGR, 2027-2036F
31.2.3. By Semiconductor Manufacturing Stage
31.2.3.1. Front-End-of-Line (FEOL), Market Value (USD Million), and CAGR, 2027-2036F
31.2.3.2. Middle-End-of-Line (MEOL), Market Value (USD Million), and CAGR, 2027-2036F
31.2.3.3. Back-End-of-Line (BEOL), Market Value (USD Million), and CAGR, 2027-2036F
31.2.4. By Application
31.2.4.1. Logic ICs, Market Value (USD Million), and CAGR, 2027-2036F
31.2.4.2. Memory, Market Value (USD Million), and CAGR, 2027-2036F
31.2.4.3. Power Semiconductors, Market Value (USD Million), and CAGR, 2027-2036F
31.2.4.4. Analog & Mixed Signal, Market Value (USD Million), and CAGR, 2027-2036F
31.2.4.5. RF & Communication Chips, Market Value (USD Million), and CAGR, 2027-2036F
31.2.4.6. Packaging, Market Value (USD Million), and CAGR, 2027-2036F
31.2.4.7. Others, Market Value (USD Million), and CAGR, 2027-2036F
31.2.5. By Purity Level
31.2.5.1. Ultra-High Purity (UHP) — 99.999%+, Market Value (USD Million), and CAGR, 2027-2036F
31.2.5.2. Electronic Grade, Market Value (USD Million), and CAGR, 2027-2036F
31.2.5.3. Others, Market Value (USD Million), and CAGR, 2027-2036F
31.2.6. By End user
31.2.6.1. Integrated Device Manufacturers (IDMs), Market Value (USD Million), and CAGR, 2027-2036F
31.2.6.2. Foundries, Market Value (USD Million), and CAGR, 2027-2036F
31.2.6.3. OSAT (Outsourced Semiconductor Assembly & Test), Market Value (USD Million), and CAGR, 2027-2036F
31.2.6.4. Others, Market Value (USD Million), and CAGR, 2027-2036F
31.2.7. Country Level Analysis, Value (USD Million)
31.2.7.1. Brazil Market Value (USD Million) and CAGR & Y-o-Y Growth Trend, 2027-2036F
31.2.7.2. Argentina Market Value (USD Million) and CAGR & Y-o-Y Growth Trend, 2027-2036F
31.2.7.3. Mexico Market Value (USD Million) and CAGR & Y-o-Y Growth Trend, 2027-2036F
31.2.7.4. Rest of Latin America Market Value (USD Million) and CAGR & Y-o-Y Growth Trend, 2027-2036F
32. Middle East & Africa Market
32.1. Overview
32.1.1. Market Value (USD Million), Current and Future Projections, 2027-2036
32.1.2. Increment $ Opportunity Assessment, 2027-2036
32.1.3. Year-on-Year Growth Forecast (%)
32.2. Segmentation (USD Million), 2027-2036, By
32.2.1. By Gas Type
32.2.1.1. Hydrogen (H₂), Market Value (USD Million), and CAGR, 2027-2036F
32.2.1.2. Carbon Dioxide (CO₂), Market Value (USD Million), and CAGR, 2027-2036F
32.2.1.3. Others, Market Value (USD Million), and CAGR, 2027-2036F
32.2.2. By Process Functions
32.2.2.1. Deposition (CVD / ALD / Epitaxy), Market Value (USD Million), and CAGR, 2027-2036F
32.2.2.2. Etching, Market Value (USD Million), and CAGR, 2027-2036F
32.2.2.3. Cleaning, Market Value (USD Million), and CAGR, 2027-2036F
32.2.2.4. Annealing, Market Value (USD Million), and CAGR, 2027-2036F
32.2.2.5. Oxidation & Reduction, Market Value (USD Million), and CAGR, 2027-2036F
32.2.2.6. Lithography Support, Market Value (USD Million), and CAGR, 2027-2036F
32.2.2.7. Packaging & Back-End, Market Value (USD Million), and CAGR, 2027-2036F
32.2.3. By Semiconductor Manufacturing Stage
32.2.3.1. Front-End-of-Line (FEOL), Market Value (USD Million), and CAGR, 2027-2036F
32.2.3.2. Middle-End-of-Line (MEOL), Market Value (USD Million), and CAGR, 2027-2036F
32.2.3.3. Back-End-of-Line (BEOL), Market Value (USD Million), and CAGR, 2027-2036F
32.2.4. By Application
32.2.4.1. Logic ICs, Market Value (USD Million), and CAGR, 2027-2036F
32.2.4.2. Memory, Market Value (USD Million), and CAGR, 2027-2036F
32.2.4.3. Power Semiconductors, Market Value (USD Million), and CAGR, 2027-2036F
32.2.4.4. Analog & Mixed Signal, Market Value (USD Million), and CAGR, 2027-2036F
32.2.4.5. RF & Communication Chips, Market Value (USD Million), and CAGR, 2027-2036F
32.2.4.6. Packaging, Market Value (USD Million), and CAGR, 2027-2036F
32.2.4.7. Others, Market Value (USD Million), and CAGR, 2027-2036F
32.2.5. By Purity Level
32.2.5.1. Ultra-High Purity (UHP) — 99.999%+, Market Value (USD Million), and CAGR, 2027-2036F
32.2.5.2. Electronic Grade, Market Value (USD Million), and CAGR, 2027-2036F
32.2.5.3. Others, Market Value (USD Million), and CAGR, 2027-2036F
32.2.6. By End user
32.2.6.1. Integrated Device Manufacturers (IDMs), Market Value (USD Million), and CAGR, 2027-2036F
32.2.6.2. Foundries, Market Value (USD Million), and CAGR, 2027-2036F
32.2.6.3. OSAT (Outsourced Semiconductor Assembly & Test), Market Value (USD Million), and CAGR, 2027-2036F
32.2.6.4. Others, Market Value (USD Million), and CAGR, 2027-2036F
32.2.7. Country Level Analysis, Value (USD Million)
32.2.7.1. Saudi Arabia Market Value (USD Million) and CAGR & Y-o-Y Growth Trend, 2027-2036F
32.2.7.2. UAE Market Value (USD Million) and CAGR & Y-o-Y Growth Trend, 2027-2036F
32.2.7.3. Israel Market Value (USD Million) and CAGR & Y-o-Y Growth Trend, 2027-2036F
32.2.7.4. Qatar Market Value (USD Million) and CAGR & Y-o-Y Growth Trend, 2027-2036F
32.2.7.5. Kuwait Market Value (USD Million) and CAGR & Y-o-Y Growth Trend, 2027-2036F
32.2.7.6. Oman Market Value (USD Million) and CAGR & Y-o-Y Growth Trend, 2027-2036F
32.2.7.7. South Africa Market Value (USD Million) and CAGR & Y-o-Y Growth Trend, 2027-2036F
32.2.7.8. Rest of Middle East & Africa Market Value (USD Million) and CAGR & Y-o-Y Growth Trend, 2027-2036F
33. Japan Market
33.1. Overview
33.1.1. Market Value (USD Million), Current and Future Projections, 2027-2036
33.1.2. Increment $ Opportunity Assessment, 2027-2036
33.1.3. Year-on-Year Growth Forecast (%)
33.2. Segmentation (USD Million), 2027-2036, By
33.2.1. By Gas Type
33.2.1.1. Hydrogen (H₂), Market Value (USD Million), and CAGR, 2027-2036F
33.2.1.2. Carbon Dioxide (CO₂), Market Value (USD Million), and CAGR, 2027-2036F
33.2.1.3. Others, Market Value (USD Million), and CAGR, 2027-2036F
33.2.2. By Process Functions
33.2.2.1. Deposition (CVD / ALD / Epitaxy), Market Value (USD Million), and CAGR, 2027-2036F
33.2.2.2. Etching, Market Value (USD Million), and CAGR, 2027-2036F
33.2.2.3. Cleaning, Market Value (USD Million), and CAGR, 2027-2036F
33.2.2.4. Annealing, Market Value (USD Million), and CAGR, 2027-2036F
33.2.2.5. Oxidation & Reduction, Market Value (USD Million), and CAGR, 2027-2036F
33.2.2.6. Lithography Support, Market Value (USD Million), and CAGR, 2027-2036F
33.2.2.7. Packaging & Back-End, Market Value (USD Million), and CAGR, 2027-2036F
33.2.3. By Semiconductor Manufacturing Stage
33.2.3.1. Front-End-of-Line (FEOL), Market Value (USD Million), and CAGR, 2027-2036F
33.2.3.2. Middle-End-of-Line (MEOL), Market Value (USD Million), and CAGR, 2027-2036F
33.2.3.3. Back-End-of-Line (BEOL), Market Value (USD Million), and CAGR, 2027-2036F
33.2.4. By Application
33.2.4.1. Logic ICs, Market Value (USD Million), and CAGR, 2027-2036F
33.2.4.2. Memory, Market Value (USD Million), and CAGR, 2027-2036F
33.2.4.3. Power Semiconductors, Market Value (USD Million), and CAGR, 2027-2036F
33.2.4.4. Analog & Mixed Signal, Market Value (USD Million), and CAGR, 2027-2036F
33.2.4.5. RF & Communication Chips, Market Value (USD Million), and CAGR, 2027-2036F
33.2.4.6. Packaging, Market Value (USD Million), and CAGR, 2027-2036F
33.2.4.7. Others, Market Value (USD Million), and CAGR, 2027-2036F
33.2.5. By Purity Level
33.2.5.1. Ultra-High Purity (UHP) — 99.999%+, Market Value (USD Million), and CAGR, 2027-2036F
33.2.5.2. Electronic Grade, Market Value (USD Million), and CAGR, 2027-2036F
33.2.5.3. Others, Market Value (USD Million), and CAGR, 2027-2036F
33.2.6. By End user
33.2.6.1. Integrated Device Manufacturers (IDMs), Market Value (USD Million), and CAGR, 2027-2036F
33.2.6.2. Foundries, Market Value (USD Million), and CAGR, 2027-2036F
33.2.6.3. OSAT (Outsourced Semiconductor Assembly & Test), Market Value (USD Million), and CAGR, 2027-2036F
33.2.6.4. Others, Market Value (USD Million), and CAGR, 2027-2036F
34. Global Economic Scenario
34.1. World Economic Outlook
35. About Research Nester
35.1. Our Global Clientele
35.2. We Serve Clients Across World
Semiconductor Gas Market Outlook:
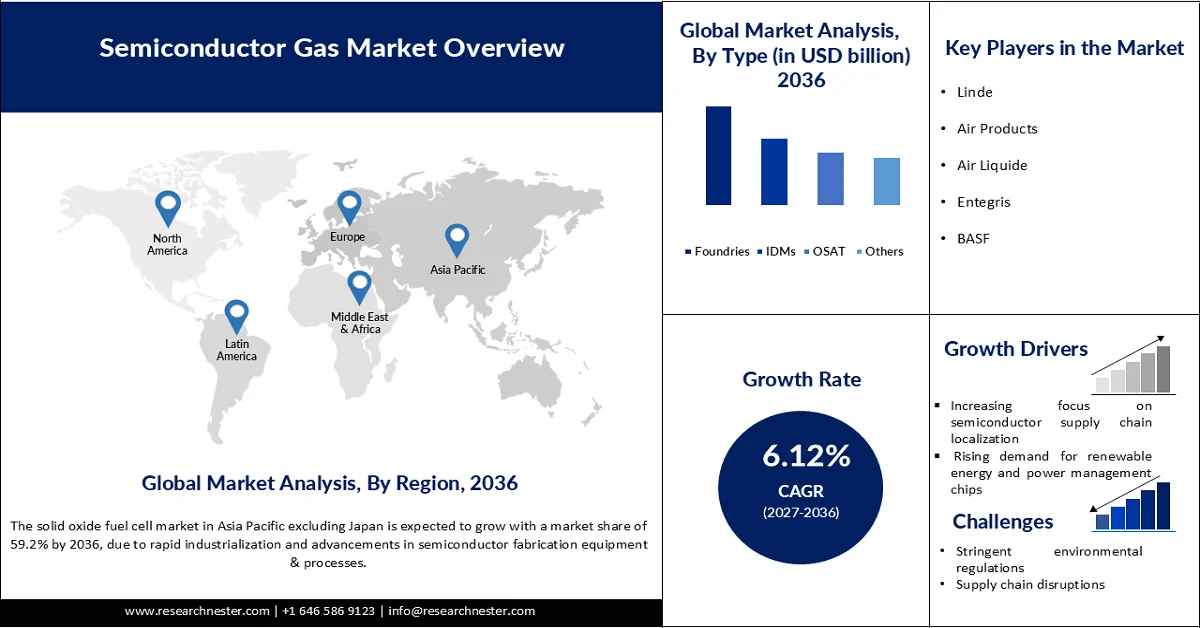
Semiconductor Gas Market size was valued at USD 12.48 billion in 2026 and is projected to cross USD 23.11 billion by the end of 2036, expanding at more than 6.12% CAGR during the forecast period, i.e., 2027-2036. In 2027, the industry size of semiconductor gas is estimated at USD 13.54 billion.
The swift rise in semiconductor production globally has boosted the sales of specialized gases. The increasing demand for advanced chips ranging from consumer electronics to industrial automation is fueling the demand for semiconductor gases. The Semiconductor Industry Association (SIA) disclosed that the global semiconductor sales reached USD 120.6 billion in May 2026. This was 9.2% higher than April 2026, when sales stood at USD 110.5 billion, and 104.1% above the May 2025 level of USD 59.1 billion.
Further, the supportive government policies and high investments in boosting domestic semiconductor manufacturing are projected to drive the overall market growth in the years ahead. By region, year-on-year sales in April rose in the Americas by 132.2%, Asia Pacific/All Other by 118.9%, China by 88.8%, Europe by 60.7%, and Japan by 23.8%. On a month-to-month basis, sales increased in China by 10.7%, Asia Pacific/All Other by 9.2%, the Americas by 8.6%, Europe by 7.3%, and Japan by 6.4%.
Key Semiconductor Gas Market Insights Summary:
Regional Highlights:
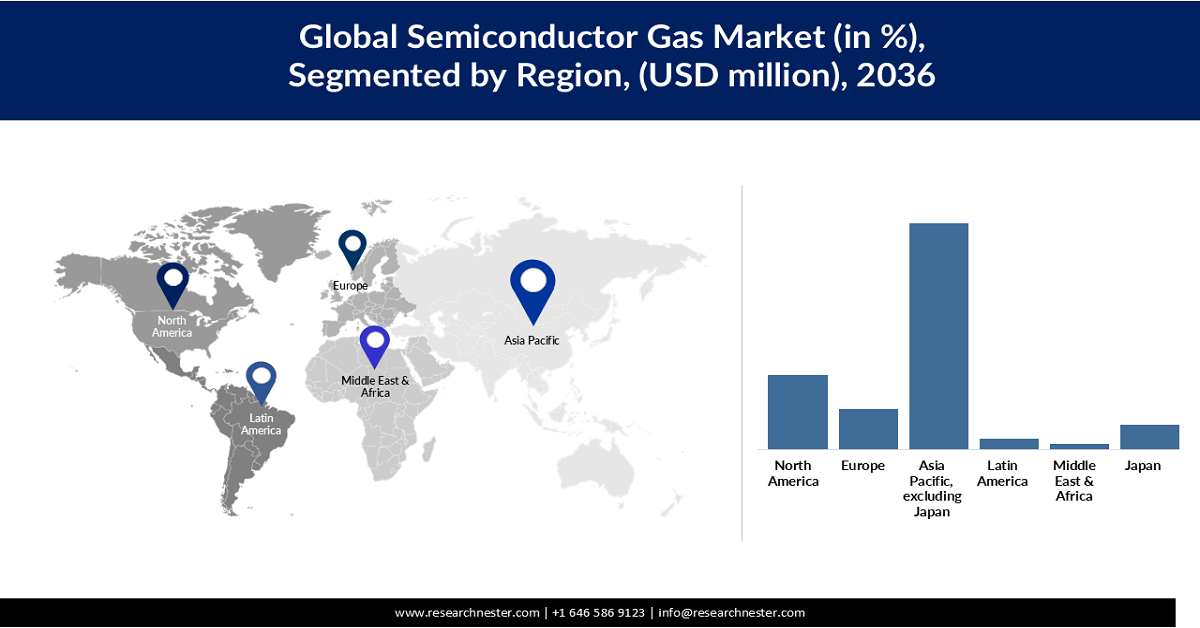
- The Asia Pacific excluding Japan (APEJ) market is anticipated to secure 59.2% of the global share by 2036, underpinned by the region's expanding semiconductor manufacturing ecosystem and sustained investments in wafer fabrication capacity
- Japan's market is expected to witness notable growth through 2036, bolstered by its established semiconductor manufacturing ecosystem, advanced materials expertise, and rising investments in next-generation semiconductor technologies
- The U.S. semiconductor gas market is expected to increase at a CAGR of 6.29% from 2027 to 2036, mainly owing to the robust investments in advanced electronics production and data center expansion
- Japan is projected to capture nearly 6.4% of the global market share by 2036, supported by continuous technological advancements and a rise in domestic semiconductor development
Segment Insights:
- The deposition processes, including chemical vapor deposition (CVD), atomic layer deposition (ALD), and epitaxy, segment of the market is projected to hold 35.9% of the Japan market by 2036, fueled by the increasing adoption of advanced technology nodes such as 5 nm, 3 nm, and the transition toward 2 nm
- The foundries segment is forecast to account for 48.2% of the semiconductor gas market share by 2036, stimulated by increasing investments in new wafer fabrication plants and capacity expansions by leading foundries
Key Growth Trends:
- Expanding consumer electronics industry
- Rising data center and cloud infrastructure investments
Major Challenges:
- High cost of ultra-high-purity gas production
- Volatility in energy & raw material prices
Key Players: Linde (UK), Air Products (U.S.), Air Liquide (France), Entegris (U.S.), Merck KGaA (formerly Versum Materials) (Germany), BASF (Germany), Solvay (Belgium), Taiyo Nippon Sanso (Japan), Resonac Corporation (formerly Showa Denko) (Japan), Mitsui Chemicals (Japan), Air Water Inc. (Japan), Chinese Specialty Gas (China), Yingde Gases (China), SK Materials (South Korea), SABIC Industrial Gas Division (Saudi Arabia).
Global Semiconductor Gas Market Forecast and Regional Outlook:
Market Size & Growth Projections:
- 2026 Market Size: USD 12.48 billion
- 2027 Market Size: USD 13.54 billion
- Projected Market Size: USD 23.11 billion by 2036
- Growth Forecasts: 6.12% CAGR (2027-2036)
Key Regional Dynamics:
- Largest Region: Asia Pacific excluding Japan (59.2% Share by 2036)
- Fastest Growing Region: Japan
- Dominating Countries: China, United States, Germany, Japan, India
- Emerging Countries: Vietnam, Indonesia, Thailand, Brazil, Mexico
Last updated on : 13 July, 2026
Semiconductor Gas Market - Growth Drivers and Challenges
Growth Drivers
- Expanding consumer electronics industry: The continuous advancements in the consumer electronics industry are projected to propel the sales of semiconductor gases. The reliance of electronic devices on advanced semiconductor components for enhanced performance also contributes to the increasing trade of specialized gases. In 2024, the Observatory of Economic Complexity (OEC) disclosed that the worldwide trade in parts for electronic integrated circuits reached USD 20.3 billion. It was led by China as the largest exporter at USD 3.37 billion, followed by Chinese Taipei and the U.S. Further, the largest importers of the same were Malaysia at USD 4.7 billion and Thailand at USD 3.02 billion, among others.
In the same year, global trade in parts for semiconductor devices and similar products reached USD 5.33 billion. Thus, the rising adoption of smartphones, computers, laptops, and more is set to drive the trade of semiconductor gases. - Rising data center and cloud infrastructure investments: The rapid expansion of data centers and cloud computing infrastructure is anticipated to fuel the sales of semiconductor gases. The growing adoption of advanced technologies such as AI and ML directly drives the need for specialized components and consequently semiconductor gases. For example, Equinix, one of the leading internet and data center companies, is actively expanding its data center network across the world.
The company currently operates 281 data centers worldwide and plans to open several new facilities in 2026 and 2027 across key markets including Spain, Nigeria, France, Türkiye, Brazil, the U.S., Japan, Singapore, and the UK. These expansions are focused on building AI-ready sites with strong emphasis on sustainability, targeting 100% renewable energy by 2030. Thus, this is set to have a strong influence on the sales of semiconductor gases. - Increasing demand from automotive electronics: The electrification and modernization of vehicles is expected to propel the sales of semiconductor gases. Modern vehicles contain significantly more semiconductor devices than conventional automobiles, which directly contributes to the increasing trade of specialized gases. The International Energy Agency (IEA) disclosed that global electric car sales rose by 20% in 2025 and crossed 20 million units, so electric vehicles made up one in four new cars sold. The continuous rise in trade of EVs is set to double the revenues of semiconductor gas manufacturers in the years ahead.
Challenges
- High cost of ultra-high-purity gas production: The production of ultra-high-purity (UHP) semiconductor gases involves highly advanced infrastructure and specialized materials. This directly increases the final costs of semiconductor gas solutions. Many small enterprises refrain from investing in these technologies owing to budget constraints. Localization of the supply chain and mass production is expected to aid key players in overcoming this challenge.
- Volatility in energy & raw material prices: The semiconductor gas industry is highly dependent on the continuous availability of critical raw materials. Disruptions in the supply of raw materials significantly hamper the production of semiconductor gas. Long-term supply agreements and investments in gas recycling technologies are expected to help leading companies overcome this challenge.
Semiconductor Gas Market Size and Forecast:
| Report Attribute | Details |
|---|---|
|
Base Year |
2026 |
|
Forecast Period |
2027-2036 |
|
CAGR |
6.12% |
|
Base Year Market Size (2026) |
USD 12.48 billion |
|
Forecast Year Market Size (2036) |
USD 23.11 billion |
|
Regional Scope |
|
Semiconductor Gas Market Segmentation:
Type Segment Analysis
The deposition processes, including chemical vapor deposition (CVD), atomic layer deposition (ALD), and epitaxy, segment is projected to capture 35.9% of the Japan market through 2036. The increasing adoption of advanced technology nodes, including 5 nm, 3 nm, and the transition toward 2 nm, is also increasing the number of deposition steps required during wafer fabrication. In July 2025, Rapidus revealed that it had successfully tested its gate-all-around transistors for advanced 2nm chips. The company also noted that its pilot line at the IIM-1 foundry in Hokkaido is already in operation.
End user Segment Analysis
The foundries segment is estimated to account for 48.2% of the semiconductor gas market share by 2036. Foundries serve a broad customer base across consumer electronics, automotive, telecommunications, industrial automation, healthcare, and data center applications. The increasing investments in new wafer fabrication plants and capacity expansions by leading foundries are strengthening long-term demand for semiconductor gases. The large-scale manufacturing operations and continuous production schedules are making foundries the largest consumers of semiconductor gases.
Application Segment Analysis
The logic ICs segment is anticipated to hold 37% of the global market share throughout the forecast period. The widespread use of logic ICs across every electronic device drives the consumption of specialty gases. The growing demand for digital technologies has also substantially increased global production of advanced logic chips. SIA reveals that in 2024, global sales of logic products reached USD 215.8 billion, making it the top product category by revenue. Thus, digital transformation across industries is set to increase logic IC adoption and consequently semiconductor gas consumption.
Our in-depth analysis of the semiconductor gas includes the following segments:
|
Segments |
Subsegments |
|
Gas Type |
|
|
Process Functions
|
|
|
Semiconductor Manufacturing Stages |
|
|
Application |
|
|
Purity Level |
|
|
End user |
|

Vishnu Nair
Head - Global Business DevelopmentCustomize this report to your requirements — connect with our consultant for personalized insights and options.
Semiconductor Gas Market - Regional Analysis
Asia Pacific Excluding Japan Market Insights
Asia Pacific excluding Japan (APEJ) is projected to capture 59.2% of the global semiconductor gas market share through 2036. The market growth is supported by the region's extensive semiconductor manufacturing ecosystem and continuous investments in wafer fabrication capacity. China, South Korea, Taiwan, and India are some of the key marketplaces for semiconductor gas producers. These markets are strengthening their semiconductor value chains through government incentives, foreign direct investment, and capacity expansion projects. Thus, the expanding chip production is boosting demand for high-purity specialty and bulk gases.
The China semiconductor gas market is expected to be valued at USD 5,482.14 in 2036. The expanding domestic semiconductor manufacturing and strengthening supply chain resilience are set to boost the sales of specialty gases. SIA estimates that nearly 75% of the world’s semiconductor manufacturing capacity is concentrated in China and East Asia. The country has significantly increased investments in wafer fabrication facilities, which is also propelling the consumption of specialty gases.
The South Korea market is estimated to increase at a CAGR of 6.24% from 2027 to 2036. The country’s leadership in memory semiconductor manufacturing and its expanding capabilities in advanced logic chip production are propelling the consumption of specialty gases. According to Invest Korea, the country has the third-largest semiconductor manufacturing base in the world, after China and Taiwan. It makes up about 17.9% of global semiconductor production capacity. Further, supportive government policies and investments are supporting South Korea’s market growth.
Japan Semiconductor Gas Market Insights
The Japan semiconductor gas market is set to be valued at USD 935.25 million in 2027. The market growth is expected to be supported by its long-established semiconductor manufacturing ecosystem and advanced materials expertise. The expanding specialty chemical production is also contributing to the market growth. The rising investments in next-generation semiconductor technologies are further boosting the consumption of specialty gases.
The country's established consumer electronics sector is propelling the consumption of semiconductor gases. The Japan Electronics and Information Technology Industry Association (JEITA) disclosed that in 2025, nearly JPY 11.7 trillion worth of domestic electronics production was reported. The strategic public-private investments in semiconductor production are anticipated to fuel the trade of specialty gases.
Japan Semiconductor Gas Market Size and Forecast
|
Report Attribute |
Details |
|
Base Year Market Size and Volume (2026) |
USD 868.54 million; 65,341.26 thousand Kg |
|
Forecast Year Market Size and Volume (2036) |
USD 1,484.18 million; 100,023.19 thousand Kg |
|
CAGR (2027-2036) |
5.27% |
North America Market Insights
North America is estimated to hold 19.5% of the global market share by 2036. The market growth is supported by increasing investments in domestic semiconductor manufacturing and advanced research. The supply chain localization tactics are also propelling the trade of specialty gases. Continuous innovation in chip design and manufacturing, supported by public-private investments, is poised to fuel the consumption of semiconductor gases.
The U.S. semiconductor gas market is set to reach USD 3,792.61 million by the end of the forecast period. The increasing expansion of domestic semiconductor manufacturing is expected to propel the consumption of specialty gases. Federal initiatives aimed at strengthening the national semiconductor ecosystem have encouraged the trade of specialty gases. SIA reveals that the U.S. semiconductor sector has expanded between 202 and 2025, with announced investments of more than half a trillion dollars across over 100 chip-related projects in 28 states.
Canada's semiconductor gas market is estimated to be valued at USD 406.68 million in 2026. The growing investments in semiconductor research are propelling the sales of semiconductor gases. In April 2024, the government announced a new federal investment of nearly USD 42.26 million (CAD 59.9 million) to support projects by IBM Canada and C2MI. The funding is aimed at boosting semiconductor production and supporting economic growth. The country’s growing focus on electric vehicles and renewable energy systems is further fueling the consumption of semiconductor gases.
Europe Market Insights
Europe is likely to account for 10.4% of the global market share through 2036. The region's strategic efforts to strengthen semiconductor manufacturing capabilities and enhance supply chain resilience are driving the sales of specialty gases. The increasing investments in new fabrication facilities and research centers are propelling the consumption of semiconductor gases.
The UK market is estimated to reach USD 659.77 million by 2036. The growing investments in artificial intelligence and telecommunications are pushing the demand for semiconductor gases. The rise in adoption of electric vehicles and industrial automation is also propelling the consumption of semiconductor gases. Thus, as investments in advanced electronics and semiconductor innovation grow, the sales of specialty gases are set to boom.
Germany’s market for semiconductor gases is anticipated to expand at a CAGR of 6.43% from 2027 to 2036. The country’s strong semiconductor manufacturing base is supporting the trade of specialty gases. The public-private investments aimed at expanding domestic semiconductor production are also contributing to the overall market growth. In June 2026, HUHUTECH International Group announced additional details regarding a major European semiconductor contract.
Its German subsidiary secured seven purchase orders totaling approximately €13.9 million (about US$15 million) from a leading advanced-node wafer fabrication operator. The project supports the global AI and high-performance computing supply chain. The company has already received initial deposits of around USD 743 thousand (€635,000), with revenue recognition expected to begin in fiscal year 2026. This contract strengthens HUHUTECH’s position in the international semiconductor infrastructure market and consequently drives the consumption of specialty gases.
Key Semiconductor Gas Market Players:
- Linde (UK)
- Air Products (U.S.)
- Air Liquide (France)
- Entegris (U.S.)
- Merck KGaA (formerly Versum Materials) (Germany)
- BASF (Germany)
- Solvay (Belgium)
- Taiyo Nippon Sanso (Japan)
- Resonac Corporation (formerly Showa Denko) (Japan)
- Mitsui Chemicals (Japan)
- Air Water Inc. (Japan)
- Chinese Specialty Gas (China)
- Yingde Gases (China)
- SK Materials (South Korea)
- SABIC Industrial Gas Division (Saudi Arabia)
- Company Overview
- Business Strategy
- Key Product Offerings
- Financial Performance
- Key Performance Indicators
- Risk Analysis
- Recent Development
- Regional Presence
- SWOT Analysis
- Linde maintains a strong competitive position in the market through its extensive portfolio of ultra-high-purity bulk and specialty gases, including nitrogen, oxygen, argon, hydrogen, and advanced process gases. The company supports semiconductor manufacturers through integrated gas supply solutions, on-site generation systems, and global distribution networks. Its strong presence near major semiconductor production hubs and continuous investments in purification technologies enable Linde to meet the stringent quality requirements of advanced wafer fabrication processes.
- Air Products is a key competitor in the market, offering high-purity gases and gas management solutions for advanced semiconductor manufacturing. The company supplies critical gases such as nitrogen, hydrogen, helium, and specialty gases used in deposition, etching, and cleaning applications. Its competitive advantage comes from long-term partnerships with leading semiconductor manufacturers, advanced supply infrastructure, and investments in large-scale production facilities to support growing semiconductor fabrication demand worldwide.
- Air Liquide holds a significant position in the semiconductor gas industry through its broad range of electronic gases, advanced gas technologies, and customized supply solutions. The company provides ultra-high-purity gases required for critical semiconductor processes, supported by strong research capabilities and global production facilities. Its focus on innovation, sustainability, and localized supply networks allows Air Liquide to serve major semiconductor manufacturers while addressing increasing demand for advanced chips and next-generation fabrication technologies.
- Entegris competes in the market through its specialized expertise in materials management, gas purification, and contamination control solutions. The company provides high-purity gas delivery systems, filtration technologies, and specialty materials that support advanced semiconductor manufacturing. Its strong focus on improving process reliability and wafer yield gives it a competitive advantage, particularly in leading-edge semiconductor applications where strict purity standards and precise material handling are essential.
- BASF participates in the market through its advanced materials and specialty chemical solutions used in semiconductor manufacturing processes. The company supplies high-purity chemicals and process materials that support deposition, cleaning, and other critical fabrication steps. BASF’s competitive strength lies in its strong chemical expertise, global manufacturing capabilities, and focus on developing innovative materials solutions that meet the evolving requirements of advanced semiconductor production.
Below is the list of the key players, among several others, operating in the global market:
The strong presence of regional and international companies characterizes the market. Leading companies are focused on technological innovations to introduce next-gen solutions. They are also engaging in strategic collaborations with others to enhance their product offerings. Some gigantic companies are exploring opportunities across high-potential economies to earn lucrative returns. Both organic and inorganic marketing strategies are projected to double the revenues of key players during the forecast period.
Corporate Landscape of the Global Market:
Recent Developments
- In April 2026, Air Products announced that Samsung had chosen it to provide industrial gases for a new semiconductor plant in Pyeongtaek, South Korea. As part of the agreement, Air Products is anticipated to set up, own, and run several production units and a bulk gas supply system to provide nitrogen, oxygen, argon, and hydrogen. These facilities are expected to begin operating in stages from 2028 to 2030.
- In March 2026, Air Liquide announced the completion of its new advanced materials plant in Taichung City, Taiwan. The company already operates 54 facilities in Taiwan for the semiconductor industry, and this is its first large-scale site there for advanced deposition and etching materials. These materials are important for next-generation chips used in artificial intelligence and high-performance computing.
- Report ID: 8670
- Published Date: Jul 13, 2026
- Report Format: PDF, PPT
- Explore a preview of key market trends and insights
- Review sample data tables and segment breakdowns
- Experience the quality of our visual data representations
- Evaluate our report structure and research methodology
- Get a glimpse of competitive landscape analysis
- Understand how regional forecasts are presented
- Assess the depth of company profiling and benchmarking
- Preview how actionable insights can support your strategy
Explore real data and analysis
Frequently Asked Questions (FAQ)
About this Report
Connect with our Expert


Report, 2027-2036


Copyright @ 2026 Research Nester. All Rights Reserved.
