Global Syngas Market
- An Outline of the Global Syngas Market
1.1. Market Definition and Segmentation
1.2. Study Assumptions and Abbreviations
- Research Methodology & Approach
2.1. Primary Research
2.2. Secondary Research
2.3. Data Triangulation
2.4. SPSS Methodology
- Executive Summary
- Growth Drivers
- Major Roadblocks
- Opportunities
- Prevalent Trends
- Government Regulation
- Growth Outlook
- Competitive White Space Analysis – Identifying Untapped Market Gaps
- Risk Overview
- SWOT
- Technological Advancement
- Technology Maturity Matrix for the Syngas Market: Recent News
- Regional Demand
- Global Syngas by Geography – Strategic Comparative Analysis
- Strategic Segment Analysis: Syngas Demand Landscape
- Syngas Demand Trends Driven by growing demand for methanol and ammonia production, supportive government policies for low-carbon energy, and expansion of waste-to-energy and biomass gasification projects. (2027-2037)
- Root Cause Analysis (RCA) for discovering problems of the Syngas Market
- Porter Five Forces
- PESTLE
- Comparative Positioning
- Global Syngas – Key Player Analysis (2037)
- Competitive Landscape: Key Suppliers/Players
- Competitive Model: A Detailed Inside View for Investors
- Company Market Share, 2037 (%)
26.1. Air Liquide
26.2. Air Products and Chemicals, Inc.
26.3. BASF
26.4. Chiyoda Corporation
26.5. Haldor Topsøe
26.6. Johnson Matthey
26.7. Kawasaki Heavy Industries, Ltd.
26.8. KBR Inc.
26.9. Linde PLC
26.10. Sumitomo Heavy Industries Ltd
- Global Syngas Market Outlook
27.1. Market Overview
27.1.1. Market Revenue by Value (USD Million), by Volume (Million Tons), and Compound Annual Growth Rate (CAGR)
27.2. Syngas Market Segmentation Analysis (2027-2037)
27.2.1. By Production Technology
27.2.1.1. Steam Reforming, Market Value (USD Million), and CAGR, 2027-2037F
27.2.1.2. Partial Oxidation, Market Value (USD Million), and CAGR, 2027-2037F
27.2.1.3. Autothermal Reforming, Market Value (USD Million), and CAGR, 2027-2037F
27.2.1.4. Biomass Gasification, Market Value (USD Million), and CAGR, 2027-2037F
27.2.1.5. Others, Market Value (USD Million), and CAGR, 2027-2037F
27.2.2. By Feedstock
27.2.2.1. Petroleum By-products, Market Value (USD Million), and CAGR, 2027-2037F
27.2.2.2. Coal, Market Value (USD Million), and CAGR, 2027-2037F
27.2.2.3. Natural Gas, Market Value (USD Million), and CAGR, 2027-2037F
27.2.2.4. Biomass/Waste, Market Value (USD Million), and CAGR, 2027-2037F
27.2.2.5. Others, Market Value (USD Million), and CAGR, 2027-2037F
27.2.3. By Gasification Furnace Type
27.2.3.1. Fixed Bed, Market Value (USD Million), and CAGR, 2027-2037F
27.2.3.2. Entrained Flow, Market Value (USD Million), and CAGR, 2027-2037F
27.2.3.3. Fluidized Bed, Market Value (USD Million), and CAGR, 2027-2037F
27.2.3.4. Others, Market Value (USD Million), and CAGR, 2027-2037F
27.2.4. By Application
27.2.4.1. Chemical, Market Value (USD Million), and CAGR, 2027-2037F
27.2.4.2. Fuel, Market Value (USD Million), and CAGR, 2027-2037F
27.2.4.3. Power Generation, Market Value (USD Million), and CAGR, 2027-2037F
27.2.4.4. Others, Market Value (USD Million), and CAGR, 2027-2037F
27.2.5. Regional Synopsis, Value (USD Million), 2027-2037
27.2.5.1. North America Market Value (USD Million) and CAGR & Y-o-Y Growth Trend, 2027-2037F
27.2.5.2. Europe Market Value (USD Million) and CAGR & Y-o-Y Growth Trend, 2027-2037F
27.2.5.3. Asia Pacific, excluding Japan Market Value (USD Million) and CAGR & Y-o-Y Growth Trend, 2027-2037F
27.2.5.4. Latin America Market Value (USD Million) and CAGR & Y-o-Y Growth Trend, 2027-2037F
27.2.5.5. Middle East and Africa Market Value (USD Million) and CAGR & Y-o-Y Growth Trend, 2027-2037F
- North America Market
28.1. Overview
28.1.1. Market Value (USD Million), Current and Future Projections, 2027-2037
28.1.2. Increment $ Opportunity Assessment, 2027-2037
28.2. Segmentation (USD Million), 2027-2037, By
28.2.1. By Production Technology
28.2.1.1. Steam Reforming, Market Value (USD Million), and CAGR, 2027-2037F
28.2.1.2. Partial Oxidation, Market Value (USD Million), and CAGR, 2027-2037F
28.2.1.3. Autothermal Reforming, Market Value (USD Million), and CAGR, 2027-2037F
28.2.1.4. Biomass Gasification, Market Value (USD Million), and CAGR, 2027-2037F
28.2.1.5. Others, Market Value (USD Million), and CAGR, 2027-2037F
28.2.2. By Feedstock
28.2.2.1. Petroleum By-products, Market Value (USD Million), and CAGR, 2027-2037F
28.2.2.2. Coal, Market Value (USD Million), and CAGR, 2027-2037F
28.2.2.3. Natural Gas, Market Value (USD Million), and CAGR, 2027-2037F
28.2.2.4. Biomass/Waste, Market Value (USD Million), and CAGR, 2027-2037F
28.2.2.5. Others, Market Value (USD Million), and CAGR, 2027-2037F
28.2.3. By Gasification Furnace Type
28.2.3.1. Fixed Bed, Market Value (USD Million), and CAGR, 2027-2037F
28.2.3.2. Entrained Flow, Market Value (USD Million), and CAGR, 2027-2037F
28.2.3.3. Fluidized Bed, Market Value (USD Million), and CAGR, 2027-2037F
28.2.3.4. Others, Market Value (USD Million), and CAGR, 2027-2037F
28.2.4. By Application
28.2.4.1. Chemical, Market Value (USD Million), and CAGR, 2027-2037F
28.2.4.2. Fuel, Market Value (USD Million), and CAGR, 2027-2037F
28.2.4.3. Power Generation, Market Value (USD Million), and CAGR, 2027-2037F
28.2.4.4. Others, Market Value (USD Million), and CAGR, 2027-2037F
28.2.5. Country Level Analysis, Value (USD Million)
28.2.5.1. U.S. Market Value (USD Million) and CAGR & Y-o-Y Growth Trend, 2027-2037F
28.2.5.2. Canada Market Value (USD Million) and CAGR & Y-o-Y Growth Trend, 2027-2037F
- Europe Market
29.1. Overview
29.1.1. Market Value (USD Million), Current and Future Projections, 2027-2037
29.1.2. Increment $ Opportunity Assessment, 2027-2037
29.2. Segmentation (USD Million), 2027-2037, By
29.2.1. By Production Technology
29.2.1.1. Steam Reforming, Market Value (USD Million), and CAGR, 2027-2037F
29.2.1.2. Partial Oxidation, Market Value (USD Million), and CAGR, 2027-2037F
29.2.1.3. Autothermal Reforming, Market Value (USD Million), and CAGR, 2027-2037F
29.2.1.4. Biomass Gasification, Market Value (USD Million), and CAGR, 2027-2037F
29.2.1.5. Others, Market Value (USD Million), and CAGR, 2027-2037F
29.2.2. By Feedstock
29.2.2.1. Petroleum By-products, Market Value (USD Million), and CAGR, 2027-2037F
29.2.2.2. Coal, Market Value (USD Million), and CAGR, 2027-2037F
29.2.2.3. Natural Gas, Market Value (USD Million), and CAGR, 2027-2037F
29.2.2.4. Biomass/Waste, Market Value (USD Million), and CAGR, 2027-2037F
29.2.2.5. Others, Market Value (USD Million), and CAGR, 2027-2037F
29.2.3. By Gasification Furnace Type
29.2.3.1. Fixed Bed, Market Value (USD Million), and CAGR, 2027-2037F
29.2.3.2. Entrained Flow, Market Value (USD Million), and CAGR, 2027-2037F
29.2.3.3. Fluidized Bed, Market Value (USD Million), and CAGR, 2027-2037F
29.2.3.4. Others, Market Value (USD Million), and CAGR, 2027-2037F
29.2.4. By Application
29.2.4.1. Chemical, Market Value (USD Million), and CAGR, 2027-2037F
29.2.4.2. Fuel, Market Value (USD Million), and CAGR, 2027-2037F
29.2.4.3. Power Generation, Market Value (USD Million), and CAGR, 2027-2037F
29.2.4.4. Others, Market Value (USD Million), and CAGR, 2027-2037F
29.2.5. Country Level Analysis, Value (USD Million)
29.2.5.1. UK Market Value (USD Million) and CAGR & Y-o-Y Growth Trend, 2027-2037F
29.2.5.2. Germany Market Value (USD Million) and CAGR & Y-o-Y Growth Trend, 2027-2037F
29.2.5.3. France Market Value (USD Million) and CAGR & Y-o-Y Growth Trend, 2027-2037F
29.2.5.4. Italy Market Value (USD Million) and CAGR & Y-o-Y Growth Trend, 2027-2037F
29.2.5.5. Spain Market Value (USD Million) and CAGR & Y-o-Y Growth Trend, 2027-2037F
29.2.5.6. Netherlands Market Value (USD Million) and CAGR & Y-o-Y Growth Trend, 2027-2037F
29.2.5.7. Russia Market Value (USD Million) and CAGR & Y-o-Y Growth Trend, 2027-2037F
29.2.5.8. Switzerland Market Value (USD Million) and CAGR & Y-o-Y Growth Trend, 2027-2037F
29.2.5.9. Poland Market Value (USD Million) and CAGR & Y-o-Y Growth Trend, 2027-2037F
29.2.5.10. Belgium Market Value (USD Million) and CAGR & Y-o-Y Growth Trend, 2027-2037F
29.2.5.11. Rest of Europe Market Value (USD Million) and CAGR & Y-o-Y Growth Trend, 2027-2037F
- Asia Pacific, excluding Japan Market
30.1. Overview
30.1.1. Market Value (USD Million), Current and Future Projections, 2027-2037
30.1.2. Increment $ Opportunity Assessment, 2027-2037
30.2. Segmentation (USD Million), 2027-2037, By
30.2.1. By Production Technology
30.2.1.1. Steam Reforming, Market Value (USD Million), and CAGR, 2027-2037F
30.2.1.2. Partial Oxidation, Market Value (USD Million), and CAGR, 2027-2037F
30.2.1.3. Autothermal Reforming, Market Value (USD Million), and CAGR, 2027-2037F
30.2.1.4. Biomass Gasification, Market Value (USD Million), and CAGR, 2027-2037F
30.2.1.5. Others, Market Value (USD Million), and CAGR, 2027-2037F
30.2.2. By Feedstock
30.2.2.1. Petroleum By-products, Market Value (USD Million), and CAGR, 2027-2037F
30.2.2.2. Coal, Market Value (USD Million), and CAGR, 2027-2037F
30.2.2.3. Natural Gas, Market Value (USD Million), and CAGR, 2027-2037F
30.2.2.4. Biomass/Waste, Market Value (USD Million), and CAGR, 2027-2037F
30.2.2.5. Others, Market Value (USD Million), and CAGR, 2027-2037F
30.2.3. By Gasification Furnace Type
30.2.3.1. Fixed Bed, Market Value (USD Million), and CAGR, 2027-2037F
30.2.3.2. Entrained Flow, Market Value (USD Million), and CAGR, 2027-2037F
30.2.3.3. Fluidized Bed, Market Value (USD Million), and CAGR, 2027-2037F
30.2.3.4. Others, Market Value (USD Million), and CAGR, 2027-2037F
30.2.4. By Application
30.2.4.1. Chemical, Market Value (USD Million), and CAGR, 2027-2037F
30.2.4.2. Fuel, Market Value (USD Million), and CAGR, 2027-2037F
30.2.4.3. Power Generation, Market Value (USD Million), and CAGR, 2027-2037F
30.2.4.4. Others, Market Value (USD Million), and CAGR, 2027-2037F
30.2.5. Country Level Analysis, Value (USD Million)
30.2.5.1. China Market Value (USD Million) and CAGR & Y-o-Y Growth Trend, 2027-2037F
30.2.5.2. India Market Value (USD Million) and CAGR & Y-o-Y Growth Trend, 2027-2037F
30.2.5.3. South Korea Market Value (USD Million) and CAGR & Y-o-Y Growth Trend, 2027-2037F
30.2.5.4. Australia Market Value (USD Million) and CAGR & Y-o-Y Growth Trend, 2027-2037F
30.2.5.5. Indonesia Market Value (USD Million) and CAGR & Y-o-Y Growth Trend, 2027-2037F
30.2.5.6. Malaysia Market Value (USD Million) and CAGR & Y-o-Y Growth Trend, 2027-2037F
30.2.5.7. Vietnam Market Value (USD Million) and CAGR & Y-o-Y Growth Trend, 2027-2037F
30.2.5.8. Thailand Market Value (USD Million) and CAGR & Y-o-Y Growth Trend, 2027-2037F
30.2.5.9. Singapore Market Value (USD Million) and CAGR & Y-o-Y Growth Trend, 2027-2037F
30.2.5.10. New Zealand Market Value (USD Million) and CAGR & Y-o-Y Growth Trend, 2027-2037F
30.2.5.11. Rest of Asia Pacific Excluding Japan Market Value (USD Million) and CAGR & Y-o-Y Growth Trend, 2027-2037F
- Latin America Market
31.1. Overview
31.1.1. Market Value (USD Million), Current and Future Projections, 2027-2037
31.1.2. Increment $ Opportunity Assessment, 2027-2037
31.1.3. Year-on-Year Growth Forecast (%)
31.2. Segmentation (USD Million), 2027-2037, By
31.2.1. By Production Technology
31.2.1.1. Steam Reforming, Market Value (USD Million), and CAGR, 2027-2037F
31.2.1.2. Partial Oxidation, Market Value (USD Million), and CAGR, 2027-2037F
31.2.1.3. Autothermal Reforming, Market Value (USD Million), and CAGR, 2027-2037F
31.2.1.4. Biomass Gasification, Market Value (USD Million), and CAGR, 2027-2037F
31.2.1.5. Others, Market Value (USD Million), and CAGR, 2027-2037F
31.2.2. By Feedstock
31.2.2.1. Petroleum By-products, Market Value (USD Million), and CAGR, 2027-2037F
31.2.2.2. Coal, Market Value (USD Million), and CAGR, 2027-2037F
31.2.2.3. Natural Gas, Market Value (USD Million), and CAGR, 2027-2037F
31.2.2.4. Biomass/Waste, Market Value (USD Million), and CAGR, 2027-2037F
31.2.2.5. Others, Market Value (USD Million), and CAGR, 2027-2037F
31.2.3. By Gasification Furnace Type
31.2.3.1. Fixed Bed, Market Value (USD Million), and CAGR, 2027-2037F
31.2.3.2. Entrained Flow, Market Value (USD Million), and CAGR, 2027-2037F
31.2.3.3. Fluidized Bed, Market Value (USD Million), and CAGR, 2027-2037F
31.2.3.4. Others, Market Value (USD Million), and CAGR, 2027-2037F
31.2.4. By Application
31.2.4.1. Chemical, Market Value (USD Million), and CAGR, 2027-2037F
31.2.4.2. Fuel, Market Value (USD Million), and CAGR, 2027-2037F
31.2.4.3. Power Generation, Market Value (USD Million), and CAGR, 2027-2037F
31.2.4.4. Others, Market Value (USD Million), and CAGR, 2027-2037F
31.2.5. Country Level Analysis, Value (USD Million)
31.2.5.1. Brazil Market Value (USD Million) and CAGR & Y-o-Y Growth Trend, 2027-2037F
31.2.5.2. Argentina Market Value (USD Million) and CAGR & Y-o-Y Growth Trend, 2027-2037F
31.2.5.3. Mexico Market Value (USD Million) and CAGR & Y-o-Y Growth Trend, 2027-2037F
31.2.5.4. Rest of Latin America Market Value (USD Million) and CAGR & Y-o-Y Growth Trend, 2027-2037F
- Middle East & Africa Market
32.1. Overview
32.1.1. Market Value (USD Million), Current and Future Projections, 2027-2037
32.1.2. Increment $ Opportunity Assessment, 2027-2037
32.1.3. Year-on-Year Growth Forecast (%)
32.2. Segmentation (USD Million), 2027-2037, By
32.2.1. By Production Technology
32.2.1.1. Steam Reforming, Market Value (USD Million), and CAGR, 2027-2037F
32.2.1.2. Partial Oxidation, Market Value (USD Million), and CAGR, 2027-2037F
32.2.1.3. Autothermal Reforming, Market Value (USD Million), and CAGR, 2027-2037F
32.2.1.4. Biomass Gasification, Market Value (USD Million), and CAGR, 2027-2037F
32.2.1.5. Others, Market Value (USD Million), and CAGR, 2027-2037F
32.2.2. By Feedstock
32.2.2.1. Petroleum By-products, Market Value (USD Million), and CAGR, 2027-2037F
32.2.2.2. Coal, Market Value (USD Million), and CAGR, 2027-2037F
32.2.2.3. Natural Gas, Market Value (USD Million), and CAGR, 2027-2037F
32.2.2.4. Biomass/Waste, Market Value (USD Million), and CAGR, 2027-2037F
32.2.2.5. Others, Market Value (USD Million), and CAGR, 2027-2037F
32.2.3. By Gasification Furnace Type
32.2.3.1. Fixed Bed, Market Value (USD Million), and CAGR, 2027-2037F
32.2.3.2. Entrained Flow, Market Value (USD Million), and CAGR, 2027-2037F
32.2.3.3. Fluidized Bed, Market Value (USD Million), and CAGR, 2027-2037F
32.2.3.4. Others, Market Value (USD Million), and CAGR, 2027-2037F
32.2.4. By Application
32.2.4.1. Chemical, Market Value (USD Million), and CAGR, 2027-2037F
32.2.4.2. Fuel, Market Value (USD Million), and CAGR, 2027-2037F
32.2.4.3. Power Generation, Market Value (USD Million), and CAGR, 2027-2037F
32.2.4.4. Others, Market Value (USD Million), and CAGR, 2027-2037F
32.2.5. Country Level Analysis, Value (USD Million)
32.2.5.1. Saudi Arabia Market Value (USD Million) and CAGR & Y-o-Y Growth Trend, 2027-2037F
32.2.5.2. UAE Market Value (USD Million) and CAGR & Y-o-Y Growth Trend, 2027-2037F
32.2.5.3. Israel Market Value (USD Million) and CAGR & Y-o-Y Growth Trend, 2027-2037F
32.2.5.4. Qatar Market Value (USD Million) and CAGR & Y-o-Y Growth Trend, 2027-2037F
32.2.5.5. Kuwait Market Value (USD Million) and CAGR & Y-o-Y Growth Trend, 2027-2037F
32.2.5.6. Oman Market Value (USD Million) and CAGR & Y-o-Y Growth Trend, 2027-2037F
32.2.5.7. South Africa Market Value (USD Million) and CAGR & Y-o-Y Growth Trend, 2027-2037F
32.2.5.8. Rest of Middle East & Africa Market Value (USD Million) and CAGR & Y-o-Y Growth Trend, 2027-2037F
33. Japan Market
33.1. Overview
33.1.1. Market Value (USD Million), Current and Future Projections, 2027-2037
33.1.2. Increment $ Opportunity Assessment, 2027-2037
33.1.3. Year-on-Year Growth Forecast (%)
33.2. Segmentation (USD Million), 2027-2037, By
33.2.1. By Production Technology
33.2.1.1. Steam Reforming, Market Value (USD Million), and CAGR, 2027-2037F
33.2.1.2. Partial Oxidation, Market Value (USD Million), and CAGR, 2027-2037F
33.2.1.3. Autothermal Reforming, Market Value (USD Million), and CAGR, 2027-2037F
33.2.1.4. Biomass Gasification, Market Value (USD Million), and CAGR, 2027-2037F
33.2.1.5. Others, Market Value (USD Million), and CAGR, 2027-2037F
33.2.2. By Feedstock
33.2.2.1. Petroleum By-products, Market Value (USD Million), and CAGR, 2027-2037F
33.2.2.2. Coal, Market Value (USD Million), and CAGR, 2027-2037F
33.2.2.3. Natural Gas, Market Value (USD Million), and CAGR, 2027-2037F
33.2.2.4. Biomass/Waste, Market Value (USD Million), and CAGR, 2027-2037F
33.2.2.5. Others, Market Value (USD Million), and CAGR, 2027-2037F
33.2.3. By Gasification Furnace Type
33.2.3.1. Fixed Bed, Market Value (USD Million), and CAGR, 2027-2037F
33.2.3.2. Entrained Flow, Market Value (USD Million), and CAGR, 2027-2037F
33.2.3.3. Fluidized Bed, Market Value (USD Million), and CAGR, 2027-2037F
33.2.3.4. Others, Market Value (USD Million), and CAGR, 2027-2037F
33.2.4. By Application
33.2.4.1. Chemical, Market Value (USD Million), and CAGR, 2027-2037F
33.2.4.2. Fuel, Market Value (USD Million), and CAGR, 2027-2037F
33.2.4.3. Power Generation, Market Value (USD Million), and CAGR, 2027-2037F
33.2.4.4. Others, Market Value (USD Million), and CAGR, 2027-2037F
- Global Economic Scenario
34.1. World Economic Outlook
- About Research Nester
35.1. Our Global Clientele
35.2. We Serve Clients Across World
Syngas Market Outlook:
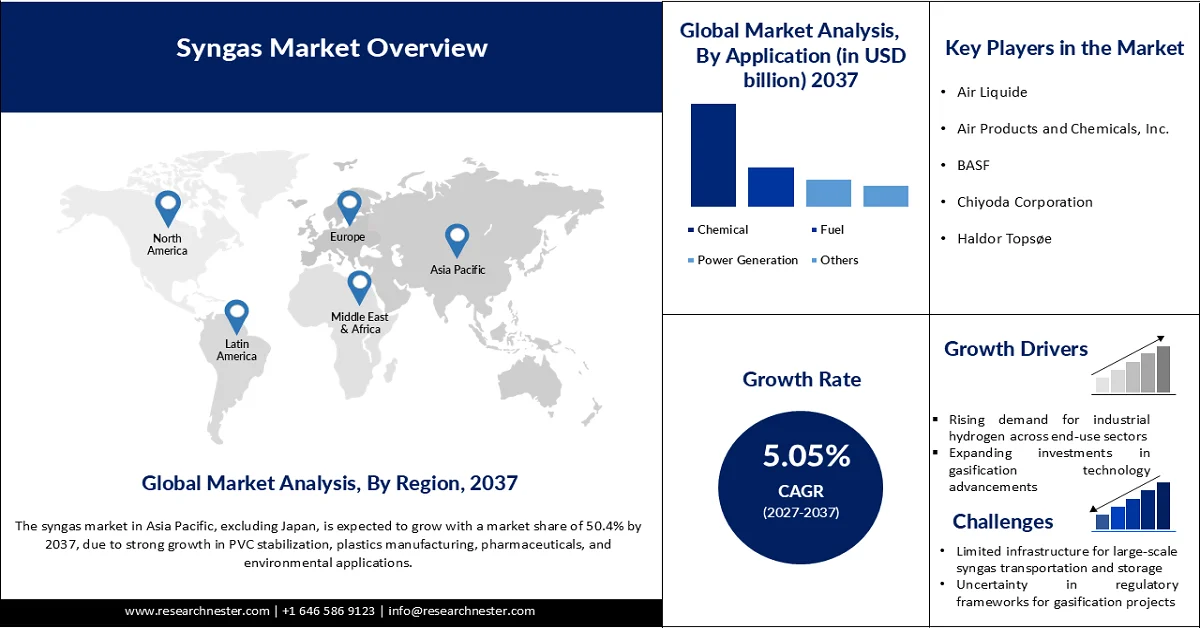
Syngas Market size is valued at USD 64.59 billion in 2026 and is projected to reach USD 112.64 billion by 2037, growing at a CAGR of 5.05% during the forecast period, i.e., 2027-2037. In 2027, the industry size of syngas is estimated at USD 68.82 billion.
The rapid expansion of sustainable aviation fuel (SAF) production is opening lucrative earning opportunities for syngas companies. The increasing pressure to reduce greenhouse gas emissions and achieve net-zero carbon targets is pushing airline companies and governments to focus on SAF consumption. The International Air Transport Association (IATA) estimates that by 2050, the aviation sector is expected to need about 500 million tonnes of sustainable aviation fuel to reach net-zero carbon emissions.
In 2025, global output was only around 2 million tonnes, while the study projects that production is likely to rise to 400 million tonnes by 2050. Regulatory initiatives and supportive government policies are further expected to propel the commercialization of SAF facilities. The continuous advancements in gasification efficiency and feedstock flexibility are projected to make syngas-based SAF production more economically attractive.
Key Syngas Market Insights Summary:
Regional Highlights:
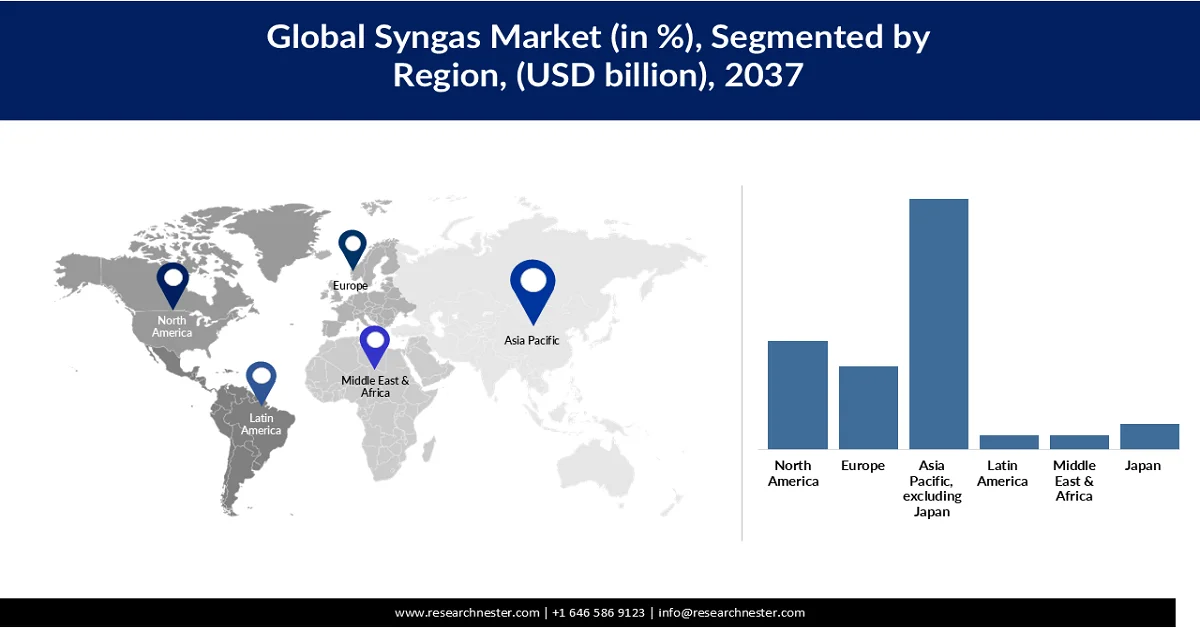
- The syngas market in Asia Pacific excluding Japan (APEJ) is expected to command 50.4% of global revenue share by 2037, reinforced by strong industrial development and rising energy demand
- Japan’s market is poised for notable expansion during 2027-2037, bolstered by energy security initiatives and accelerating hydrogen development
- The U.S.market is expected to reach USD 13,832.80 million in 2027, mainly owing to the robust investments in hydrogen technologies
- Japan is projected to capture nearly 2.8% of the global market share by 2037, supported by continuous technological advancements and strong zero-emission goals
Segment Insights:
- The steam reforming segment is projected to hold 50.2% of the global syngas market share throughout the forecast period, underpinned by high conversion efficiency, cost-effectiveness, and scalability with proven commercial performance
- The natural gas segment is anticipated to account for 48.6% of the global market by 2037, stimulated by its high hydrogen content and widespread availability
Key Growth Trends:
- Increasing hydrogen economy investments
- Supportive government policies for low-carbon energy
Major Challenges:
- High capital investment requirements
- Volatility in feedstock prices and availability
Key Players: Air Liquide (France), Air Products and Chemicals, Inc. (U.S.), BASF (Germany), Chiyoda Corporation (Japan), Haldor Topsøe (Denmark), Johnson Matthey (England), Kawasaki Heavy Industries, Ltd. (Japan), KBR Inc. (U.S.), Linde PLC (England), Sumitomo Heavy Industries Ltd (Japan).
Global Syngas Market Forecast and Regional Outlook:
Market Size & Growth Projections:
- 2026 Market Size: USD 64.59 billion
- 2027 Market Size: USD 68.82 billion
- Projected Market Size: USD 112.64 billion by 2037
- Growth Forecasts: 5.05% CAGR (2027-2037)
Key Regional Dynamics:
- Largest Region: Asia Pacific excluding Japan (50.4% Share by 2037)
- Fastest Growing Region: Japan
- Dominating Countries: China, United States, India, Japan, South Korea
- Emerging Countries: Singapore, Saudi Arabia, United Arab Emirates, Indonesia, Vietnam
Last updated on : 24 July, 2026
Syngas Market - Growth Drivers and Challenges
Growth Drivers
- Increasing hydrogen economy investments: The growing investments in the global hydrogen economy are anticipated to propel the overall market growth in the years ahead. Many countries have introduced national hydrogen strategies aimed at decarbonizing transportation, power generation, and more. The Fuel Cell & Hydrogen Energy Association estimates that the direct investment announced for hydrogen projects is likely to reach USD 570 billion by 2030.
The International Energy Agency (IEA) also reveals that global hydrogen use crossed 100 million tonnes in 2025, mainly owing to higher demand in established industries. Most of this was used in refining and industrial work. Low-emissions hydrogen output also rose by 20% to nearly 1 million tonnes, though most of it still came from a small number of projects. In 2026, production is expected to hit another record and pass 1% of total global output for the first time. These long-term growth prospects for hydrogen production are poised to drive the overall market growth in the years ahead. - Supportive government policies for low-carbon energy: The supportive government policies promoting low-carbon energy development are expected to boost the growth of the global market in the coming years. Countries worldwide are implementing net-zero commitments and industrial decarbonization policies, which are encouraging investments in cleaner fuel production technologies.
The Environmental and Energy Study Institute (EESI) states that a feed-in tariff is a policy that supports renewable energy by giving producers a stable, long-term income. It ensures access to the power grid and offers a fixed payment rate, usually higher than the market price, for 15 to 20 years. The cost is generally spread across all electricity users of the utility. Thus, as governments continue strengthening policies aimed at achieving long-term climate and energy security objectives, the demand for syngas is set to boom. - Industrial decarbonization in heavy manufacturing: Industrial decarbonization initiatives across heavy manufacturing industries such as refining, cement, and others are anticipated to propel the consumption of syngas. Enabling cleaner industrial heating and reducing agent applications, syngas serves as both a fuel and a chemical feedstock. Thus, as industries continue modernizing production facilities, the demand for advanced syngas production technologies is expected to grow steadily.
Challenges
- High capital investment requirements: The high capital intensity is expected to limit the market growth to some extent. Companies have to invest substantially in advanced technologies and modern infrastructure. The long construction timelines and significant upfront expense are hindering SMEs from expanding their operations in this field. However, tax incentives and clean energy subsidies are expected to aid key players in overcoming this issue.
- Volatility in feedstock prices and availability: Volatility in feedstock prices and availability hampers the production of syngas solutions. Natural gas, coal, petroleum coke, biomass, municipal solid waste, and agricultural residues are some of the key raw materials from which syngas is produced. Supply chain disruptions and trade restrictions directly influence syngas production costs. Strategic long-term supply contracts and collaborations with raw material suppliers are expected to aid in overcoming this challenge.
Syngas Market Size and Forecast:
| Report Attribute | Details |
|---|---|
|
Base Year |
2026 |
|
Forecast Period |
2027-2037 |
|
CAGR |
5.05% |
|
Base Year Market Size (2026) |
USD 64.59 billion |
|
Forecast Year Market Size (2037) |
USD 112.64 billion |
|
Regional Scope |
|
Syngas Market Segmentation:
Production Technology Segment Analysis
The steam reforming segment is projected to capture 50.2% of the global syngas market share throughout the forecast period. The high conversion efficiency and cost-effectiveness are driving the sales of steam reforming technologies. In January 2026, HYCO1 revealed that the U.S. Patent and Trademark Office granted it three new patents, strengthening its position in syngas and carbon-use technology. These patents give broad protection for its CUBE™ system, which offers a more efficient and cost-effective way to produce syngas through methods ranging from pure dry reforming of methane with CO2 to bi-reforming and traditional steam methane reforming. Thus, scalability and proven commercial performance are driving the adoption of steam reforming technologies.
Feedstock Segment Analysis
The natural gas segment is anticipated to account for 48.6% of the global syngas market through 2037. High hydrogen content and widespread availability are fueling the application of natural gas in syngas production. The IEA disclosed that global gas use hit a record high in 2024, with more than three-quarters of the increase coming from emerging and developing economies. Demand rose by 2.7%, or 115 billion cubic metres, surpassing the average growth of about 2% seen from 2010 to 2019 and the slower 1% pace between 2019 and 2023. Regions with abundant natural gas reserves and high consumption are driving syngas production.
Application Segment Analysis
Chemical is estimated to be the leading end-user segment in the global syngas market and holds a 53.2% share by the end of the forecast period. Extensive reliance on syngas as a primary feedstock drives its application in the chemical sector. The Observatory of Economic Complexity (OEC) reveals that in 2024, worldwide trade in chemical products totaled USD 2.31 trillion. The top exporting countries were the U.S. (USD 247 billion), Germany (USD 234 billion), and China (USD 221 billion). The largest importers were the U.S. (USD 333 billion), Germany (USD 163 billion), and China (USD 156 billion). Thus, the rapid industrialization and urbanization are set to fuel the application of syngas production.
Our in-depth analysis of the syngas market includes the following segments:
|
Segments |
Subsegments |
|
Production Technology |
|
|
Feedstock
|
|
|
Gasification Furnace Type
|
|
|
Application |
|

Vishnu Nair
Head - Global Business DevelopmentCustomize this report to your requirements — connect with our consultant for personalized insights and options.
Syngas Market - Regional Analysis
Asia Pacific excluding Japan Market Insights
Asia Pacific excluding Japan (APEJ) is projected to capture 50.4% of the global syngas market share through 2037. The region’s market growth is driven by its strong industrial development and rising energy demand. The expanding chemical manufacturing sector and increasing investments in cleaner fuel technologies are further accelerating the application of syngas. China, India, South Korea, and Singapore are some of the key marketplaces opening high-earning opportunities for syngas producers.
China’s market for syngas is estimated to be valued at USD 32,373.49 million by the end of the forecast period. The country’s extensive coal reserves and large chemical manufacturing base are propelling the trade of syngas. The significant investments in coal-to-chemicals and coal-to-gas technologies by both public-private entities are set to drive the overall market growth in the years ahead. As per the OEC analysis, China imported and exported nearly USD 156 billion and USD 221 billion worth of syngas in 2024. Thus, high chemical trade is significantly pushing the consumption of syngas.
The India market is expected to be valued at USD 4,749.05 million in 2027, driven by rising industrialization and high energy demand. The expanding chemical manufacturing and government initiatives focused on energy security are promoting the trade of syngas. India’s growing fertilizer industry is also emerging as a key consumer of syngas-based hydrogen. This is essential for ammonia production used in agricultural applications. In March 2026, the Ministry of Chemicals and Fertilizers disclosed that India has secured 86 lakh tonnes of fertilizers through international agreements, while domestic production of P&K fertilizers has risen to 211 lakh tonnes.
All INDIA Fertilizer Position For Rabi 2025-26 (TILL 05/03/26)
|
Product |
Requirement for RABI 2025-26 |
Pro rata Requirement 01/10/25 to 05/03/26 |
Availability From 01/10/25 to 05/03/26 |
Sales From 01/10/25 to 05/03/26 |
Stock as on 05/03/26 |
|
UREA |
196.06 |
183.51 |
235.33 |
186.33 |
49.01 |
|
DAP |
53.43 |
51.38 |
71.89 |
50.28 |
21.61 |
|
MOP |
15.69 |
14.18 |
18.18 |
10.18 |
8.00 |
|
NPKS |
82.38 |
76.48 |
108.41 |
62.90 |
45.51 |
Source: Ministry of Chemicals and Fertilizers
Japan Market Insights
The Japan syngas market is anticipated to increase from USD 2,250.51 million in 2027 to USD 3,232.97 million by 2037. The country’s focus on energy security and hydrogen development is boosting syngas sales. The industrial decarbonization initiatives and shift toward low-carbon fuels are propelling the trade of syngas. The government’s Green Growth Strategy and hydrogen-focused initiatives are encouraging investments in hydrogen production infrastructure. To ensure a steady, affordable supply of hydrogen over the long term, Japan aims to deliver up to 3 million tonnes per year by 2030 and around 20 million tonnes annually by 2050. Further, waste-to-syngas technologies are gaining attention due to Japan’s advanced waste management infrastructure and limited land availability for landfill disposal.
Japan is reshaping its energy system by making hydrogen a central part of its plan to reach net-zero emissions by 2050. To meet this goal, the government is working closely with private companies through public–private partnerships. One key example is Chiyoda Corporation’s collaboration with the New Energy and Industrial Technology Development Organization (NEDO) to build an early hydrogen supply chain using methylcyclohexane (MCH) as a carrier. In 2020, more than 100 tonnes of hydrogen were shipped from Brunei to Japan, proving that large-scale transport is possible.
Japan Syngas Market Size and Forecast
|
Report Attribute |
Details |
|
Base Year Market Size and Volume (2026) |
USD 2,137.99 million; 5.29 million tons |
|
Forecast Year Market Size and Volume (2037) |
USD 3,232.97 million; 6.51 million tons |
|
CAGR (2026-2037) |
3.69% |
North America Market Insights
North America is anticipated to hold 21.8% of the global syngas market share through 2037. The increasing demand for hydrogen and clean manufacturing strategies is fueling the sales of syngas solutions. The region also benefits from a well-established energy infrastructure and abundant natural gas availability. The growing investments in clean energy transition initiatives and advanced gasification technologies are expected to push the consumption of syngas.
The U.S. syngas market is expected to reach USD 21,711.12 million by the end of 2037. The market growth is supported by extensive natural gas production and advanced industrial infrastructure. The U.S. Energy Information Administration revealed that the country's natural gas gross withdrawals and production stood at 4,058,773 million cubic feet. Further, the rise in ammonia manufacturing and methanol synthesis is poised to double the revenues of syngas companies in the years ahead.
Canada’s syngas market is projected to expand at a CAGR of 4.96% between 2027 and 2037. The abundant natural resources and growing clean energy initiatives are fueling the sales of syngas. The country’s Hydrogen Strategy sets out a plan to use low-carbon hydrogen to help reach net-zero emissions by 2050, while also supporting job creation, economic growth, higher exports, and environmental protection. Such initiatives are poised to boost the revenues of syngas companies in the years ahead.
Canadian Low-Carbon Hydrogen Industry Developments and Status at-a-Glance 2024
|
Metric |
Value |
Notes |
|
Deployed low-carbon H₂ production capacity |
3,450 tonnes-H₂ per year |
- |
|
Announced or under development low-carbon H₂ production capacity |
5+ Mt H₂ per year |
- |
|
Number of projects |
80 projects |
Announced, under consideration or under development |
|
Total announced project investment |
>$100B |
- |
Source: Natural Resources Canada
Europe Market Insights
Europe is projected to capture 16.7% of the global syngas market throughout the study period. The market growth is expected to be driven by increasing investments in industrial decarbonization and renewable fuels. The rise in hydrogen development and circular economy initiatives is propelling the sales of syngas. The region’s strong focus on achieving climate neutrality by 2050 is also encouraging industries to adopt cleaner syngas production pathways.
The UK syngas market is estimated to be valued at USD 1,425.09 million in 2027. The country’s net-zero emissions target is propelling the trade of syngas. The expanding hydrogen production capacity and rising demand for sustainable fuel alternatives are fueling the consumption of syngas. Waste conversion and biomass-based syngas production are also gaining attention owing to supportive government policies.
The Germany syngas market is expected to increase from USD 2,856.41 million in 2026 to USD 4,286.89 million by 2037. The country’s large industrial base and strong chemical manufacturing sector are accelerating the trade of syngas. Germany’s hydrogen core network is planned to span more than 9,000 km and be completed between 2032 and 2037, with an estimated investment cost of around USD 23.4 billion (EUR 20 billion). Thus, a rise in hydrogen production is poised to open high-earning opportunities for syngas market players.
Key Syngas Market Players:
- Air Liquide (France)
- Air Products and Chemicals, Inc. (U.S.)
- BASF (Germany)
- Chiyoda Corporation (Japan)
- Haldor Topsøe (Denmark)
- Johnson Matthey (England)
- Kawasaki Heavy Industries, Ltd. (Japan)
- KBR Inc. (U.S.)
- Linde PLC (England)
- Sumitomo Heavy Industries Ltd (Japan)
- Company Overview
- Business Strategy
- Key Product Offerings
- Financial Performance
- Key Performance Indicators
- Risk Analysis
- Recent Development
- Regional Presence
- SWOT Analysis
- Air Liquide SA is a leading global industrial gases, technologies, and engineering company with a strong presence across energy, manufacturing, healthcare, and electronics industries. The company specializes in the production, distribution, and application of essential industrial gases, including oxygen, nitrogen, hydrogen, argon, and rare gases, serving customers through an extensive global production and supply network. Air Liquide organizes its operations into five key business segments: Industrial Merchant, Large Industries, Healthcare, Electronics, and Engineering & Technologies. Its diversified business model integrates industrial gas production, engineering expertise, digital solutions, and healthcare services, enabling the company to support customers' productivity, operational efficiency, and decarbonization objectives. In the syngas market, Air Liquide provides advanced gasification, hydrogen production, gas purification, and carbon capture solutions that enhance process efficiency and support low-carbon industrial applications.
- Air Products and Chemicals, Inc. is a leading global provider of industrial gases, hydrogen, and engineering solutions, serving a wide range of industries through an extensive worldwide production and distribution network. The company specializes in the production of atmospheric and process gases, including oxygen, nitrogen, hydrogen, helium, and carbon dioxide, supporting sectors such as refining, chemicals, metals, electronics, manufacturing, food processing, and energy. Air Products has established a strong market position through its on-site gas production facilities, merchant gas distribution network, pipeline systems, and equipment sales business, enabling long-term customer partnerships and reliable gas supply management. In the syngas market, the company offers advanced gasification technologies, hydrogen production systems, syngas processing solutions, and carbon capture capabilities that support the production of cleaner fuels, chemicals, and low-carbon hydrogen.
- BASF SE is one of the world's leading chemical manufacturing companies, offering a diversified portfolio spanning chemicals, materials, industrial solutions, surface technologies, nutrition, agricultural products, and specialty chemicals. The company develops and commercializes a broad range of products, including solvents, adhesives, surfactants, fuel additives, electronic chemicals, pigments, coatings, food ingredients, fungicides, and herbicides. Within the syngas market, BASF is recognized for its advanced catalyst technologies, proprietary process solutions, and expertise in syngas optimization for chemical manufacturing. The company focuses on improving syngas production efficiency, increasing feedstock flexibility, reducing emissions, and supporting downstream applications such as hydrogen, methanol, ammonia, synthetic fuels, and other chemical intermediates. BASF continues to invest in process innovation and decarbonization technologies to improve operational performance and support the transition toward more sustainable chemical production.
- Haldor Topsøe is a leading global provider of decarbonization technologies, industrial catalysts, and engineering solutions, specializing in technologies that accelerate the transition toward sustainable energy and low-carbon industrial production. The company delivers integrated solutions across clean fuels, green hydrogen, syngas, ammonia, methanol, sustainable aviation fuel (SAF), and emissions reduction technologies. Topsoe operates through three core business areas: Catalyst, Technology, and Power-to-X, combining scientific research, proprietary catalyst development, and advanced process engineering. The company's expertise spans syngas production, hydrogen processing, ammonia synthesis, methanol production, carbon management, and renewable fuel technologies. In the syngas market, Topsoe provides highly efficient reforming technologies, catalyst systems, and process optimization solutions that improve conversion efficiency, enhance feedstock flexibility, lower energy consumption, and enable the production of low-carbon fuels and chemical products.
- Johnson Matthey Plc (JM) is a leading global specialty chemicals, sustainable technologies, and advanced catalyst solutions provider, recognized for its expertise in clean energy, hydrogen, and emissions reduction technologies. The company focuses on enabling the global energy transition by developing innovative solutions that help industries reduce carbon emissions, improve resource efficiency, and accelerate decarbonization across energy-intensive sectors. Within the syngas market, Johnson Matthey has established a strong position through its comprehensive portfolio of proprietary catalysts, process technologies, and technology licensing solutions. The company offers advanced reforming, methanol synthesis, hydrogen production, and syngas conversion technologies that enable the efficient transformation of synthesis gas into high-value products such as methanol, ammonia, hydrogen, synthetic fuels, and other chemical intermediates.
Below is the list of the key players, among several others, operating in the global syngas market:
The global syngas market is characterized by the strong presence of regional and international companies. Leading companies are investing in technological innovations to introduce next-gen solutions. They are also engaging in strategic collaborations with others to enhance their product offerings. Some gigantic companies are exploring opportunities across high-potential economies to earn lucrative returns. Both organic and inorganic marketing strategies are projected to double the revenues of key players during the study timeframe.
Corporate Landscape of the Global Syngas Market:
Recent Developments
- In January 2026, Haffner Energy introduced its new C-iC modular industrial units, aimed at solving funding and rollout issues in medium-sized decentralized biofuel projects. By lowering major cost barriers, this model makes such projects easier to finance and carry out without subsidies.
- In June 2026, PyroGenesis announced a joint project with Innofibre to turn contaminated biomass into syngas. Innofibre is a research center in Quebec that works on paper and biorefining technologies.
- Report ID: 8693
- Published Date: Jul 24, 2026
- Report Format: PDF, PPT
- Explore a preview of key market trends and insights
- Review sample data tables and segment breakdowns
- Experience the quality of our visual data representations
- Evaluate our report structure and research methodology
- Get a glimpse of competitive landscape analysis
- Understand how regional forecasts are presented
- Assess the depth of company profiling and benchmarking
- Preview how actionable insights can support your strategy
Explore real data and analysis
Frequently Asked Questions (FAQ)
About this Report
Connect with our Expert


Report, 2027-2037


Copyright @ 2026 Research Nester. All Rights Reserved.
