Global SST Market
1. An Outline of the Global SST Market
1.1. Market Definition and Segmentation
1.2. Study Assumptions and Abbreviations
2. Research Methodology & Approach
2.1. Primary Research
2.2. Secondary Research
2.3. Data Triangulation
2.4. SPSS Methodology
3. Executive Summary
4. Growth Drivers
5. Major Roadblocks
6. Opportunities
7. Prevalent Trends
8. Government Regulation
9. Growth Outlook
10. Competitive White Space Analysis – Identifying Untapped Market Gaps
11. Risk Overview
12. SWOT
13. Technological Advancement
14. Technology Maturity Matrix for the SST Market: Recent News
15. Regional Demand
16. Global SST by Geography – Strategic Comparative Analysis
17. Strategic Segment Analysis: SST Demand Landscape
18. SST Demand Trends Driven by expansion of electric vehicle charging infrastructure, increasing renewable power generation, and rising electricity demand from data centers. (2027-2036)
19. Root Cause Analysis (RCA) for discovering problems of the SST Market
20. Porter Five Forces
21. PESTLE
22. Comparative Positioning
23. Global SST – Key Player Analysis (2036)
24. Competitive Landscape: Key Suppliers/Players
25. Competitive Model: A Detailed Inside View for Investors
26. Company Market Share, 2036 (%)
26.1. Hitachi Energy Ltd.
26.2. Siemens Energy AG
26.3. Schneider Electric SE
26.4. GE Vernova Inc.
26.5. Mitsubishi Electric Corporation
26.6. ABB Ltd.
26.7. Eaton Corporation plc
26.8. Toshiba Energy Systems & Solutions Corporation
26.9. Fuji Electric Co., Ltd.
26.10. TMEIC Corporation
27. Global SST Market Outlook
27.1. Market Overview
27.1.1. Market Revenue by Value (USD Thousand), by Volume (Units), and Compound Annual Growth Rate (CAGR)
27.2. SST Market Segmentation Analysis (2027-2036)
27.2.1. By Voltage Level
27.2.1.1. Low Voltage (≤1kV), Market Value (USD Thousand), and CAGR, 2027-2036F
27.2.1.2. Medium Voltage (1–35 kV), Market Value (USD Thousand), and CAGR, 2027-2036F
27.2.1.3. High Voltage (>230 kV), Market Value (USD Thousand), and CAGR, 2027-2036F
27.2.1.4. Extra High Voltage (35–230 kV), Market Value (USD Thousand), and CAGR, 2027-2036F
27.2.2. By Application
27.2.2.1. Renewable Energy Integration, Market Value (USD Thousand), and CAGR, 2027-2036F
27.2.2.2. Automotive Electrification, Market Value (USD Thousand), and CAGR, 2027-2036F
27.2.2.3. Power Grid Modernization, Market Value (USD Thousand), and CAGR, 2027-2036F
27.2.2.4. Railway/Traction Systems, Market Value (USD Thousand), and CAGR, 2027-2036F
27.2.2.5. Data Centers, Market Value (USD Thousand), and CAGR, 2027-2036F
27.2.2.6. Others, Market Value (USD Thousand), and CAGR, 2027-2036F
27.2.3. By Technology Architecture
27.2.3.1. AC-DC, Market Value (USD Thousand), and CAGR, 2027-2036F
27.2.3.2. AC-DC-AC, Market Value (USD Thousand), and CAGR, 2027-2036F
27.2.3.3. Others, Market Value (USD Thousand), and CAGR, 2027-2036F
27.2.4. By Material
27.2.4.1. Power Semiconductor Materials, Market Value (USD Thousand), and CAGR, 2027-2036F
27.2.4.1.1. Si Thyristors and SiC IGBTs, Market Value (USD Thousand), and CAGR, 2027-2036F
27.2.4.1.2. Si IGBTs, Market Value (USD Thousand), and CAGR, 2027-2036F
27.2.4.1.3. SiC MOSFETs, Market Value (USD Thousand), and CAGR, 2027-2036F
27.2.4.1.4. Others, Market Value (USD Thousand), and CAGR, 2027-2036F
27.2.4.2. Magnetic Core Materials, Market Value (USD Thousand), and CAGR, 2027-2036F
27.2.4.2.1. Ferrite Materials, Market Value (USD Thousand), and CAGR, 2027-2036F
27.2.4.2.2. Nanocrystalline Alloys, Market Value (USD Thousand), and CAGR, 2027-2036F
27.2.4.2.3. Amorphous Metal Alloys, Market Value (USD Thousand), and CAGR, 2027-2036F
27.2.4.2.4. Electrical Steel (Silicon Steel), Market Value (USD Thousand), and CAGR, 2027-2036F
27.2.4.2.5. Others, Market Value (USD Thousand), and CAGR, 2027-2036F
27.2.4.3. Conductor Materials, Market Value (USD Thousand), and CAGR, 2027-2036F
27.2.4.3.1. Copper, Market Value (USD Thousand), and CAGR, 2027-2036F
27.2.4.3.2. Aluminum, Market Value (USD Thousand), and CAGR, 2027-2036F
27.2.4.3.3. Others, Market Value (USD Thousand), and CAGR, 2027-2036F
27.2.4.4. Power Module & Packaging Materials, Market Value (USD Thousand), and CAGR, 2027-2036F
27.2.4.4.1. Ceramic Substrates, Market Value (USD Thousand), and CAGR, 2027-2036F
27.2.4.4.1.1. Alumina (Al₂O₃), Market Value (USD Thousand), and CAGR, 2027-2036F
27.2.4.4.1.2. Silicon Nitride (Si₃N₄), Market Value (USD Thousand), and CAGR, 2027-2036F
27.2.4.4.1.3. Aluminum Nitride (AIN), Market Value (USD Thousand), and CAGR, 2027-2036F
27.2.4.4.2. Solder & Sintered Silver Materials, Market Value (USD Thousand), and CAGR, 2027-2036F
27.2.4.4.3. Encapsulation Polymers, Market Value (USD Thousand), and CAGR, 2027-2036F
27.2.4.4.4. Others, Market Value (USD Thousand), and CAGR, 2027-2036F
27.2.4.5. Insulation Materials, Market Value (USD Thousand), and CAGR, 2027-2036F
27.2.4.5.1. Epoxy Resins, Market Value (USD Thousand), and CAGR, 2027-2036F
27.2.4.5.2. Polyimide Films, Market Value (USD Thousand), and CAGR, 2027-2036F
27.2.4.5.3. Advanced Polymer Composites, Market Value (USD Thousand), and CAGR, 2027-2036F
27.2.4.5.4. Others, Market Value (USD Thousand), and CAGR, 2027-2036F
27.2.4.6. Cooling & Thermal Management Materials, Market Value (USD Thousand), and CAGR, 2027-2036F
27.2.4.6.1. Aluminum Heat Sinks, Market Value (USD Thousand), and CAGR, 2027-2036F
27.2.4.6.2. Liquid Cooling Fluids, Market Value (USD Thousand), and CAGR, 2027-2036F
27.2.4.6.3. Phase Change Materials, Market Value (USD Thousand), and CAGR, 2027-2036F
27.2.4.6.4. Others, Market Value (USD Thousand), and CAGR, 2027-2036F
27.2.4.7. Others, Market Value (USD Thousand), and CAGR, 2027-2036F
27.2.5. Regional Synopsis, Value (USD Thousand), 2027-2036
27.2.5.1. North America Market Value (USD Thousand) and CAGR & Y-o-Y Growth Trend, 2027-2036F
27.2.5.2. Europe Market Value (USD Thousand) and CAGR & Y-o-Y Growth Trend, 2027-2036F
27.2.5.3. Asia Pacific, excluding Japan Market Value (USD Thousand) and CAGR & Y-o-Y Growth Trend, 2027-2036F
27.2.5.4. Latin America Market Value (USD Thousand) and CAGR & Y-o-Y Growth Trend, 2027-2036F
27.2.5.5. Middle East and Africa Market Value (USD Thousand) and CAGR & Y-o-Y Growth Trend, 2027-2036F
28. North America Market
28.1. Overview
28.1.1. Market Value (USD Thousand), Current and Future Projections, 2027-2036
28.1.2. Increment $ Opportunity Assessment, 2027-2036
28.2. Segmentation (USD Thousand), 2027-2036, By
28.2.1. By Voltage Level
28.2.1.1. Low Voltage (≤1kV), Market Value (USD Thousand), and CAGR, 2027-2036F
28.2.1.2. Medium Voltage (1–35 kV), Market Value (USD Thousand), and CAGR, 2027-2036F
28.2.1.3. High Voltage (>230 kV), Market Value (USD Thousand), and CAGR, 2027-2036F
28.2.1.4. Extra High Voltage (35–230 kV), Market Value (USD Thousand), and CAGR, 2027-2036F
28.2.2. By Application
28.2.2.1. Renewable Energy Integration, Market Value (USD Thousand), and CAGR, 2027-2036F
28.2.2.2. Automotive Electrification, Market Value (USD Thousand), and CAGR, 2027-2036F
28.2.2.3. Power Grid Modernization, Market Value (USD Thousand), and CAGR, 2027-2036F
28.2.2.4. Railway/Traction Systems, Market Value (USD Thousand), and CAGR, 2027-2036F
28.2.2.5. Data Centers, Market Value (USD Thousand), and CAGR, 2027-2036F
28.2.2.6. Others, Market Value (USD Thousand), and CAGR, 2027-2036F
28.2.3. By Technology Architecture
28.2.3.1. AC-DC, Market Value (USD Thousand), and CAGR, 2027-2036F
28.2.3.2. AC-DC-AC, Market Value (USD Thousand), and CAGR, 2027-2036F
28.2.3.3. Others, Market Value (USD Thousand), and CAGR, 2027-2036F
28.2.4. By Material
28.2.4.1. Power Semiconductor Materials, Market Value (USD Thousand), and CAGR, 2027-2036F
28.2.4.1.1. Si Thyristors and SiC IGBTs, Market Value (USD Thousand), and CAGR, 2027-2036F
28.2.4.1.2. Si IGBTs, Market Value (USD Thousand), and CAGR, 2027-2036F
28.2.4.1.3. SiC MOSFETs, Market Value (USD Thousand), and CAGR, 2027-2036F
28.2.4.1.4. Others, Market Value (USD Thousand), and CAGR, 2027-2036F
28.2.4.2. Magnetic Core Materials, Market Value (USD Thousand), and CAGR, 2027-2036F
28.2.4.2.1. Ferrite Materials, Market Value (USD Thousand), and CAGR, 2027-2036F
28.2.4.2.2. Nanocrystalline Alloys, Market Value (USD Thousand), and CAGR, 2027-2036F
28.2.4.2.3. Amorphous Metal Alloys, Market Value (USD Thousand), and CAGR, 2027-2036F
28.2.4.2.4. Electrical Steel (Silicon Steel), Market Value (USD Thousand), and CAGR, 2027-2036F
28.2.4.2.5. Others, Market Value (USD Thousand), and CAGR, 2027-2036F
28.2.4.3. Conductor Materials, Market Value (USD Thousand), and CAGR, 2027-2036F
28.2.4.3.1. Copper, Market Value (USD Thousand), and CAGR, 2027-2036F
28.2.4.3.2. Aluminum, Market Value (USD Thousand), and CAGR, 2027-2036F
28.2.4.3.3. Others, Market Value (USD Thousand), and CAGR, 2027-2036F
28.2.4.4. Power Module & Packaging Materials, Market Value (USD Thousand), and CAGR, 2027-2036F
28.2.4.4.1. Ceramic Substrates, Market Value (USD Thousand), and CAGR, 2027-2036F
28.2.4.4.1.1. Alumina (Al₂O₃), Market Value (USD Thousand), and CAGR, 2027-2036F
28.2.4.4.1.2. Silicon Nitride (Si₃N₄), Market Value (USD Thousand), and CAGR, 2027-2036F
28.2.4.4.1.3. Aluminum Nitride (AIN), Market Value (USD Thousand), and CAGR, 2027-2036F
28.2.4.4.2. Solder & Sintered Silver Materials, Market Value (USD Thousand), and CAGR, 2027-2036F
28.2.4.4.3. Encapsulation Polymers, Market Value (USD Thousand), and CAGR, 2027-2036F
28.2.4.4.4. Others, Market Value (USD Thousand), and CAGR, 2027-2036F
28.2.4.5. Insulation Materials, Market Value (USD Thousand), and CAGR, 2027-2036F
28.2.4.5.1. Epoxy Resins, Market Value (USD Thousand), and CAGR, 2027-2036F
28.2.4.5.2. Polyimide Films, Market Value (USD Thousand), and CAGR, 2027-2036F
28.2.4.5.3. Advanced Polymer Composites, Market Value (USD Thousand), and CAGR, 2027-2036F
28.2.4.5.4. Others, Market Value (USD Thousand), and CAGR, 2027-2036F
28.2.4.6. Cooling & Thermal Management Materials, Market Value (USD Thousand), and CAGR, 2027-2036F
28.2.4.6.1. Aluminum Heat Sinks, Market Value (USD Thousand), and CAGR, 2027-2036F
28.2.4.6.2. Liquid Cooling Fluids, Market Value (USD Thousand), and CAGR, 2027-2036F
28.2.4.6.3. Phase Change Materials, Market Value (USD Thousand), and CAGR, 2027-2036F
28.2.4.6.4. Others, Market Value (USD Thousand), and CAGR, 2027-2036F
28.2.4.7. Others, Market Value (USD Thousand), and CAGR, 2027-2036F
28.2.5. Country Level Analysis, Value (USD Thousand)
28.2.5.1. U.S. Market Value (USD Thousand) and CAGR & Y-o-Y Growth Trend, 2027-2036F
28.2.5.2. Canada Market Value (USD Thousand) and CAGR & Y-o-Y Growth Trend, 2027-2036F
29. Europe Market
29.1. Overview
29.1.1. Market Value (USD Thousand), Current and Future Projections, 2027-2036
29.1.2. Increment $ Opportunity Assessment, 2027-2036
29.2. Segmentation (USD Thousand), 2027-2036, By
29.2.1. By Voltage Level
29.2.1.1. Low Voltage (≤1kV), Market Value (USD Thousand), and CAGR, 2027-2036F
29.2.1.2. Medium Voltage (1–35 kV), Market Value (USD Thousand), and CAGR, 2027-2036F
29.2.1.3. High Voltage (>230 kV), Market Value (USD Thousand), and CAGR, 2027-2036F
29.2.1.4. Extra High Voltage (35–230 kV), Market Value (USD Thousand), and CAGR, 2027-2036F
29.2.2. By Application
29.2.2.1. Renewable Energy Integration, Market Value (USD Thousand), and CAGR, 2027-2036F
29.2.2.2. Automotive Electrification, Market Value (USD Thousand), and CAGR, 2027-2036F
29.2.2.3. Power Grid Modernization, Market Value (USD Thousand), and CAGR, 2027-2036F
29.2.2.4. Railway/Traction Systems, Market Value (USD Thousand), and CAGR, 2027-2036F
29.2.2.5. Data Centers, Market Value (USD Thousand), and CAGR, 2027-2036F
29.2.2.6. Others, Market Value (USD Thousand), and CAGR, 2027-2036F
29.2.3. By Technology Architecture
29.2.3.1. AC-DC, Market Value (USD Thousand), and CAGR, 2027-2036F
29.2.3.2. AC-DC-AC, Market Value (USD Thousand), and CAGR, 2027-2036F
29.2.3.3. Others, Market Value (USD Thousand), and CAGR, 2027-2036F
29.2.4. By Material
29.2.4.1. Power Semiconductor Materials, Market Value (USD Thousand), and CAGR, 2027-2036F
29.2.4.1.1. Si Thyristors and SiC IGBTs, Market Value (USD Thousand), and CAGR, 2027-2036F
29.2.4.1.2. Si IGBTs, Market Value (USD Thousand), and CAGR, 2027-2036F
29.2.4.1.3. SiC MOSFETs, Market Value (USD Thousand), and CAGR, 2027-2036F
29.2.4.1.4. Others, Market Value (USD Thousand), and CAGR, 2027-2036F
29.2.4.2. Magnetic Core Materials, Market Value (USD Thousand), and CAGR, 2027-2036F
29.2.4.2.1. Ferrite Materials, Market Value (USD Thousand), and CAGR, 2027-2036F
29.2.4.2.2. Nanocrystalline Alloys, Market Value (USD Thousand), and CAGR, 2027-2036F
29.2.4.2.3. Amorphous Metal Alloys, Market Value (USD Thousand), and CAGR, 2027-2036F
29.2.4.2.4. Electrical Steel (Silicon Steel), Market Value (USD Thousand), and CAGR, 2027-2036F
29.2.4.2.5. Others, Market Value (USD Thousand), and CAGR, 2027-2036F
29.2.4.3. Conductor Materials, Market Value (USD Thousand), and CAGR, 2027-2036F
29.2.4.3.1. Copper, Market Value (USD Thousand), and CAGR, 2027-2036F
29.2.4.3.2. Aluminum, Market Value (USD Thousand), and CAGR, 2027-2036F
29.2.4.3.3. Others, Market Value (USD Thousand), and CAGR, 2027-2036F
29.2.4.4. Power Module & Packaging Materials, Market Value (USD Thousand), and CAGR, 2027-2036F
29.2.4.4.1. Ceramic Substrates, Market Value (USD Thousand), and CAGR, 2027-2036F
29.2.4.4.1.1. Alumina (Al₂O₃), Market Value (USD Thousand), and CAGR, 2027-2036F
29.2.4.4.1.2. Silicon Nitride (Si₃N₄), Market Value (USD Thousand), and CAGR, 2027-2036F
29.2.4.4.1.3. Aluminum Nitride (AIN), Market Value (USD Thousand), and CAGR, 2027-2036F
29.2.4.4.2. Solder & Sintered Silver Materials, Market Value (USD Thousand), and CAGR, 2027-2036F
29.2.4.4.3. Encapsulation Polymers, Market Value (USD Thousand), and CAGR, 2027-2036F
29.2.4.4.4. Others, Market Value (USD Thousand), and CAGR, 2027-2036F
29.2.4.5. Insulation Materials, Market Value (USD Thousand), and CAGR, 2027-2036F
29.2.4.5.1. Epoxy Resins, Market Value (USD Thousand), and CAGR, 2027-2036F
29.2.4.5.2. Polyimide Films, Market Value (USD Thousand), and CAGR, 2027-2036F
29.2.4.5.3. Advanced Polymer Composites, Market Value (USD Thousand), and CAGR, 2027-2036F
29.2.4.5.4. Others, Market Value (USD Thousand), and CAGR, 2027-2036F
29.2.4.6. Cooling & Thermal Management Materials, Market Value (USD Thousand), and CAGR, 2027-2036F
29.2.4.6.1. Aluminum Heat Sinks, Market Value (USD Thousand), and CAGR, 2027-2036F
29.2.4.6.2. Liquid Cooling Fluids, Market Value (USD Thousand), and CAGR, 2027-2036F
29.2.4.6.3. Phase Change Materials, Market Value (USD Thousand), and CAGR, 2027-2036F
29.2.4.6.4. Others, Market Value (USD Thousand), and CAGR, 2027-2036F
29.2.4.7. Others, Market Value (USD Thousand), and CAGR, 2027-2036F
29.2.5. Country Level Analysis, Value (USD Thousand)
29.2.5.1. UK Market Value (USD Thousand) and CAGR & Y-o-Y Growth Trend, 2027-2036F
29.2.5.2. Germany Market Value (USD Thousand) and CAGR & Y-o-Y Growth Trend, 2027-2036F
29.2.5.3. France Market Value (USD Thousand) and CAGR & Y-o-Y Growth Trend, 2027-2036F
29.2.5.4. Italy Market Value (USD Thousand) and CAGR & Y-o-Y Growth Trend, 2027-2036F
29.2.5.5. Spain Market Value (USD Thousand) and CAGR & Y-o-Y Growth Trend, 2027-2036F
29.2.5.6. Netherlands Market Value (USD Thousand) and CAGR & Y-o-Y Growth Trend, 2027-2036F
29.2.5.7. Russia Market Value (USD Thousand) and CAGR & Y-o-Y Growth Trend, 2027-2036F
29.2.5.8. Switzerland Market Value (USD Thousand) and CAGR & Y-o-Y Growth Trend, 2027-2036F
29.2.5.9. Poland Market Value (USD Thousand) and CAGR & Y-o-Y Growth Trend, 2027-2036F
29.2.5.10. Belgium Market Value (USD Thousand) and CAGR & Y-o-Y Growth Trend, 2027-2036F
29.2.5.11. Rest of Europe Market Value (USD Thousand) and CAGR & Y-o-Y Growth Trend, 2027-2036F
30. Asia Pacific, excluding Japan Market
30.1. Overview
30.1.1. Market Value (USD Thousand), Current and Future Projections, 2027-2036
30.1.2. Increment $ Opportunity Assessment, 2027-2036
30.2. Segmentation (USD Thousand), 2027-2036, By
30.2.1. By Voltage Level
30.2.1.1. Low Voltage (≤1kV), Market Value (USD Thousand), and CAGR, 2027-2036F
30.2.1.2. Medium Voltage (1–35 kV), Market Value (USD Thousand), and CAGR, 2027-2036F
30.2.1.3. High Voltage (>230 kV), Market Value (USD Thousand), and CAGR, 2027-2036F
30.2.1.4. Extra High Voltage (35–230 kV), Market Value (USD Thousand), and CAGR, 2027-2036F
30.2.2. By Application
30.2.2.1. Renewable Energy Integration, Market Value (USD Thousand), and CAGR, 2027-2036F
30.2.2.2. Automotive Electrification, Market Value (USD Thousand), and CAGR, 2027-2036F
30.2.2.3. Power Grid Modernization, Market Value (USD Thousand), and CAGR, 2027-2036F
30.2.2.4. Railway/Traction Systems, Market Value (USD Thousand), and CAGR, 2027-2036F
30.2.2.5. Data Centers, Market Value (USD Thousand), and CAGR, 2027-2036F
30.2.2.6. Others, Market Value (USD Thousand), and CAGR, 2027-2036F
30.2.3. By Technology Architecture
30.2.3.1. AC-DC, Market Value (USD Thousand), and CAGR, 2027-2036F
30.2.3.2. AC-DC-AC, Market Value (USD Thousand), and CAGR, 2027-2036F
30.2.3.3. Others, Market Value (USD Thousand), and CAGR, 2027-2036F
30.2.4. By Material
30.2.4.1. Power Semiconductor Materials, Market Value (USD Thousand), and CAGR, 2027-2036F
30.2.4.1.1. Si Thyristors and SiC IGBTs, Market Value (USD Thousand), and CAGR, 2027-2036F
30.2.4.1.2. Si IGBTs, Market Value (USD Thousand), and CAGR, 2027-2036F
30.2.4.1.3. SiC MOSFETs, Market Value (USD Thousand), and CAGR, 2027-2036F
30.2.4.1.4. Others, Market Value (USD Thousand), and CAGR, 2027-2036F
30.2.4.2. Magnetic Core Materials, Market Value (USD Thousand), and CAGR, 2027-2036F
30.2.4.2.1. Ferrite Materials, Market Value (USD Thousand), and CAGR, 2027-2036F
30.2.4.2.2. Nanocrystalline Alloys, Market Value (USD Thousand), and CAGR, 2027-2036F
30.2.4.2.3. Amorphous Metal Alloys, Market Value (USD Thousand), and CAGR, 2027-2036F
30.2.4.2.4. Electrical Steel (Silicon Steel), Market Value (USD Thousand), and CAGR, 2027-2036F
30.2.4.2.5. Others, Market Value (USD Thousand), and CAGR, 2027-2036F
30.2.4.3. Conductor Materials, Market Value (USD Thousand), and CAGR, 2027-2036F
30.2.4.3.1. Copper, Market Value (USD Thousand), and CAGR, 2027-2036F
30.2.4.3.2. Aluminum, Market Value (USD Thousand), and CAGR, 2027-2036F
30.2.4.3.3. Others, Market Value (USD Thousand), and CAGR, 2027-2036F
30.2.4.4. Power Module & Packaging Materials, Market Value (USD Thousand), and CAGR, 2027-2036F
30.2.4.4.1. Ceramic Substrates, Market Value (USD Thousand), and CAGR, 2027-2036F
30.2.4.4.1.1. Alumina (Al₂O₃), Market Value (USD Thousand), and CAGR, 2027-2036F
30.2.4.4.1.2. Silicon Nitride (Si₃N₄), Market Value (USD Thousand), and CAGR, 2027-2036F
30.2.4.4.1.3. Aluminum Nitride (AIN), Market Value (USD Thousand), and CAGR, 2027-2036F
30.2.4.4.2. Solder & Sintered Silver Materials, Market Value (USD Thousand), and CAGR, 2027-2036F
30.2.4.4.3. Encapsulation Polymers, Market Value (USD Thousand), and CAGR, 2027-2036F
30.2.4.4.4. Others, Market Value (USD Thousand), and CAGR, 2027-2036F
30.2.4.5. Insulation Materials, Market Value (USD Thousand), and CAGR, 2027-2036F
30.2.4.5.1. Epoxy Resins, Market Value (USD Thousand), and CAGR, 2027-2036F
30.2.4.5.2. Polyimide Films, Market Value (USD Thousand), and CAGR, 2027-2036F
30.2.4.5.3. Advanced Polymer Composites, Market Value (USD Thousand), and CAGR, 2027-2036F
30.2.4.5.4. Others, Market Value (USD Thousand), and CAGR, 2027-2036F
30.2.4.6. Cooling & Thermal Management Materials, Market Value (USD Thousand), and CAGR, 2027-2036F
30.2.4.6.1. Aluminum Heat Sinks, Market Value (USD Thousand), and CAGR, 2027-2036F
30.2.4.6.2. Liquid Cooling Fluids, Market Value (USD Thousand), and CAGR, 2027-2036F
30.2.4.6.3. Phase Change Materials, Market Value (USD Thousand), and CAGR, 2027-2036F
30.2.4.6.4. Others, Market Value (USD Thousand), and CAGR, 2027-2036F
30.2.4.7. Others, Market Value (USD Thousand), and CAGR, 2027-2036F
30.2.5. Country Level Analysis, Value (USD Thousand)
30.2.5.1. China Market Value (USD Thousand) and CAGR & Y-o-Y Growth Trend, 2027-2036F
30.2.5.2. India Market Value (USD Thousand) and CAGR & Y-o-Y Growth Trend, 2027-2036F
30.2.5.3. South Korea Market Value (USD Thousand) and CAGR & Y-o-Y Growth Trend, 2027-2036F
30.2.5.4. Australia Market Value (USD Thousand) and CAGR & Y-o-Y Growth Trend, 2027-2036F
30.2.5.5. Indonesia Market Value (USD Thousand) and CAGR & Y-o-Y Growth Trend, 2027-2036F
30.2.5.6. Malaysia Market Value (USD Thousand) and CAGR & Y-o-Y Growth Trend, 2027-2036F
30.2.5.7. Vietnam Market Value (USD Thousand) and CAGR & Y-o-Y Growth Trend, 2027-2036F
30.2.5.8. Thailand Market Value (USD Thousand) and CAGR & Y-o-Y Growth Trend, 2027-2036F
30.2.5.9. Singapore Market Value (USD Thousand) and CAGR & Y-o-Y Growth Trend, 2027-2036F
30.2.5.10. New Zealand Market Value (USD Thousand) and CAGR & Y-o-Y Growth Trend, 2027-2036F
30.2.5.11. Rest of Asia Pacific Excluding Japan Market Value (USD Thousand) and CAGR & Y-o-Y Growth Trend, 2027-2036F
31. Latin America Market
31.1. Overview
31.1.1. Market Value (USD Thousand), Current and Future Projections, 2027-2036
31.1.2. Increment $ Opportunity Assessment, 2027-2036
31.1.3. Year-on-Year Growth Forecast (%)
31.2. Segmentation (USD Thousand), 2027-2036, By
31.2.1. By Voltage Level
31.2.1.1. Low Voltage (≤1kV), Market Value (USD Thousand), and CAGR, 2027-2036F
31.2.1.2. Medium Voltage (1–35 kV), Market Value (USD Thousand), and CAGR, 2027-2036F
31.2.1.3. High Voltage (>230 kV), Market Value (USD Thousand), and CAGR, 2027-2036F
31.2.1.4. Extra High Voltage (35–230 kV), Market Value (USD Thousand), and CAGR, 2027-2036F
31.2.2. By Application
31.2.2.1. Renewable Energy Integration, Market Value (USD Thousand), and CAGR, 2027-2036F
31.2.2.2. Automotive Electrification, Market Value (USD Thousand), and CAGR, 2027-2036F
31.2.2.3. Power Grid Modernization, Market Value (USD Thousand), and CAGR, 2027-2036F
31.2.2.4. Railway/Traction Systems, Market Value (USD Thousand), and CAGR, 2027-2036F
31.2.2.5. Data Centers, Market Value (USD Thousand), and CAGR, 2027-2036F
31.2.2.6. Others, Market Value (USD Thousand), and CAGR, 2027-2036F
31.2.3. By Technology Architecture
31.2.3.1. AC-DC, Market Value (USD Thousand), and CAGR, 2027-2036F
31.2.3.2. AC-DC-AC, Market Value (USD Thousand), and CAGR, 2027-2036F
31.2.3.3. Others, Market Value (USD Thousand), and CAGR, 2027-2036F
31.2.4. By Material
31.2.4.1. Power Semiconductor Materials, Market Value (USD Thousand), and CAGR, 2027-2036F
31.2.4.1.1. Si Thyristors and SiC IGBTs, Market Value (USD Thousand), and CAGR, 2027-2036F
31.2.4.1.2. Si IGBTs, Market Value (USD Thousand), and CAGR, 2027-2036F
31.2.4.1.3. SiC MOSFETs, Market Value (USD Thousand), and CAGR, 2027-2036F
31.2.4.1.4. Others, Market Value (USD Thousand), and CAGR, 2027-2036F
31.2.4.2. Magnetic Core Materials, Market Value (USD Thousand), and CAGR, 2027-2036F
31.2.4.2.1. Ferrite Materials, Market Value (USD Thousand), and CAGR, 2027-2036F
31.2.4.2.2. Nanocrystalline Alloys, Market Value (USD Thousand), and CAGR, 2027-2036F
31.2.4.2.3. Amorphous Metal Alloys, Market Value (USD Thousand), and CAGR, 2027-2036F
31.2.4.2.4. Electrical Steel (Silicon Steel), Market Value (USD Thousand), and CAGR, 2027-2036F
31.2.4.2.5. Others, Market Value (USD Thousand), and CAGR, 2027-2036F
31.2.4.3. Conductor Materials, Market Value (USD Thousand), and CAGR, 2027-2036F
31.2.4.3.1. Copper, Market Value (USD Thousand), and CAGR, 2027-2036F
31.2.4.3.2. Aluminum, Market Value (USD Thousand), and CAGR, 2027-2036F
31.2.4.3.3. Others, Market Value (USD Thousand), and CAGR, 2027-2036F
31.2.4.4. Power Module & Packaging Materials, Market Value (USD Thousand), and CAGR, 2027-2036F
31.2.4.4.1. Ceramic Substrates, Market Value (USD Thousand), and CAGR, 2027-2036F
31.2.4.4.1.1. Alumina (Al₂O₃), Market Value (USD Thousand), and CAGR, 2027-2036F
31.2.4.4.1.2. Silicon Nitride (Si₃N₄), Market Value (USD Thousand), and CAGR, 2027-2036F
31.2.4.4.1.3. Aluminum Nitride (AIN), Market Value (USD Thousand), and CAGR, 2027-2036F
31.2.4.4.2. Solder & Sintered Silver Materials, Market Value (USD Thousand), and CAGR, 2027-2036F
31.2.4.4.3. Encapsulation Polymers, Market Value (USD Thousand), and CAGR, 2027-2036F
31.2.4.4.4. Others, Market Value (USD Thousand), and CAGR, 2027-2036F
31.2.4.5. Insulation Materials, Market Value (USD Thousand), and CAGR, 2027-2036F
31.2.4.5.1. Epoxy Resins, Market Value (USD Thousand), and CAGR, 2027-2036F
31.2.4.5.2. Polyimide Films, Market Value (USD Thousand), and CAGR, 2027-2036F
31.2.4.5.3. Advanced Polymer Composites, Market Value (USD Thousand), and CAGR, 2027-2036F
31.2.4.5.4. Others, Market Value (USD Thousand), and CAGR, 2027-2036F
31.2.4.6. Cooling & Thermal Management Materials, Market Value (USD Thousand), and CAGR, 2027-2036F
31.2.4.6.1. Aluminum Heat Sinks, Market Value (USD Thousand), and CAGR, 2027-2036F
31.2.4.6.2. Liquid Cooling Fluids, Market Value (USD Thousand), and CAGR, 2027-2036F
31.2.4.6.3. Phase Change Materials, Market Value (USD Thousand), and CAGR, 2027-2036F
31.2.4.6.4. Others, Market Value (USD Thousand), and CAGR, 2027-2036F
31.2.4.7. Others, Market Value (USD Thousand), and CAGR, 2027-2036F
31.2.5. Country Level Analysis, Value (USD Thousand)
31.2.5.1. Brazil Market Value (USD Thousand) and CAGR & Y-o-Y Growth Trend, 2027-2036F
31.2.5.2. Argentina Market Value (USD Thousand) and CAGR & Y-o-Y Growth Trend, 2027-2036F
31.2.5.3. Mexico Market Value (USD Thousand) and CAGR & Y-o-Y Growth Trend, 2027-2036F
31.2.5.4. Rest of Latin America Market Value (USD Thousand) and CAGR & Y-o-Y Growth Trend, 2027-2036F
32. Middle East & Africa Market
32.1. Overview
32.1.1. Market Value (USD Thousand), Current and Future Projections, 2027-2036
32.1.2. Increment $ Opportunity Assessment, 2027-2036
32.1.3. Year-on-Year Growth Forecast (%)
32.2. Segmentation (USD Thousand), 2027-2036, By
32.2.1. By Voltage Level
32.2.1.1. Low Voltage (≤1kV), Market Value (USD Thousand), and CAGR, 2027-2036F
32.2.1.2. Medium Voltage (1–35 kV), Market Value (USD Thousand), and CAGR, 2027-2036F
32.2.1.3. High Voltage (>230 kV), Market Value (USD Thousand), and CAGR, 2027-2036F
32.2.1.4. Extra High Voltage (35–230 kV), Market Value (USD Thousand), and CAGR, 2027-2036F
32.2.2. By Application
32.2.2.1. Renewable Energy Integration, Market Value (USD Thousand), and CAGR, 2027-2036F
32.2.2.2. Automotive Electrification, Market Value (USD Thousand), and CAGR, 2027-2036F
32.2.2.3. Power Grid Modernization, Market Value (USD Thousand), and CAGR, 2027-2036F
32.2.2.4. Railway/Traction Systems, Market Value (USD Thousand), and CAGR, 2027-2036F
32.2.2.5. Data Centers, Market Value (USD Thousand), and CAGR, 2027-2036F
32.2.2.6. Others, Market Value (USD Thousand), and CAGR, 2027-2036F
32.2.3. By Technology Architecture
32.2.3.1. AC-DC, Market Value (USD Thousand), and CAGR, 2027-2036F
32.2.3.2. AC-DC-AC, Market Value (USD Thousand), and CAGR, 2027-2036F
32.2.3.3. Others, Market Value (USD Thousand), and CAGR, 2027-2036F
32.2.4. By Material
32.2.4.1. Power Semiconductor Materials, Market Value (USD Thousand), and CAGR, 2027-2036F
32.2.4.1.1. Si Thyristors and SiC IGBTs, Market Value (USD Thousand), and CAGR, 2027-2036F
32.2.4.1.2. Si IGBTs, Market Value (USD Thousand), and CAGR, 2027-2036F
32.2.4.1.3. SiC MOSFETs, Market Value (USD Thousand), and CAGR, 2027-2036F
32.2.4.1.4. Others, Market Value (USD Thousand), and CAGR, 2027-2036F
32.2.4.2. Magnetic Core Materials, Market Value (USD Thousand), and CAGR, 2027-2036F
32.2.4.2.1. Ferrite Materials, Market Value (USD Thousand), and CAGR, 2027-2036F
32.2.4.2.2. Nanocrystalline Alloys, Market Value (USD Thousand), and CAGR, 2027-2036F
32.2.4.2.3. Amorphous Metal Alloys, Market Value (USD Thousand), and CAGR, 2027-2036F
32.2.4.2.4. Electrical Steel (Silicon Steel), Market Value (USD Thousand), and CAGR, 2027-2036F
32.2.4.2.5. Others, Market Value (USD Thousand), and CAGR, 2027-2036F
32.2.4.3. Conductor Materials, Market Value (USD Thousand), and CAGR, 2027-2036F
32.2.4.3.1. Copper, Market Value (USD Thousand), and CAGR, 2027-2036F
32.2.4.3.2. Aluminum, Market Value (USD Thousand), and CAGR, 2027-2036F
32.2.4.3.3. Others, Market Value (USD Thousand), and CAGR, 2027-2036F
32.2.4.4. Power Module & Packaging Materials, Market Value (USD Thousand), and CAGR, 2027-2036F
32.2.4.4.1. Ceramic Substrates, Market Value (USD Thousand), and CAGR, 2027-2036F
32.2.4.4.1.1. Alumina (Al₂O₃), Market Value (USD Thousand), and CAGR, 2027-2036F
32.2.4.4.1.2. Silicon Nitride (Si₃N₄), Market Value (USD Thousand), and CAGR, 2027-2036F
32.2.4.4.1.3. Aluminum Nitride (AIN), Market Value (USD Thousand), and CAGR, 2027-2036F
32.2.4.4.2. Solder & Sintered Silver Materials, Market Value (USD Thousand), and CAGR, 2027-2036F
32.2.4.4.3. Encapsulation Polymers, Market Value (USD Thousand), and CAGR, 2027-2036F
32.2.4.4.4. Others, Market Value (USD Thousand), and CAGR, 2027-2036F
32.2.4.5. Insulation Materials, Market Value (USD Thousand), and CAGR, 2027-2036F
32.2.4.5.1. Epoxy Resins, Market Value (USD Thousand), and CAGR, 2027-2036F
32.2.4.5.2. Polyimide Films, Market Value (USD Thousand), and CAGR, 2027-2036F
32.2.4.5.3. Advanced Polymer Composites, Market Value (USD Thousand), and CAGR, 2027-2036F
32.2.4.5.4. Others, Market Value (USD Thousand), and CAGR, 2027-2036F
32.2.4.6. Cooling & Thermal Management Materials, Market Value (USD Thousand), and CAGR, 2027-2036F
32.2.4.6.1. Aluminum Heat Sinks, Market Value (USD Thousand), and CAGR, 2027-2036F
32.2.4.6.2. Liquid Cooling Fluids, Market Value (USD Thousand), and CAGR, 2027-2036F
32.2.4.6.3. Phase Change Materials, Market Value (USD Thousand), and CAGR, 2027-2036F
32.2.4.6.4. Others, Market Value (USD Thousand), and CAGR, 2027-2036F
32.2.4.7. Others, Market Value (USD Thousand), and CAGR, 2027-2036F
32.2.5. Country Level Analysis, Value (USD Thousand)
32.2.5.1. Saudi Arabia Market Value (USD Thousand) and CAGR & Y-o-Y Growth Trend, 2027-2036F
32.2.5.2. UAE Market Value (USD Thousand) and CAGR & Y-o-Y Growth Trend, 2027-2036F
32.2.5.3. Israel Market Value (USD Thousand) and CAGR & Y-o-Y Growth Trend, 2027-2036F
32.2.5.4. Qatar Market Value (USD Thousand) and CAGR & Y-o-Y Growth Trend, 2027-2036F
32.2.5.5. Kuwait Market Value (USD Thousand) and CAGR & Y-o-Y Growth Trend, 2027-2036F
32.2.5.6. Oman Market Value (USD Thousand) and CAGR & Y-o-Y Growth Trend, 2027-2036F
32.2.5.7. South Africa Market Value (USD Thousand) and CAGR & Y-o-Y Growth Trend, 2027-2036F
32.2.5.8. Rest of Middle East & Africa Market Value (USD Thousand) and CAGR & Y-o-Y Growth Trend, 2027-2036F
33. Japan Market
33.1. Overview
33.1.1. Market Value (USD Thousand), Current and Future Projections, 2027-2036
33.1.2. Increment $ Opportunity Assessment, 2027-2036
33.1.3. Year-on-Year Growth Forecast (%)
33.2. Segmentation (USD Thousand), 2027-2036, By
33.2.1. By Voltage Level
33.2.1.1. Low Voltage (≤1kV), Market Value (USD Thousand), and CAGR, 2027-2036F
33.2.1.2. Medium Voltage (1–35 kV), Market Value (USD Thousand), and CAGR, 2027-2036F
33.2.1.3. High Voltage (>230 kV), Market Value (USD Thousand), and CAGR, 2027-2036F
33.2.1.4. Extra High Voltage (35–230 kV), Market Value (USD Thousand), and CAGR, 2027-2036F
33.2.2. By Application
33.2.2.1. Renewable Energy Integration, Market Value (USD Thousand), and CAGR, 2027-2036F
33.2.2.2. Automotive Electrification, Market Value (USD Thousand), and CAGR, 2027-2036F
33.2.2.3. Power Grid Modernization, Market Value (USD Thousand), and CAGR, 2027-2036F
33.2.2.4. Railway/Traction Systems, Market Value (USD Thousand), and CAGR, 2027-2036F
33.2.2.5. Data Centers, Market Value (USD Thousand), and CAGR, 2027-2036F
33.2.2.6. Others, Market Value (USD Thousand), and CAGR, 2027-2036F
33.2.3. By Technology Architecture
33.2.3.1. AC-DC, Market Value (USD Thousand), and CAGR, 2027-2036F
33.2.3.2. AC-DC-AC, Market Value (USD Thousand), and CAGR, 2027-2036F
33.2.3.3. Others, Market Value (USD Thousand), and CAGR, 2027-2036F
33.2.4. By Material
33.2.4.1. Power Semiconductor Materials, Market Value (USD Thousand), and CAGR, 2027-2036F
33.2.4.1.1. Si Thyristors and SiC IGBTs, Market Value (USD Thousand), and CAGR, 2027-2036F
33.2.4.1.2. Si IGBTs, Market Value (USD Thousand), and CAGR, 2027-2036F
33.2.4.1.3. SiC MOSFETs, Market Value (USD Thousand), and CAGR, 2027-2036F
33.2.4.1.4. Others, Market Value (USD Thousand), and CAGR, 2027-2036F
33.2.4.2. Magnetic Core Materials, Market Value (USD Thousand), and CAGR, 2027-2036F
33.2.4.2.1. Ferrite Materials, Market Value (USD Thousand), and CAGR, 2027-2036F
33.2.4.2.2. Nanocrystalline Alloys, Market Value (USD Thousand), and CAGR, 2027-2036F
33.2.4.2.3. Amorphous Metal Alloys, Market Value (USD Thousand), and CAGR, 2027-2036F
33.2.4.2.4. Electrical Steel (Silicon Steel), Market Value (USD Thousand), and CAGR, 2027-2036F
33.2.4.2.5. Others, Market Value (USD Thousand), and CAGR, 2027-2036F
33.2.4.3. Conductor Materials, Market Value (USD Thousand), and CAGR, 2027-2036F
33.2.4.3.1. Copper, Market Value (USD Thousand), and CAGR, 2027-2036F
33.2.4.3.2. Aluminum, Market Value (USD Thousand), and CAGR, 2027-2036F
33.2.4.3.3. Others, Market Value (USD Thousand), and CAGR, 2027-2036F
33.2.4.4. Power Module & Packaging Materials, Market Value (USD Thousand), and CAGR, 2027-2036F
33.2.4.4.1. Ceramic Substrates, Market Value (USD Thousand), and CAGR, 2027-2036F
33.2.4.4.1.1. Alumina (Al₂O₃), Market Value (USD Thousand), and CAGR, 2027-2036F
33.2.4.4.1.2. Silicon Nitride (Si₃N₄), Market Value (USD Thousand), and CAGR, 2027-2036F
33.2.4.4.1.3. Aluminum Nitride (AIN), Market Value (USD Thousand), and CAGR, 2027-2036F
33.2.4.4.2. Solder & Sintered Silver Materials, Market Value (USD Thousand), and CAGR, 2027-2036F
33.2.4.4.3. Encapsulation Polymers, Market Value (USD Thousand), and CAGR, 2027-2036F
33.2.4.4.4. Others, Market Value (USD Thousand), and CAGR, 2027-2036F
33.2.4.5. Insulation Materials, Market Value (USD Thousand), and CAGR, 2027-2036F
33.2.4.5.1. Epoxy Resins, Market Value (USD Thousand), and CAGR, 2027-2036F
33.2.4.5.2. Polyimide Films, Market Value (USD Thousand), and CAGR, 2027-2036F
33.2.4.5.3. Advanced Polymer Composites, Market Value (USD Thousand), and CAGR, 2027-2036F
33.2.4.5.4. Others, Market Value (USD Thousand), and CAGR, 2027-2036F
33.2.4.6. Cooling & Thermal Management Materials, Market Value (USD Thousand), and CAGR, 2027-2036F
33.2.4.6.1. Aluminum Heat Sinks, Market Value (USD Thousand), and CAGR, 2027-2036F
33.2.4.6.2. Liquid Cooling Fluids, Market Value (USD Thousand), and CAGR, 2027-2036F
33.2.4.6.3. Phase Change Materials, Market Value (USD Thousand), and CAGR, 2027-2036F
33.2.4.6.4. Others, Market Value (USD Thousand), and CAGR, 2027-2036F
33.2.4.7. Others, Market Value (USD Thousand), and CAGR, 2027-2036F
34. Global Economic Scenario
34.1. World Economic Outlook
35. About Research Nester
35.1. Our Global Clientele
35.2. We Serve Clients Across World
Solid-state Transformer Market Outlook:
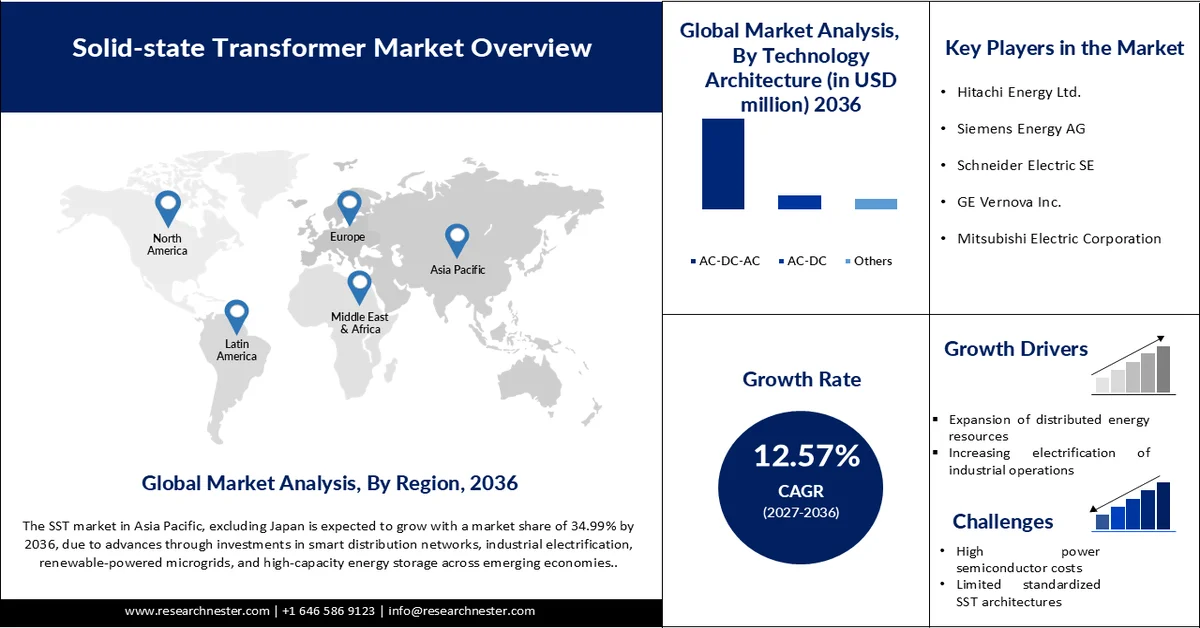
Solid-state Transformer Market size was valued at USD 194.93 million in 2026 and is expected to reach USD 629.48 million by the end of 2036, registering around 12.57% CAGR during the forecast period, i.e., between 2027-2036. In 2027, the industry size of solid-state transformer is evaluated at USD 216.79 million.
The rapid expansion of electric vehicle (EV) infrastructure is opening high-earning opportunities for solid-state transformer (SST) manufacturers. The swift rise in adoption of electric vehicles is boosting the trade of solid-state transformer technologies. The growing deployment of vehicle-to-grid (V2G) and vehicle-to-building systems also strengthens the adoption of solid-state transformers.
The emerging economies are key marketplaces for solid-state transformer manufacturers owing to the supportive zero-emission polices. India is rapidly adopting electric vehicles, making e-mobility a key factor in economic growth, energy security, and environmental improvement, according to PIB India. It further states that EV sales have grown around 46 times since 2016, reflecting strong consumer demand. Exports have also risen sharply, from USD 1.2 million in 2020 to USD 84 million in 2024. Thus, as India is emerging as an EV manufacturing hub, the SST manufacturers are expected to witness high revenue generation in this market.
Key Solid-state Transformer Market Insights Summary:
Regional Highlights:
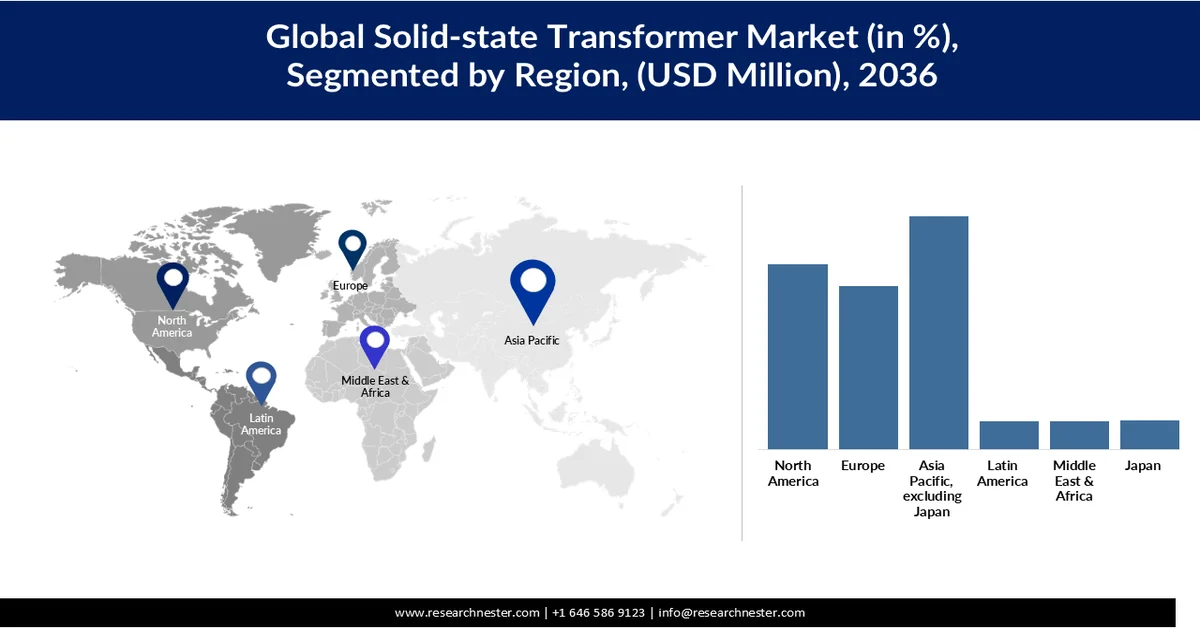
- Asia Pacific excluding Japan (APEJ) is projected to account for 34.99% of the solid state transformer market through 2036, owing to accelerating grid modernization and renewable energy deployment across the region
- North America is expected to hold 27.79% market share by the end of the forecast period, supported by efforts to modernize aging power infrastructure and integrate renewable generation and battery energy storage systems
Segment Insights:
- The medium voltage (1–35 kV) segment in the solid state transformer market is projected to capture 63.9% share through 2036, supported by the increasing integration of distributed energy resources, including solar photovoltaic systems and battery energy storage
- The AC–DC–AC architecture segment is anticipated to account for 77.87% of the market share throughout the forecast period, propelled by its flexible and controllable power conversion across varying voltage and frequency requirements
Key Growth Trends:
- Increasing renewable power generation
- Rising electricity demand from data centers
Major Challenges:
- High initial system cost
- Complex thermal management
Key Players: Hitachi Energy Ltd., Siemens Energy AG, Schneider Electric SE, GE Vernova Inc., Mitsubishi Electric Corporation, ABB Ltd., Eaton Corporation plc, Toshiba Energy Systems & Solutions Corporation, Fuji Electric Co., Ltd., TMEIC Corporation.
Global Solid-state Transformer Market Forecast and Regional Outlook:
Market Size & Growth Projections:
- 2026 Market Size: USD 194.93 million
- 2027 Market Size: USD 216.79 million
- Projected Market Size: USD 629.48 million by 2036
- Growth Forecasts: 12.57% CAGR (2027-2036)
Key Regional Dynamics:
- Largest Region: Asia Pacific excluding Japan (34.99% Share by 2036)
- Fastest Growing Region: Asia Pacific excluding Japan (APEJ)
- Dominating Countries: China, United States, Germany, Japan, South Korea
- Emerging Countries: India, Australia, United Kingdom, France, Canada
Last updated on : 14 August, 2026
Solid-state Transformer Market - Growth Drivers and Challenges
Growth Drivers
- Increasing renewable power generation: The global expansion of solar, wind, and other renewable energy sources is boosting the deployment of solid-state transformers. The need for flexible power conversion and grid-management technologies mainly contributes to the increasing demand for SSTs. According to the International Renewable Energy Agency (IRENA), renewable electricity output rose by 9.8% worldwide in 2024. Europe produced 1,758 TWh, up 7.2% due mainly to solar and hydropower growth; North America generated 1,535 TWh, up 5.8%; and South America produced 1,047 TWh, an increase of 2.9% across renewable technologies. Continuous growth in renewable power generation is set to double the revenues of SST manufacturers in the years ahead.
- Rising electricity demand from data centers: The rapid growth in cloud computing and other digital technologies is increasing electricity consumption from data centers. This directly fuels the need for advanced solid-state transformer technologies for efficient power management. The International Energy Agency (IEA) report disclosed that in 2025, data centers used 17% more electricity than the previous year, while AI-focused facilities recorded even faster growth. This far exceeded the 3% rise in global power demand. The rise in modern hyperscale and AI-oriented data centers is projected to propel the trade of SST technologies during the forecast period.
- Railway and transportation electrification: The increasing electrification of railways and other transportation systems is fuelling the deployment of solid-state transformers. SSTs use high-frequency power electronic conversion to achieve voltage transformation, which increases their adoption in this segment. According to the International Transport Forum, Türkiye increased the share of its electrified rail network by 23 percentage points and aimed to electrify all conventional railway lines by the end of 2023. Such supportive goals and initiatives are likely to fuel the application of solid-state transformers.
Challenges
- High initial system cost: The sales of solid-state transformers are mainly hampered by their high system costs. The integration of specialized materials and advanced technologies increases the final costs of SST. Many key players are focusing on mass production to reduce price and boost product sales.
- Complex thermal management: One of the key factors limiting the adoption of solid-state transformers is the complex thermal management. SSTs rely extensively on power semiconductor devices and high-frequency switching components, which generate high heat during operation. Excessive temperatures increase switching losses and potentially cause premature system failure. The ongoing technological innovations are likely to propel the sales of solid-state transformers in the years ahead.
Solid-state Transformer Market Size and Forecast:
| Report Attribute | Details |
|---|---|
|
Base Year |
2026 |
|
Forecast Period |
2027-2036 |
|
CAGR |
12.57% |
|
Base Year Market Size (2026) |
USD 194.93 million |
|
Forecast Year Market Size (2036) |
USD 629.48 million |
|
Regional Scope |
|
Solid-state Transformer Market Segmentation:
Voltage Level Segment Analysis
The medium voltage (1–35 kV) segment is expected to capture 63.9% of the solid-state transformer (SST) market share through 2036. This is due to the fact that SST technology is particularly well suited to modern distribution networks operating at medium-voltage levels. The increasing integration of distributed energy resources, including solar photovoltaic systems and battery energy storage, is strengthening demand for medium-voltage SSTs. Further, medium-voltage SSTs are gaining attention for high-power EV charging stations, data centers, industrial facilities, and railway electrification.
Technology Architecture Segment Analysis
The AC–DC–AC architecture segment is anticipated to account for 77.87% of the solid-state transformer market share throughout the forecast period. AC–DC–AC architecture is in high demand as it provides highly flexible and controllable power conversion across different voltage and frequency requirements. Its ability to support bidirectional power transfer also contributes to the increasing sales of AC–DC–AC architecture. Renewable energy plants, EV charging infrastructure, and data centers are some of the key end users of AC–DC–AC solid-state transformers.
Material Segment Analysis
The power semiconductor materials segment is estimated to hold 34.78% of the SST market share by the end of 2036. Power semiconductors are the core components responsible for high-frequency switching, voltage conversion, power regulation, and bidirectional energy flow. This distinguishing factor boosts the sales of power semiconductor materials. The growing adoption of silicon carbide (SiC) and gallium nitride (GaN) materials is strengthening the segment’s growth. According to the Observatory of Economic Complexity (OEC), the global trade of semiconductor devices stood at USD 134 billion in 2024.
Our in-depth analysis of the solid-state transformer (SST) market includes the following segments:
|
Segments |
Subsegments |
|
Voltage Level |
|
|
Application |
|
|
Technology Architecture
|
|
|
Material
|
|

Vishnu Nair
Head - Global Business DevelopmentCustomize this report to your requirements — connect with our consultant for personalized insights and options.
Solid-state Transformer Market - Regional Analysis
Asia Pacific excluding Japan Market Insights
Asia Pacific excluding Japan (APEJ) is projected to account for 34.99% of the global solid-state transformer market through 2036. This market is gaining momentum as countries across the region are accelerating grid modernization and renewable energy deployment. The growth in electric mobility and industrial electrification also propels the sales of solid-state transformers. The booming investments in power infrastructure to accommodate rising electricity consumption are also propelling the deployment of SSTs across China, India, South Korea, Australia, and Southeast Asian economies.
The China solid-state transformer market is estimated to reach USD 100,906.02 thousand by the end of 2036. The country’s extensive electricity infrastructure and renewable energy capacity are booming the trade of solid-state transformers. The positive electric vehicle ecosystem and advanced power electronics industry also contribute to market growth. The country's large-scale deployment of solar and wind generation is further propelling the deployment of solid-state transformers.
The India SST market is projected to increase from USD 8,150.93 thousand in 2026 to USD 35,251.01 thousand by 2036. The country's rapid expansion of electricity infrastructure and renewable generation propels the trade of SSTs. The country’s growing electricity demand also propels the deployment of solid-state transformer technologies. According to the Institute for Transportation and Development Policy, India’s public EV charging network grew from around 5,000 stations in FY22 to more than 26,000 by early FY25, representing an annual growth rate of about 70%. Thus, the country's electric vehicle ecosystem is set to double the revenues of SST manufacturers in the years ahead.
Japan Market Insights
The Japan solid-state transformer (SST) market is anticipated to be valued at USD 10,031.90 thousand in 2027. The country’s electricity infrastructure modernization program and increasing integration of renewable energy are propelling the sales of solid-state transformers. The growth in energy storage technologies and electric mobility is also fueling the deployment of solid-state transformers.
The expansion of solar power and battery energy storage is further creating a lucrative environment for SST manufacturers. The country's sophisticated industrial, semiconductor, robotics, and data center sectors are some of the key end users of solid-state transformers. In November 2024, Mitsubishi Electric announced a USD 66.7 million (10 billion Japanese Yen) investment in a new power semiconductor module assembly and testing facility in Fukuoka, Japan. The plant is scheduled to start operating in October 2026. Such strategic advancements are further pushing the overall market growth.
Japan Solid-state Transformer Market Size and Forecast
|
Report Attribute |
Details |
|
Base Year Market Size (2026) |
USD 9,090.92 thousand |
|
Forecast Year Market Size (2036) |
USD 27,067.74 thousand |
|
CAGR (2026-2036) |
11.66% |
North America Market Insights
North America is expected to account for 27.79% of the solid-state transformer (SST) market share by the end of the forecast period. The market is gaining traction as utilities, technology companies, and industrial operators are focusing on modernizing aging power infrastructure and seeking greater flexibility in electricity distribution. The region's growing deployment of renewable generation and battery energy storage systems is also contributing to market growth. Further growth in adoption of electric vehicles and distributed energy resources is poised to double the revenues of key players in the years ahead.
The U.S. solid-state transformer market is anticipated to be valued at 60,342.40 thousand in 2027. The market is supported by the rise in grid modernization and renewable energy expansion. The boom in electric vehicle adoption and rapidly increasing electricity demand from data centers also contribute to the market growth. In 2024, Charge America, a WattEV subsidiary, received a USD 5 million California Energy Commission grant to develop three solid-state megawatt chargers. The systems were designed with Microchip Technology and initially use separate 3,300-volt transistors. Thus, the U.S. is the most lucrative market for solid-state transformer manufacturers.
The Canada SST market is expected to expand at a CAGR of 10.26% from 2027 to 2036. The market is developing alongside investments in electricity-grid modernization and renewable energy technologies. Canada's large geographic footprint and diverse power-generation mix are also driving a robust demand for flexible electricity infrastructure. Further, the rise in zero-emission vehicles is set to boost the deployment of solid-state transformers.
Europe Market Insights
Europe is expected to capture 24.50 % of the global solid-state transformer (SST) market share throughout the forecast period. The market is developing swiftly as the region restructures its electricity infrastructure around renewable generation and distributed energy resources. The increasing penetration of solar and wind power is fueling the deployment of solid-state transformer technologies.
The UK solid-state transformer market is projected to increase at a CAGR of 13.19% between 2027 and 2036. The market is gaining potential as the country expands renewable electricity generation, electrifies transportation, and upgrades its aging distribution infrastructure. The increasing contribution of offshore wind and solar generation is also boosting the deployment of solid-state transformer technologies.
The Germany SST market is projected to be valued at USD 38,555.79 thousand by 2036. The market is supported by the country's industrial base, energy transition, and renewable power expansion. The increasing electrification of transportation is pushing the application of solid-state transformers. Germany's strong electric vehicle and automotive ecosystem provides a lucrative environment for SST companies.
Key Solid-state Transformer Market Players:
- Hitachi Energy Ltd. (Switzerland)
- Siemens Energy AG (Germany)
- Schneider Electric SE (France)
- GE Vernova Inc. (U.S.)
- Mitsubishi Electric Corporation (Japan)
- ABB Ltd. (Switzerland)
- Eaton Corporation plc (Ireland)
- Toshiba Energy Systems & Solutions Corporation (Japan)
- Fuji Electric Co., Ltd. (Japan)
- TMEIC Corporation (Japan)
- Company Overview
- Business Strategy
- Key Product Offerings
- Financial Performance
- Key Performance Indicators
- Risk Analysis
- Recent Development
- Regional Presence
- SWOT Analysis
- Hitachi Energy Ltd. maintains a strong position in advanced grid technologies, power electronics, and transformer solutions, supporting its participation in emerging SST applications. The company focuses on grid modernization, renewable integration, energy storage, and digital power management. Its strategic emphasis on intelligent grid infrastructure, high-voltage technologies, and partnerships with utilities strengthens its ability to address growing demand for flexible and digitally controlled power-conversion systems.
- Siemens Energy AG competes through its extensive portfolio spanning grid technologies, power transmission, electrification, and advanced energy systems. The company is focusing on modernizing electricity networks and integrating renewable generation through digitalized grid solutions. Its investments in power electronics, grid automation, and flexible transmission technologies position it to capitalize on emerging SST opportunities across utilities, renewable projects, industrial facilities, and electrified transportation.
- Schneider Electric SE has a broad presence in intelligent energy management, medium-voltage distribution, power electronics, and digital infrastructure. The company emphasizes electrification, automation, and software-enabled power management to support more flexible electricity networks. Its strategic focus on data centers, microgrids, renewable integration, EV charging, and distributed energy resources creates multiple application opportunities for advanced solid-state transformer technologies and intelligent distribution architectures.
- GE Vernova Inc. competes in the SST ecosystem through its grid solutions, power conversion, electrification, and renewable-energy capabilities. The company is prioritizing grid modernization and technologies that improve network flexibility as renewable generation expands. Its focus on advanced grid equipment, digital monitoring, distributed energy resources, and high-power applications provides opportunities to develop next-generation power conversion solutions for utilities, renewable projects, data centers, and industrial customers.
- Mitsubishi Electric Corporation has significant expertise in power electronics, energy systems, semiconductors, railway electrification, and electrical equipment, supporting its position in emerging SST applications. The company focuses on improving energy efficiency, grid stability, and intelligent power management. Its investments in power semiconductor technologies and advanced energy infrastructure create opportunities across renewable integration, EV charging, railway systems, industrial facilities, and smart-grid applications.
Below is the list of the key players, among several others, operating in the global solid-state transformer (SST) market:
The global solid-state transformer market is characterized by the strong presence of regional and global manufacturers. Key players are focused on technological innovations to introduce innovative SST technologies. Some companies are entering strategic partnerships with others to enhance their product offerings. Some giant companies are exploring opportunities in high-potential markets to earn more. Both the organic and inorganic marketing strategies are poised to double the revenues of key players in the years ahead.
Corporate Landscape of the Global Market:
Recent Developments
- In June 2026, Heron Power and LG Energy Solution Vertech began a design partnership to combine Heron’s solid-state transformer technology with LG’s U.S.-made battery storage systems. The integrated DC-to-AC platform is intended for large energy-storage projects, data centers, and industrial facilities.
- In April 2026, Enphase Energy introduced the IQ Solid-State Transformer, a new power platform for AI data centers. It is designed to replace central power-conversion systems with a distributed structure that supports high-density DC power needs.
- Report ID: 6118
- Published Date: Aug 14, 2026
- Report Format: PDF, PPT
- Explore a preview of key market trends and insights
- Review sample data tables and segment breakdowns
- Experience the quality of our visual data representations
- Evaluate our report structure and research methodology
- Get a glimpse of competitive landscape analysis
- Understand how regional forecasts are presented
- Assess the depth of company profiling and benchmarking
- Preview how actionable insights can support your strategy
Explore real data and analysis
Frequently Asked Questions (FAQ)
About this Report
Connect with our Expert


Report, 2027-2036


Copyright @ 2026 Research Nester. All Rights Reserved.
