PVC Additives Market Outlook:
PVC additives market size was estimated at USD 7.21 billion in 2025 and is expected to reach USD 12.89 billion by 2035, rising at a CAGR of 6.1% during the forecast period, i.e., 2026-2035. In 2026, the industry size of PVC additives is evaluated at USD 7.65 billion.
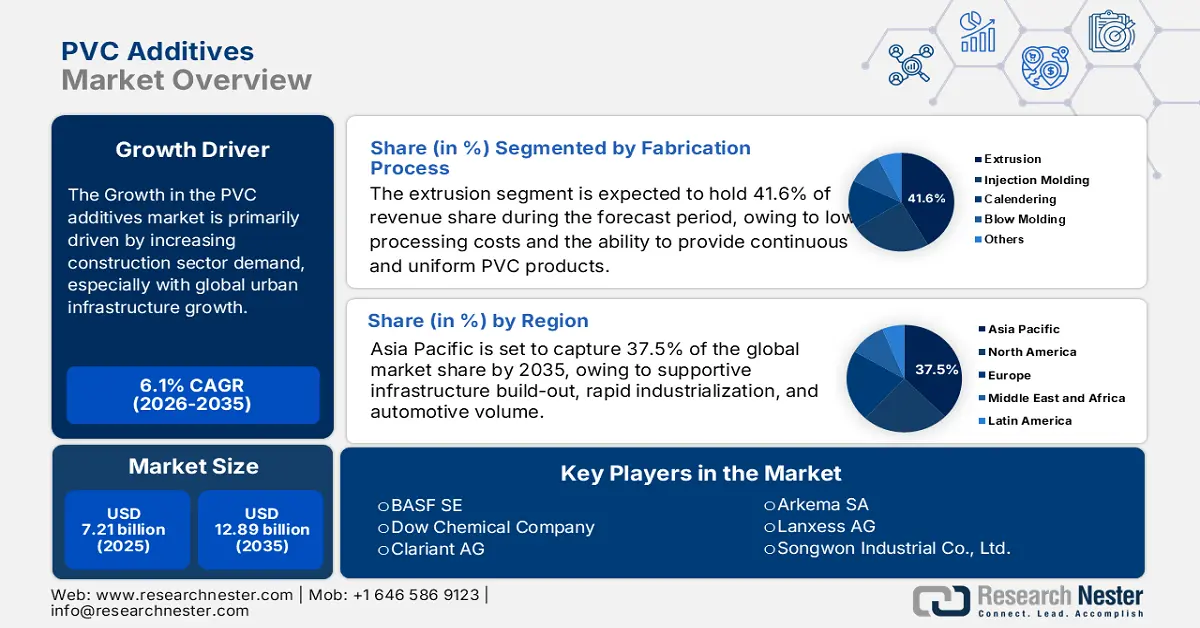
Growth in the PVC additives market is primarily driven by increasing construction sector demand, especially with global urban infrastructure growth. The construction sector uses rigid PVC for applications such as pipes, siding, windows, and door profiles, which all require additives such as stabilizers, lubricants, and impact modifiers. A general energy‐sector report indicates that PVC demand growth has been particularly strong in construction due to urbanization initiatives and significant infrastructure investment. Global PVC capacity was around 59.97 million tons in 2022 and is expected to grow steadily over 3% per year on an annual basis through 2027. This gradual rise indicates a similar increase in usage of additives, which generally based on flexible or rigid grades.
Supply chain analysis was conducted using trade data from the U.S. government, which indicates that in 2022, the U.S. plastics sector imported close to 0.97 million tons of plastic raw materials (USD 2 billion). These imports grew by roughly 20 by volume (25% by dollar value), year over year. These imports included vinyl chloride monomer (VCM), resin, plasticizers, and stabilizers, which are primary feedstocks for additives compounding. Domestic processing capacity grew by 10% from 2021 to 2022 and processed a total of approximately 1.42 million tons of raw feedstock.
Key PVC Additives Market Insights Summary:
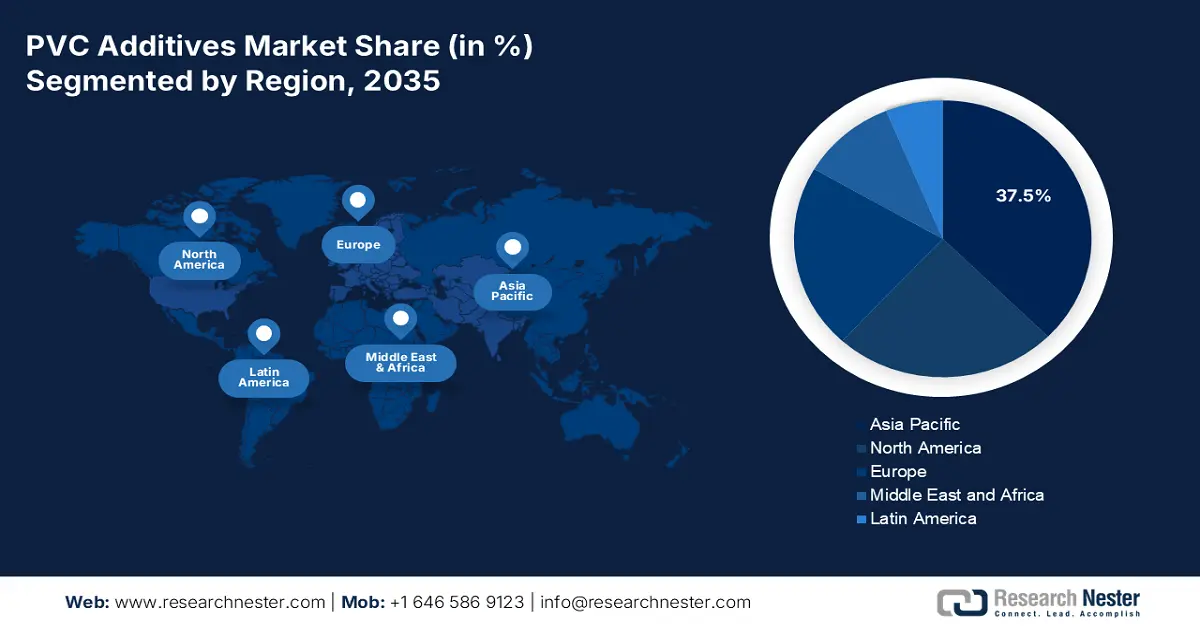
Regional Highlights:
- By 2035, the Asia Pacific region is projected to capture 37.5% of the PVC additives market, owing to supportive infrastructure build-out, rapid industrialization, and automotive volume.
- North America is expected to hold 24.3% share by 2035, driven by regulatory limitations on CO₂ emissions, growing investment in infrastructure, and increasing demand for lightweight, durable materials.
Segment Insights:
- The extrusion segment is projected to account for 41.6% share by 2035 in the PVC additives market, propelled by low processing costs and the ability to provide continuous and uniform PVC products.
- The pipes & fittings segment is expected to hold a 39.9% share by 2035, driven by urbanization, water infrastructure improvements, and growing demand for corrosion-resistant piping.
Key Growth Trends:
- Substitution of traditional materials
- Regulatory pressure & sustainability focus
Major Challenges:
- Volatility in raw material prices
- Shift toward bio-based and sustainable alternatives
Key Players: BASF SE, Dow Chemical Company, Clariant AG, Arkema SA, Lanxess AG, Songwon Industrial Co., Ltd., Baerlocher GmbH, Adeka Corporation, Akzo Nobel N.V., PMC Group, Nouryon, Galata Chemicals, Vinati Organics Ltd., PT Timah Industri, Chemson Group.
Global PVC Additives Market Forecast and Regional Outlook:
Market Size & Growth Projections:
- 2025 Market Size: USD 7.21 billion
- 2026 Market Size: USD 7.65 billion
- Projected Market Size: USD 12.89 billion by 2035
- Growth Forecasts: 6.1% CAGR (2026-2035)
Key Regional Dynamics:
- Largest Region: Asia Pacific (37.5% Share by 2035)
- Fastest Growing Region: Europe
- Dominating Countries: China, United States, Germany, India, Japan
- Emerging Countries: Brazil, Mexico, South Korea, Turkey, Indonesia
Last updated on : 13 August, 2025
PVC Additives Market - Growth Drivers and Challenges
Growth Drivers
-
Substitution of traditional materials: PVC is steadily advancing into potential future applications while replacing traditional materials such as wood, steel, and older plastics in established applications, based on its lower cost, easier entry and processing, and durability. While the transition is clear in applications such as packaging and automotive, uses in consumer goods (like toys) and agriculture especially signal a trend. The continued substitution of older materials with PVC and its additives is expanded further with not only the flexible products but also the rigid products. These rigid and flexible PVC products will require additives - plasticizers to obtain flexibility, flame retardants for safety, and stabilizers to withstand heat. As older conventional materials continue to be substituted, additive demand will continue to rise in all countries and every industry sector. Additive manufacturing (AM) is progressively being integrated into Industry 4.0 and 5.0 frameworks, propelling innovation in the aerospace, automotive, healthcare, and consumer products industries.
-
Regulatory pressure & sustainability focus: Governments in many countries are moving aggressively to curb harmful additives like lead-based stabilizers and phthalates for health and safety reasons. This has encouraged the industry to create "green" alternatives - biobased or non-toxic plasticizers and stabilizers as new additive products. Very quickly, green additives are gaining demand and are becoming more prominent in part due to the sustainability implied longer term, and in other applications, known or unknown regulations in the short term. Manufacturers are investing in substantial R&D to reformulate PVC additives based on growing environmental concerns, and several federal and state governments are imposing regulations.
-
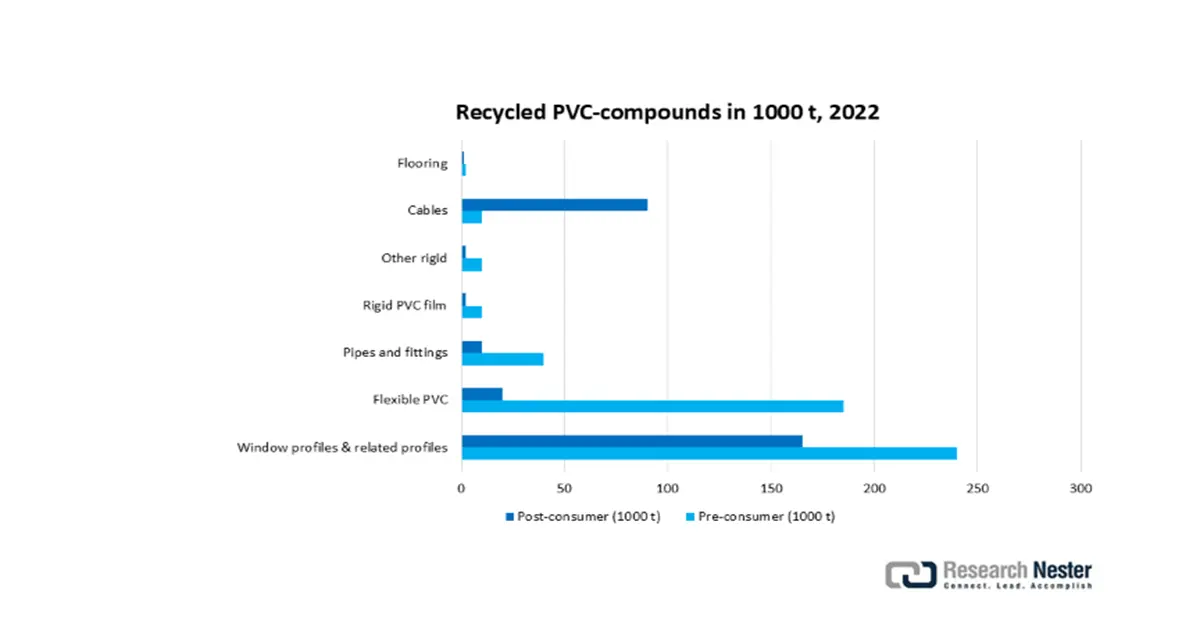
Innovation in recycling & circular economy: With increasing societal and regulatory pressure to reduce plastic waste, sector and government initiatives (such as the circular economy push from the EU) have encouraged reuse and chemical recycling of PVC. For instance, in 2022, the EU recycled 813,266 tons of PVC compounds, with window frames accounting for 56% of total post-consumer recycling. However, the presence and types of additives have a critical influence on recyclability. Demand for compatible, non-migrating types of additives, which do not interfere with material recovery, is increasing. As the industry pivots towards the formulation of recyclable PVC, the development and acceptance of new additive chemistries are emerging to ensure the principles of closed-loop recycling and minimal environmental impact are upheld.
1. Trade Dynamics of PVC Additives Market
Top 5 Importing/Exporting Countries (2023-2024)
|
Exporting Countries |
Count |
Importing Countries |
Count |
|
Turkey |
420 |
Vietnam |
364 |
|
China |
411 |
Russia |
181 |
|
U.S. |
117 |
Kazakhstan |
163 |
|
South Korea |
72 |
Turkey |
76 |
|
Malaysia |
52 |
United States |
76 |
2. Capital Expenditure (CapEx) Investments Fueling PVC Additives Market Growth
Capital expenditure (CapEx) by leading players in the PVC additives market promotes growth by increasing production capacity to meet rising worldwide demand, notably in the construction and automotive industries. Investments in modern facilities enable the transition to eco-friendly additives (such as non-lead stabilizers), which comply with severe environmental laws. Strategic plant locations (e.g., near the Suez Canal) lower logistical costs, increasing competitiveness in emerging markets. CapEx also supports R&D for innovative additives, which improve PVC performance and sustainability. Overall, these expenditures enhance supply chains, promote innovation, and secure market leadership for key firms.
The Capital Expenditure Information by Platinum Industries Ltd. (2023-2024)
|
Location |
Details |
Capacity (per annum) |
Expected Operational Timeline |
Purpose/Strategic Benefit |
|
Palghar, Maharashtra |
Existing facility (PVC stabilizers, CPVC additives, lubricants) |
36,000 tons |
Already operational |
Current production base |
|
Egypt (New) |
New manufacturing facility |
30,000 tons |
Q2 FY2025-26 |
Meet demand in the Middle East & North Africa; leverage the Suez Canal for cost-efficient logistics |
|
Palghar, Maharashtra |
New unit for non-lead-based stabilizers (modernization & expansion) |
60,000 MTPA |
Q4 FY2024-25 |
Expand capacity for eco-friendly stabilizers and enhance production capabilities |
Challenges
-
Volatility in raw material prices: The reliance on petrochemical-based raw materials such as plasticizers, stabilizers, and lubricants severely limits the recently emerging additive manufacturing market for PVC. Beyond this pressure on availability and price, supply shocks resulting from geopolitical volatility (e.g., the Russia-Ukraine conflict) further complicate the situation. All of this volatility in price stability presents significant challenges to a manufacturer’s profitability and creates uncertainty in pricing for end-users, which discourages the adoption and utilization of additively manufactured PVC in cost-sensitive verticals such as packaging, construction, and consumer goods.
-
Shift toward bio-based and sustainable alternatives: Environmental and health pressures have intensified to replace traditional PVC additives with sustainable, bio-based alternatives. The challenge is that many of these replacements may be more expensive than their traditional counterparts, or they are more complicated and less easy to process. The effort to replace existing traditional additives limits the growth of traditional additive markets and could produce significant pressures on re-engineering topical formulations.
PVC Additives Market Size and Forecast:
| Report Attribute | Details |
|---|---|
|
Base Year |
2025 |
|
Forecast Year |
2026-2035 |
|
CAGR |
6.1% |
|
Base Year Market Size (2025) |
USD 7.21 billion |
|
Forecast Year Market Size (2035) |
USD 12.89 billion |
|
Regional Scope |
|
PVC Additives Market Segmentation:
Fabrication Process Segment Analysis
The extrusion segment is predicted to gain the largest market share of 41.6% during the projected period by 2035, due to low processing costs and the ability to provide continuous and uniform PVC products (for example, profiles, films, and cables). The U.S. Department of Energy (DOE) is facilitating innovations to extrusion processing methods under its Advanced Manufacturing Office (AMO) to relate to PVC processing industries and help with energy-saving processing techniques for all of the plastic working industries; thereby, helping to solve the operating costs of low-cost extrusion-based manufacturers looking to operate at a profit. Thus, these efforts deliver positive outcomes to the mass-manufacturing economy.
Application Segment Analysis
The pipes & fittings segment is anticipated to constitute the most significant growth by 2035, with 39.9% market share, mainly due to urbanization, water infrastructure improvements, and the growing market for corrosion-resistant piping. The U.S. Geological Survey (USGS) estimated that the demand for reliable water distribution networks and upgrades of municipal wastewater treatment will continue to create demand for PVC pipe systems. As this happens, there is an increased demand for additives in order to enhance impact resistance, UV stability, and chemical performance.
Type Segment Analysis
The plasticizers segment is anticipated to constitute the most significant growth by 2035, with 35.6% market share, mainly as referred to as traditional plasticizers and bio-based/sustainable plasticizers moving forward. The plasticizers segment represents the largest volume of PVC additives and is an essential component for increasing the flexibility and workability of PVC products, especially within construction and infrastructure applications. Emerging regulations, such as those imposed by the U. S. Environmental Protection Agency (EPA) in the United States, suggest that the demand for safer plasticizers, and sustainable, bio-based plasticizers (for example, epoxidized soybean oil) has increased, subsequently drawing attention to high-profile regulatory bans of phthalates from children's toys/medical devices/food contact. Additionally, other plasticizers have qualified for the Safer Choice Program as newer plastics that have made a list of the EPA Safer Chemicals Ingredients list are gaining momentum for adoption.
Our in-depth analysis of the global PVC additives market includes the following segments:
|
Segment |
Subsegments |
|
Fabrication Process |
|
|
Type |
|
|
Application |
|

Vishnu Nair
Head - Global Business DevelopmentCustomize this report to your requirements — connect with our consultant for personalized insights and options.
PVC Additives Market - Regional Analysis
Asia Pacific Market Insights
By 2035, the Asia Pacific market is expected to hold 37.5% of the market share due to supportive infrastructure build-out, rapid industrialization, and automotive volume. Investment in fundamental needs, such as water supply and sanitation networks, along with urban renewal, are contributing to the increasing consumption of PVC pipes and fittings that are enhanced with stabilizers and plasticizers, while the increase of vehicle assembly plants gives rise to further demand for the use of impact modifiers and processing aids in interior trims, wiring harnesses and non-body exterior components. China and India will serve as the two pillars, where industrial-scale and construction pipelines will continue to enhance the uptake of additives.
China will dominate demand for PVC additives in the region for the period 2025 - 2035, as it continues strategically expanding its national infrastructure development and production of vehicles. The steady build-out of massive corridor transports, renewable energy storage facilities, and urban housing projects continues on the back of the stimulus funded by national policy initiatives. Likewise, China’s position as the world’s largest producer of automobiles will continue to expand, coupled with an increasing interest in spending capital to produce EVs and their components, which is spurring demand for flame-retardant and UV-resistant PVC additives.
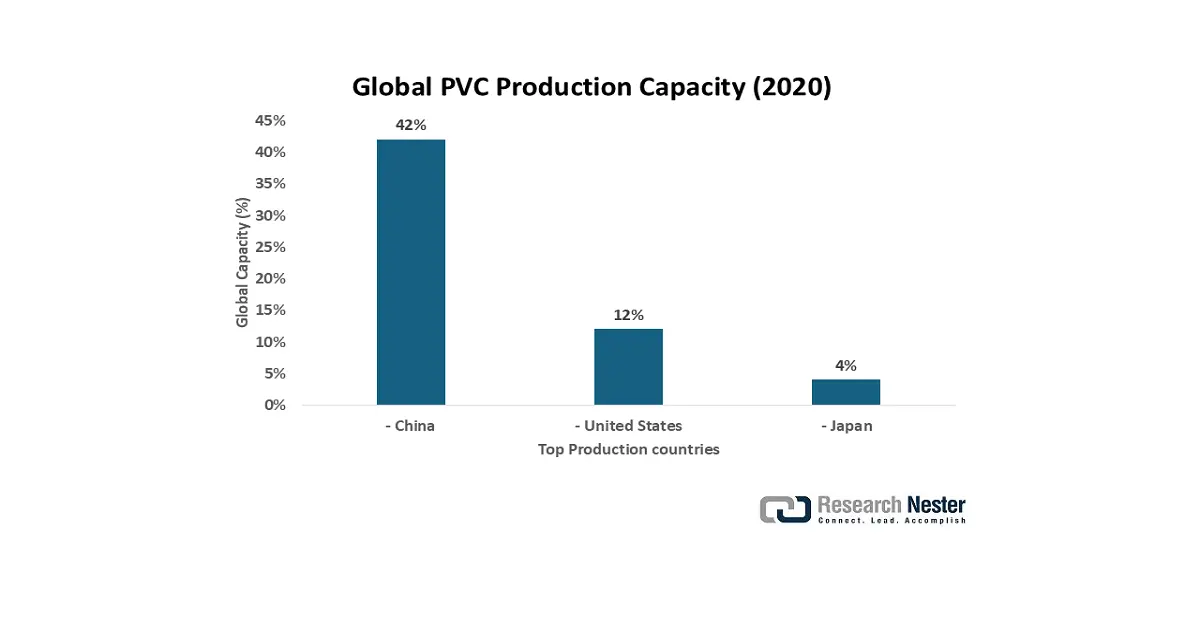
Both segments, demand for construction of pipelines, cables, and frameworks, along with interior packages and wiring produced for the automotive markets, will confirm China’s first in demand for stabilizers, plasticizers, and lubricants in the production of PVCs. Further, in 2020, the yearly PVC production capacity was 3.44 million tons, 3.24 million tons, and 3.299 million tons, respectively. Secondly, companies with a manufacturing capacity of more than 2 million tons. China's entire manufacturing capacity is an additional 25 million tons, with an output of 21 million tons in 2020. More than 70 PVC producers operate in China, with 80% using the calcium carbide process and 20% using the ethylene method.
North America Market Insights
The North American market is expected to hold 24.3% of the market share due to regulatory limitations on CO2 emissions, growing investment in infrastructure, and increasing demand for lightweight, durable materials across sectors. The PVC additives market stands to benefit from surging demand in the construction sector, as well as increased demand in the automotive and packaging markets. Investment in green buildings and smart infrastructure is prompting designs that adopt non-toxic and bio-based PVC stabilizers and plasticizers. Coupled with the increased manufacturing capabilities as well as advancements into recycled material, the green movement towards monitoring and improving product sustainability and product performance from the perspective of manufacturing has, and will continue to, have a positive impact on additive markets. Coordinating partnerships that can minimize one's environmental impact should inspire additive manufacturers to articulate innovations throughout the value chain in their respective additive formulations.
In the U.S., the PVC additives market is going to be favored by the substantial amount of investment in infrastructure, both commercial and residential, which is continuing to be prioritized under the Infrastructure Investment and Jobs Act. The federal government is pushing forward with sustainable, non-phthalate plasticizers as well as lead-free stabilizers, which will continue to influence R&D priorities among domestic producers. In particular, rising demand from the electrical sector alongside the automotive light-weighting trends will provide positive short-term growth opportunities. Continued increasing imports of PVC resin, coupled with heightened home improvement activity, will also be positive for the PVC pourable market. The U.S. EPA continues to influence developments in the science behind green chemistry and bio-based additive solutions, which are driving domestic innovation.
Europe Market Insights
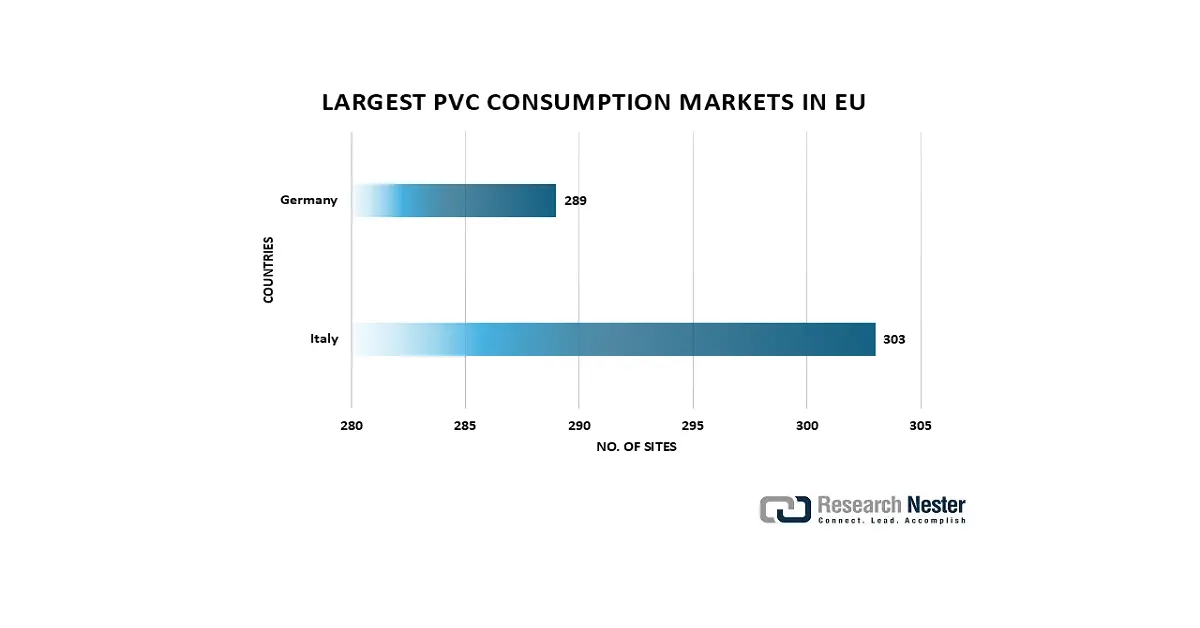
The European market is expected to hold 21.6% of the market share by 2034, reflecting a CAGR of approximately 3.8% over the forecast period. Demand is primarily driven by the construction (pipes, profiles), packaging, and infrastructure-related applications. Regulatory actions, such as promoting calcium‑zinc stabilizers via REACH, are also having an impact. PVC consumption in Europe exceeds 6 million tons per year. Pipes and fittings, window and door profiles, cables, waterproof membranes, and flooring account for approximately 60% of all PVC use in buildings and infrastructure.
Key PVC Additives Market Players:
- BASF SE
- Company Overview
- Business Strategy
- Key Product Offerings
- Financial Performance
- Key Performance Indicators
- Risk Analysis
- Recent Development
- Regional Presence
- SWOT Analysis
- Dow Chemical Company
- Clariant AG
- Arkema SA
- Lanxess AG
- Songwon Industrial Co., Ltd.
- Baerlocher GmbH
- Adeka Corporation
- Akzo Nobel N.V.
- PMC Group
- Nouryon
- Galata Chemicals
- Vinati Organics Ltd.
- PT Timah Industri
- Chemson Group
The market for PVC additives is competitive with major players such as BASF, Dow, and Clariant dominating the market with capacity, supply chains, and on-going R&D. European and American manufacturers still drive innovation in additive technology and have a focus on sustainable and eco-friendly additives in-line with regulation. The Asian manufacturers, also finding success, such as Songwon (South Korea) and Vinati Organics (India), leverage their low-cost production advantages and strategic partners in the region. The aforementioned manufacturers are involved in strategic initiatives such as mergers, acquisitions, and product line diversification to expand into emerging markets. Sustainability, via environmental initiatives to not rely upon toxic stabilizers, bio-based plasticizers, etc., remains a paramount consideration as the industry focuses on critical advancements in manufacturing technology.
Some of the key players operating in the market are listed below:
Recent Developments
- In January 2024, Baerlocher USA launched a PFAS-free polymer processing aid for blown film, pipe, and wire and cable production, along with a new formulation free of per- and polyfluoroalkyl substances as well as siloxanes, consistent with new, stricter environmental, governance, and sociability surrounding manufactured products. The company also launched a bio-based plasticizer to support the sustainable processing of PVC. Baerlocher's new sustainable material development helps meet the growing desire for safer and non-toxic additives in the plastics industry, while also showing the prioritization of regulatory compliance implicitly as an advocacy approach to different forms of sustainability and business innovation aligned to these green obligations.
- In September 2023, BASF launched its first set of biomass-balance additives in its portfolio of plastic additives, using a certified mass-balance approach that utilizes renewable raw materials instead of fossil feedstocks. Such an innovation will help meet the increasing demand for sustainable materials globally while enabling manufacturers to comply with ever-rigorous environmental governance. It adds to BASF's continued efforts to be a leader in sustainable chemical solutions while emphasizing the value of circularity associated with PVC applications, providing services to customers to lower their carbon footprints without having to change their current manufacturing processes or overall product performance.
- Report ID: 7968
- Published Date: Aug 13, 2025
- Report Format: PDF, PPT
- Explore a preview of key market trends and insights
- Review sample data tables and segment breakdowns
- Experience the quality of our visual data representations
- Evaluate our report structure and research methodology
- Get a glimpse of competitive landscape analysis
- Understand how regional forecasts are presented
- Assess the depth of company profiling and benchmarking
- Preview how actionable insights can support your strategy
Explore real data and analysis
Frequently Asked Questions (FAQ)
PVC Additives Market Report Scope
Free Sample includes current and historical market size, growth trends, regional charts & tables, company profiles, segment-wise forecasts, and more.
Connect with our Expert


Copyright @ 2026 Research Nester. All Rights Reserved.
