Photonic Crystal Displays Market Outlook:
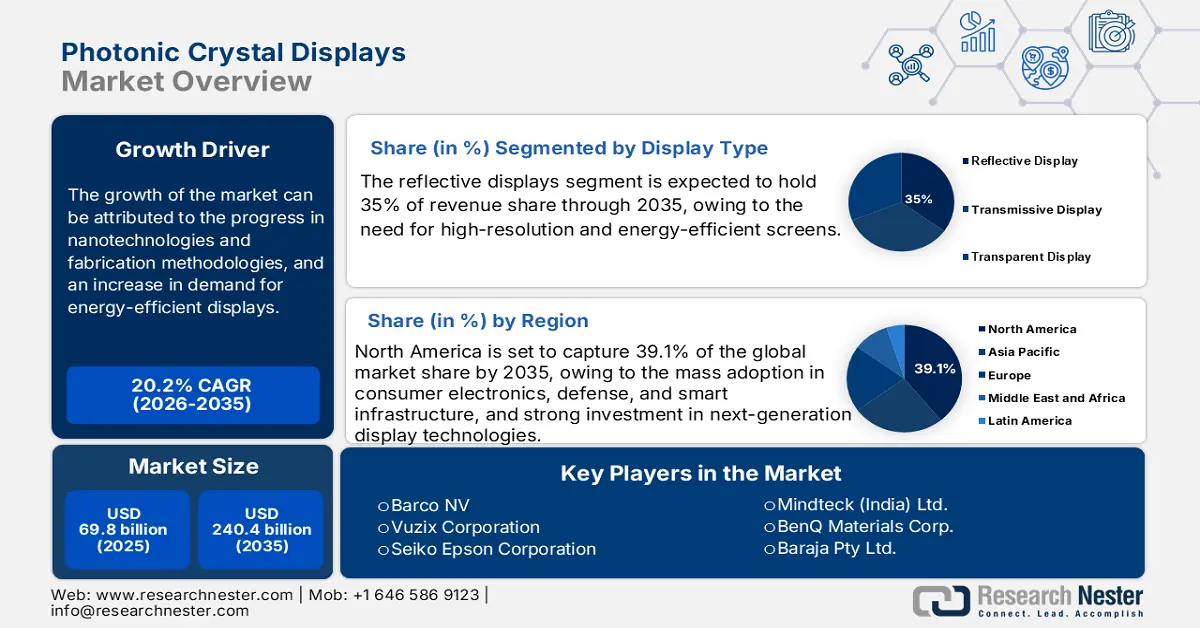
Photonic Crystal Displays Market size was valued at USD 69.8 billion in 2025 and is projected to reach around USD 240.4 billion by the end of 2035, rising at a CAGR of 20.2% during the forecast period 2026-2035. In 2026, the industry size of photonic crystal displays is assessed at USD 75 billion.
The photonic crystal displays market growth is susceptible to disruptions in the supply chain as it is complex and highly interconnected. The supply chain is reliant on the procurement of raw materials such as quartz and various other rare earth metals from numerous countries. Factors such as geopolitical tensions and regulations associated with the import and export are directly affecting the availability and pricing of the material. The delays in the semiconductor-grade material procurement remarkably impact the timeline of the production. Companies are exploring alternative materials and recycling strategies to eradicate the risk and ensure a steady supply.
Research and development also play a pivotal role in fostering the competitiveness of the photonic crystal displays market. Academic institutions and display manufacturers are investing heavily in finding out the latest type of photonic crystal structures with advanced fabrication techniques. Also, there has been much work done in integrating PCDs with next-generation display technologies such as quantum dot systems. Both private and government organizations are funding the commercialization of the prototype into defense applications and large-scale consumer electronics. Future research and development include sustainability efforts such as recycling rare earth elements and lowering the consumption of energy during production.
Key Photonic Crystal Displays Market Insights Summary:
Regional Highlights:
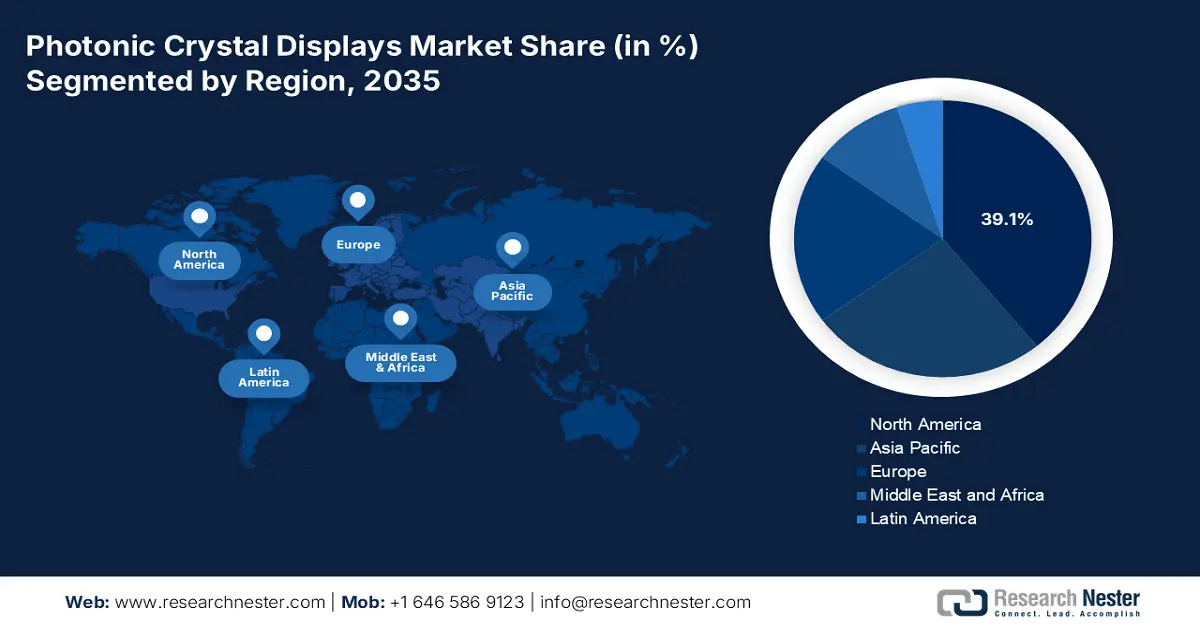
- By 2035, North America is projected to secure a 39.1% share of the Photonic Crystal Displays Market, supported by mass adoption in consumer electronics, defense, and smart infrastructure.
- Europe is anticipated to command a substantial share by 2035, underpinned by rising funding in photonics and advanced display technologies.
Segment Insights:
- By 2035, the consumer electronics segment of the Photonic Crystal Displays Market is poised to hold a dominant 40% share, underlined by the need for high-resolution and energy-efficient screens.
- The reflective displays segment is projected to capture a 35% share by 2035, sustained by the advantages of ambient-light-based, low-energy screen operation.
Key Growth Trends:
- Progress in nanotechnology and fabrication methodologies
- Surge in demand for the energy-efficient displays
Major Challenges:
- Data protection regulations and infrastructure capabilities
- Exorbitant production costs and pricing pressures
Key Players: Samsung Display Co., Ltd., LG Display Co., Ltd., Sony Corporation, Apple Inc., BOE Technology Group Co., Ltd., Intel Corporation, Panasonic Holdings Corporation, AU Optronics Corp., CSOT (China Star Optoelectronics Tech), Barco NV, Vuzix Corporation, Seiko Epson Corporation, Mindteck (India) Ltd., BenQ Materials Corp., Baraja Pty Ltd.
Global Photonic Crystal Displays Market Forecast and Regional Outlook:
Market Size & Growth Projections:
- 2025 Market Size: USD 69.8 billion
- 2026 Market Size: USD 75 billion
- Projected Market Size: USD 240.4 billion by 2035
- Growth Forecasts: 20.2% CAGR (2026-2035)
Key Regional Dynamics:
- Largest Region: North America (39.1% Share by 2035)
- Fastest Growing Region: Europe
- Dominating Countries: United States, China, Japan, Germany, South Korea
- Emerging Countries: India, Singapore, Taiwan, United Kingdom, France
Last updated on : 22 October, 2025
Photonic Crystal Displays Market - Growth Drivers and Challenges
Growth Drivers
- Progress in nanotechnology and fabrication methodologies: Developments in both nanostructure fabrication and existing fabrication technologies are improving color fidelity, improving contrast ratios, and providing better scalability for PCDs. The new use cases may improve consumer electronics, enhance augmented reality (AR) and virtual reality (VR) case scenarios, and enable new use cases. According to the National Nanotechnology Initiative in 2022, the economic impact of nanotechnology on the economy of the US was between USD 67 billion and USD 83 billion. The advancement in the nano-fabrication technique, such as nanoimprint lithography, enables the creation of extremely uniform photonic crystal patterns. These factors are augmenting the growth of the photonic crystal displays market in the coming period.
- Surge in demand for the energy-efficient displays: PCDs have a low power requirement and high reflectivity, which aligns with global sustainability aspirations. There has been a surge in the quest to lower the carbon footprint, which is propelling the demand for display technologies that consume less power. PCDs are designed to reflect ambient light effectively, providing high-contrast visuals. Governments are imposing strict energy-efficient regulations, and consumers are prioritizing to purchase of sustainable products. For instance, data published by the University of Oxford in April 2022 indicates that a staff desktop and screen used constantly for 8 hours emits GHG equivalent to 70g of carbon dioxide generated from electricity consumption. However, the inclusion of the PCDs can reduce display energy consumption and align with sustainability initiatives.
- Rising demand in automotive displays and aviation systems: PCDs are extensively used in specialized industries such as aviation and automotive. Modern vehicles include infotainment systems and heads-up displays that need high visibility under different lighting conditions. The widespread adoption of the Internet of Things devices in the automotive sector is also adding to the demand for energy-efficient display components. According to the World Economic Forum, by the end of 2022, there were more than 125 million passenger cars with embedded connectivity in the world. Additionally, in aviation cockpits are incorporating ultra-modern digital dashboards and passenger entertainment systems that are capable of functioning even in extreme conditions. Also, the number of people flying is rising; subsequently, there has been an increased demand to enhance the passenger experience with the help of in-flight entertainment systems.
Number of Passengers (Global, Scheduled Services)
|
Year |
Number of Passengers (in billions) |
|
2016 |
3.7 |
|
2017 |
4.1 |
|
2018 |
4.3 |
|
2019 |
4.5 |
|
2020 |
1.8 (pandemic low) |
|
2021 |
2.3 |
|
2022 |
3.3 |
|
2023 |
4.3 |
Source: ICAO
Challenges
- Data protection regulations and infrastructure capabilities: Strict data protection laws and the development of new data protection laws may delay product launches. It was noted that in 2022, new data protection statutes in India delayed the launch of the product for more than 4 months. Low infrastructure availability in certain jurisdictions can impede the adoption of the PCD solutions.
- Exorbitant production costs and pricing pressures: The complexity of manufacturing photonic crystal-based components may increase costs. Photonic crystals require special equipment and expertise, resulting in high prices. This could potentially hinder overall growth in the photonic crystal displays market.
Photonic Crystal Displays Market Size and Forecast:
| Report Attribute | Details |
|---|---|
|
Base Year |
2025 |
|
Forecast Year |
2026-2035 |
|
CAGR |
20.2% |
|
Base Year Market Size (2025) |
USD 69.8 billion |
|
Forecast Year Market Size (2035) |
USD 240.4 billion |
|
Regional Scope |
|
Photonic Crystal Displays Market Segmentation:
Application Segment Analysis
The consumer electronics segment of the photonic crystal displays market is projected to hold a dominant 40% revenue share by the end of 2035. The growth is driven by the need for high-resolution and energy-efficient screens. PCDs are also visible under sunlight, allowing for superior operability for mobile device users. Additionally, the emergence of new displays that are ultra-thin, flexible, and lightweight is supporting this market as well. In addition, the undeviating growth of 5G and Internet of Things (IoT) technologies is permitting an increase in connected-device proliferation and advanced display components like PCDs. Along with key developments in photonic materials and nanofabrication processes that have ensured this computability. Finally, support from government and private investments in research and development with regard to nanophotonics and associated display technologies has provided a further avenue of growth for the industry.
Display Type Segment Analysis
The reflective displays segment is poised to account for a major revenue share of 35% in the photonic crystal displays market. The reflective PCD display is designed to allow ambient light to exhibit the image, allowing for highly efficient energy usage. These screens save energy as they use no constant internal lighting, which is particularly valuable for portable and battery-powered devices. These displays have the benefits of being readable outdoors in daylight and being easy on the eyes, and are therefore useful for any devices typically used in direct sunlight. Thus, PCDs are particularly useful for outdoor applications such as digital signage, smartwatches, and e-readers. As global priorities continue to focus on environmental sustainability, low-energy reflected display technologies are becoming very popular in industries attempting to reduce carbon footprints. At the same time, as smart cities are developed, the adoption of reflective PCDs for applications of smart signage technology and public information technology has increased.
Material Type Segment Analysis
The III-V (GaN, InGaN) and compound semiconductors are anticipated to hold the largest photonic crystal displays market share. The growth of the market can be attributed to the widespread usage of the LED-based displays, which showcase the largest application for the PCD technology. These semiconductors render significant light emission efficiency and excellent reliability, making them an ideal choice for integrating photonic-crystal structures. The adoption of GaN-based semiconductors is also fueled by the rising demand for displays with high brightness. Also, in comparison with the other materials, III-V semiconductors dominate the photonic crystal displays market due to their critical role in high-performance LED emitters, which are the primary drivers of PCD revenue.
Our in-depth analysis of the photonic crystal displays market includes the following segments:
|
Segment |
Subsegments |
|
Material Type |
|
|
Crystal Type |
|
|
Technology |
|
|
Device Type |
|
|
Application |
|
|
End user |
|
|
Material Type |
|
|
Manufacturing |
|
|
Display Type |
|

Vishnu Nair
Head - Global Business DevelopmentCustomize this report to your requirements — connect with our consultant for personalized insights and options.
Photonic Crystal Displays Market - Regional Analysis
North America Market Insights
The North America photonic crystal displays market is projected to account for a leading share of 39.1% by the end of 2035. The growth is fueled by mass adoption in consumer electronics, defense, and smart infrastructure. Strong investment in national digital equity efforts and next-generation display technologies encourages demand in this area. The U.S. photonic crystal displays market is expected to expand considerably. This increase in market size in-depth support coming from federal budget targeting broadband and display projects. There are also widespread smart city activities in California & Texas where PCDs are born into signage, traffic technology, and energy monitoring technology. The convergence of increased energy and material efficiency via the screens found in standardized consumer applications is compelling local area tech firms to pursue experimentation and deployment of PCDs. The U.S. offers unique benefits such as R&D tax credits mandated by the Department of Energy, focusing on supporting government partnerships that encourage the use of low-power, low-cost display material innovation.
The photonic crystal displays market in Canada is also predicted to garner remarkable growth owing to advancements in photonic crystal technology and rising demand for high-performance displays. The current ecosystem of semiconductor and display fabrication facilities in the region could further support local production. According to the National Research Council of Canada in 2021, the government of Canada declared an investment of USD 90 million in the Canadian Photonics Fabrication Center. The investment aims to fuel the country’s capabilities in semiconductor and photonics technologies.
Europe Market Insights
The photonic crystal displays market in Europe is growing at a staggering rate owing to rising funding in photonics and advanced display technologies. For example, in March 2025, under the PhotonHub PHACTORY, USD 17.7 million was offered to support Europe’s leading laboratories. The region has robust energy efficiency mandates, such as Ecodesign rules and various climate targets that compel the device makers to reduce power consumption and carbon emissions. In November 2021, the UK Photonics Vision for 2035 was launched, predicting a USD 68 billion industry. The vision in the country focuses on photonics technology, essential for various sectors. Additionally, the government is also focusing on developing GaN-based blue lasers, which is also propelling the market growth in the coming period.
The photonic crystal displays market in Germany is also thriving due to the presence of an advanced manufacturing industry and innovation in the automotive and mobility sectors. The government is pushing towards “Digitalization of Industry”, which involves integrating optical systems and machine vision in the manufacturing environment. Also, the country’s established automotive sector is adopting modern technologies for infotainment and other purposes. According to Germany Trade and Invest, the country reports for more than 40% of the European photonics market output. Companies are integrating PCDs and exporting advanced displays.
Asia Pacific Market Insights
The APAC region is set for robust growth, fueled by the presence of established electronics and display manufacturing. There has been a rising demand for consumer electronics in the region, which is fostering the uptake of energy-efficient PCD technology. Also, the strong government incentives and R&D support are further propelling innovation. Additionally, the region’s focus on sustainability aligns with the PCD usage, making them attractive for both consumer and industrial use. Other than this, China is already the largest established base for the manufacturing of display panels. There has been an increased demand for high-brightness and foldable displays that are pushing manufacturers to combine many technologies.
In India, the photonic crystal displays market is set to thrive with the extensive government support and rising electronics hardware production. For instance, according to the Press Information Bureau in July 2024, the 'Modified Scheme for setting up of Display Fabs in India' strives to render fiscal support of 50% of the cost of the project. These factors are augmenting the market growth in the country. Additionally, the country is promoting local innovation in photonic crystals and promoting better fabrication methods. Foreign partnerships are also acting as a catalyst for photonic crystal displays market growth.
Key Photonic Crystal Displays Market Players:
- Samsung Display Co., Ltd.
- Company Overview
- Business Strategy
- Key Product Offerings
- Financial Performance
- Key Performance Indicators
- Risk Analysis
- Recent Development
- Regional Presence
- SWOT Analysis
- LG Display Co., Ltd.
- Sony Corporation
- Apple Inc.
- BOE Technology Group Co., Ltd.
- Intel Corporation
- Panasonic Holdings Corporation
- AU Optronics Corp.
- CSOT (China Star Optoelectronics Tech)
- Barco NV
- Vuzix Corporation
- Seiko Epson Corporation
- Mindteck (India) Ltd.
- BenQ Materials Corp.
- Baraja Pty Ltd.
The photonic crystal displays market is characterized by strong competition and innovation. The major industry players invest significant amounts in research and development to improve the brightness, energy efficiency, and scalability of PCDs. New entrants are emerging with the aid of regional government incentives to make an impact in photonics manufacturing in India and Malaysia. Companies such as Barco and Baraja are making their niche in PCD end-use applications such as automotive and defense. Partnerships, acquisitions of specific interests in patents, and production are likely to continue emerging and impact competition within the PCD industry on a global basis.
Here is a list of key players operating in the global market:
Recent Developments
- In May 2025, Samsung launched Vision AI to deliver personalized and AI-powered screens to enrich everyday life and cater to rising demand. The goal is to make screens not just passive display devices but more adaptive, intelligent, and personalized, integrating TV/display into a broader smart home / AI ecosystem.
- In January 2025, LG Display unveiled a fourth-generation OLED TV panel that is 33% brighter than the previous generation and optimized for the AI TV era. It is the industry’s first-ever OLED display to achieve a maximum brightness as high as 4,000 nits.
- Report ID: 725
- Published Date: Oct 22, 2025
- Report Format: PDF, PPT
- Explore a preview of key market trends and insights
- Review sample data tables and segment breakdowns
- Experience the quality of our visual data representations
- Evaluate our report structure and research methodology
- Get a glimpse of competitive landscape analysis
- Understand how regional forecasts are presented
- Assess the depth of company profiling and benchmarking
- Preview how actionable insights can support your strategy
Explore real data and analysis
Frequently Asked Questions (FAQ)
About this Report
Connect with our Expert

Report, 2026-2035


Copyright @ 2026 Research Nester. All Rights Reserved.
