Global Electronic Paper Display Market
- An Outline of the Global Electronic Paper Display Market
- Market Definition and Segmentation
- Study Assumptions and Abbreviations
- Research Methodology & Approach
- Primary Research
- Secondary Research
- Data Triangulation
- SPSS Methodology
- Executive Summary
- Growth Drivers
- Major Roadblocks
- Opportunities
- Prevalent Trends
- Government Regulation
- Growth Outlook
- Competitive White Space Analysis – Identifying Untapped Market Gaps
- Risk Overview
- SWOT
- Technological Advancement
- Technology Maturity Matrix for Electronic Paper Display Market Recent News
- Regional Demand
- Global Electronic Paper Display by Geography – Strategic Comparative Analysis
- Strategic Segment Analysis: Electronic Paper Display Demand Landscape
- Electronic Paper Display Demand Trends Driven by Energy Efficiency, IoT and Wearables, and Smart Infrastructure (2026-2036)
- Root Cause Analysis (RCA) for discovering problems of the Electronic Paper Display Market
- Porter Five Forces
- PESTLE
- Comparative Positioning
- Global Electronic Paper Display – Key Player Analysis (2036)
- Competitive Landscape: Key Suppliers/Players
- Competitive Model: A Detailed Inside View for Investors
- Company Market Share, 2036 (%)
- Business Profile of Key players
- Plastic Logic GmbH
- E-Ink Holdings
- Clear Ink Displays
- Pervasive Displays INC
- TOPPAN Printing Co.LTD
- Business Profile of Key players
- Global Litigation Funding Investment Market Outlook
- Market Overview
- Market Revenue by Value (USD Million), Volume (Thousand Tons), and Compound Annual Growth Rate (CAGR)
- Litigation Funding Investment Market Segmentation Analysis (2026-2036)
- By Technology
- Electrophoretic Display, Market Value (USD Million), and CAGR, 2026-2036F
- Electro Wetting Display, Market Value (USD Million), and CAGR, 2026-2036F
- Cholesteric Display, Market Value (USD Million), and CAGR, 2026-2036F
- Interferomatic Display, Market Value (USD Million), and CAGR, 2026-2036F
- Others, Market Value (USD Million), and CAGR, 2026-2036F
- By Product Form
- Flat EPDs, Market Value (USD Million), and CAGR, 2026-2036F
- Curved EPDs, Market Value (USD Million), and CAGR, 2026-2036F
- Flexible EPDs, Market Value (USD Million), and CAGR, 2026-2036F
- Foldable EPDs, Market Value (USD Million), and CAGR, 2026-2036F
- By Type
- E-Readers, Market Value (USD Million), and CAGR, 2026-2036F
- Mobile Devices, Market Value (USD Million), and CAGR, 2026-2036F
- Smart Cards, Market Value (USD Million), and CAGR, 2026-2036F
- Poster and Signage, Market Value (USD Million), and CAGR, 2026-2036F
- Auxiliary Displays, Market Value (USD Million), and CAGR, 2026-2036F
- Electronic Shelf Label, Market Value (USD Million), and CAGR, 2026-2036F
- Wearables, Market Value (USD Million), and CAGR, 2026-2036F
- By Technology
- Market Overview
- By End User
- Automotive, Market Value (USD Million), and CAGR, 2026-2036F
- Packaging and Logistics, Market Value (USD Million), and CAGR, 2026-2036F
- Consumer Electronics, Market Value (USD Million), and CAGR, 2026-2036F
- Retail, Market Value (USD Million), and CAGR, 2026-2036F
- Institutional, Market Value (USD Million), and CAGR, 2026-2036F
- Healthcare, Market Value (USD Million), and CAGR, 2026-2036F
- Media and Entertainment, Market Value (USD Million), and CAGR, 2026-2036F
- Others, Market Value (USD Million), and CAGR, 2026-2036F
- Regional Synopsis, Value (USD Million), 2026-2036
- North America Market Value (USD Million) and CAGR & Y-o-Y Growth Trend, 2026-2036F
- Europe Market Value (USD Million) and CAGR & Y-o-Y Growth Trend, 2026-2036F
- Asia Pacific Market Value (USD Million) and CAGR & Y-o-Y Growth Trend, 2026-2036F
- Latin America Market Value (USD Million) and CAGR & Y-o-Y Growth Trend, 2026-2036F
- Middle East and Africa Market Value (USD Million) and CAGR & Y-o-Y Growth Trend, 2026-2036F
- North America Market
- Overview
- Market Value (USD Million), Current and Future Projections, 2026-2036
- Increment $ Opportunity Assessment, 2026-2036
- Segmentation (USD million), 2026-2036, By
- By Technology
- Electrophoretic Display, Market Value (USD Million), and CAGR, 2026-2036F
- Electro Wetting Display, Market Value (USD Million), and CAGR, 2026-2036F
- Cholesteric Display, Market Value (USD Million), and CAGR, 2026-2036F
- Interferomatic Display, Market Value (USD Million), and CAGR, 2026-2036F
- Others, Market Value (USD Million), and CAGR, 2026-2036F
- By Product Form
- Flat EPDs, Market Value (USD Million), and CAGR, 2026-2036F
- Curved EPDs, Market Value (USD Million), and CAGR, 2026-2036F
- Flexible EPDs, Market Value (USD Million), and CAGR, 2026-2036F
- Foldable EPDs, Market Value (USD Million), and CAGR, 2026-2036F
- By Type
- E-Readers, Market Value (USD Million), and CAGR, 2026-2036F
- Mobile Devices, Market Value (USD Million), and CAGR, 2026-2036F
- Smart Cards, Market Value (USD Million), and CAGR, 2026-2036F
- Poster and Signage, Market Value (USD Million), and CAGR, 2026-2036F
- Auxiliary Displays, Market Value (USD Million), and CAGR, 2026-2036F
- Electronic Shelf Label, Market Value (USD Million), and CAGR, 2026-2036F
- Wearables, Market Value (USD Million), and CAGR, 2026-2036F
- By Technology
- Overview
- By End User
- Automotive, Market Value (USD Million), and CAGR, 2026-2036F
- Packaging and Logistics, Market Value (USD Million), and CAGR, 2026-2036F
- Consumer Electronics, Market Value (USD Million), and CAGR, 2026-2036F
- Retail, Market Value (USD Million), and CAGR, 2026-2036F
- Institutional, Market Value (USD Million), and CAGR, 2026-2036F
- Healthcare, Market Value (USD Million), and CAGR, 2026-2036F
- Media and Entertainment, Market Value (USD Million), and CAGR, 2026-2036F
- Others, Market Value (USD Million), and CAGR, 2026-2036F
- Country Level Analysis, Value (USD Million)
- U.S. Market Value (USD Million) and CAGR & Y-o-Y Growth Trend, 2026-2036F
- Canada Market Value (USD Million) and CAGR & Y-o-Y Growth Trend, 2026-2036F
- Europe Market
- Overview
- Market Value (USD Million), Current and Future Projections, 2026-2036
- Increment $ Opportunity Assessment, 2026-2036
- Segmentation (USD million), 2026-2036, By
- By Technology
- Electrophoretic Display, Market Value (USD Million), and CAGR, 2026-2036F
- Electro Wetting Display, Market Value (USD Million), and CAGR, 2026-2036F
- Cholesteric Display, Market Value (USD Million), and CAGR, 2026-2036F
- Interferomatic Display, Market Value (USD Million), and CAGR, 2026-2036F
- Others, Market Value (USD Million), and CAGR, 2026-2036F
- By Product Form
- Flat EPDs, Market Value (USD Million), and CAGR, 2026-2036F
- Curved EPDs, Market Value (USD Million), and CAGR, 2026-2036F
- Flexible EPDs, Market Value (USD Million), and CAGR, 2026-2036F
- Foldable EPDs, Market Value (USD Million), and CAGR, 2026-2036F
- By Type
- E-Readers, Market Value (USD Million), and CAGR, 2026-2036F
- Mobile Devices, Market Value (USD Million), and CAGR, 2026-2036F
- Smart Cards, Market Value (USD Million), and CAGR, 2026-2036F
- Poster and Signage, Market Value (USD Million), and CAGR, 2026-2036F
- Auxiliary Displays, Market Value (USD Million), and CAGR, 2026-2036F
- Electronic Shelf Label, Market Value (USD Million), and CAGR, 2026-2036F
- Wearables, Market Value (USD Million), and CAGR, 2026-2036F
- By Technology
- Overview
- By End User
- Automotive, Market Value (USD Million), and CAGR, 2026-2036F
- Packaging and Logistics, Market Value (USD Million), and CAGR, 2026-2036F
- Consumer Electronics, Market Value (USD Million), and CAGR, 2026-2036F
- Retail, Market Value (USD Million), and CAGR, 2026-2036F
- Institutional, Market Value (USD Million), and CAGR, 2026-2036F
- Healthcare, Market Value (USD Million), and CAGR, 2026-2036F
- Media and Entertainment, Market Value (USD Million), and CAGR, 2026-2036F
- Others, Market Value (USD Million), and CAGR, 2026-2036F
- Country Level Analysis, Value (USD Million)
- France Market Value (USD Million) and CAGR & Y-o-Y Growth Trend, 2026-2036F
- Italy Market Value (USD Million) and CAGR & Y-o-Y Growth Trend, 2026-2036F
- Spain Market Value (USD Million) and CAGR & Y-o-Y Growth Trend, 2026-2036F
- Netherlands Market Value (USD Million) and CAGR & Y-o-Y Growth Trend, 2026-2036F
- Russia Market Value (USD Million) and CAGR & Y-o-Y Growth Trend, 2026-2036F
- Switzerland Market Value (USD Million) and CAGR & Y-o-Y Growth Trend, 2026-2036F
- Poland Market Value (USD Million) and CAGR & Y-o-Y Growth Trend, 2026-2036F
- Belgium Market Value (USD Million) and CAGR & Y-o-Y Growth Trend, 2026-2036F
- Rest of Europe Market Value (USD Million) and CAGR & Y-o-Y Growth Trend, 2026-2036F
- Asia Pacific Excluding Japan Market
- Overview
- Market Value (USD Million), Current and Future Projections, 2026-2036
- Increment $ Opportunity Assessment, 2026-2036
- Segmentation (USD million), 2026-2036, By
- By Technology
- Electrophoretic Display, Market Value (USD Million), and CAGR, 2026-2036F
- Electro Wetting Display, Market Value (USD Million), and CAGR, 2026-2036F
- Cholesteric Display, Market Value (USD Million), and CAGR, 2026-2036F
- Interferomatic Display, Market Value (USD Million), and CAGR, 2026-2036F
- Others, Market Value (USD Million), and CAGR, 2026-2036F
- By Product Form
- Flat EPDs, Market Value (USD Million), and CAGR, 2026-2036F
- Curved EPDs, Market Value (USD Million), and CAGR, 2026-2036F
- Flexible EPDs, Market Value (USD Million), and CAGR, 2026-2036F
- Foldable EPDs, Market Value (USD Million), and CAGR, 2026-2036F
- By Type
- E-Readers, Market Value (USD Million), and CAGR, 2026-2036F
- Mobile Devices, Market Value (USD Million), and CAGR, 2026-2036F
- Smart Cards, Market Value (USD Million), and CAGR, 2026-2036F
- Poster and Signage, Market Value (USD Million), and CAGR, 2026-2036F
- Auxiliary Displays, Market Value (USD Million), and CAGR, 2026-2036F
- Electronic Shelf Label, Market Value (USD Million), and CAGR, 2026-2036F
- Wearables, Market Value (USD Million), and CAGR, 2026-2036F
- By Technology
- Overview
- By End User
- Automotive, Market Value (USD Million), and CAGR, 2026-2036F
- Packaging and Logistics, Market Value (USD Million), and CAGR, 2026-2036F
- Consumer Electronics, Market Value (USD Million), and CAGR, 2026-2036F
- Retail, Market Value (USD Million), and CAGR, 2026-2036F
- Institutional, Market Value (USD Million), and CAGR, 2026-2036F
- Healthcare, Market Value (USD Million), and CAGR, 2026-2036F
- Media and Entertainment, Market Value (USD Million), and CAGR, 2026-2036F
- Others, Market Value (USD Million), and CAGR, 2026-2036F
- Country Level Analysis, Value (USD Million)
- China Market Value (USD Million) and CAGR & Y-o-Y Growth Trend, 2026-2036F
- India Market Value (USD Million) and CAGR & Y-o-Y Growth Trend, 2026-2036F
- South Korea Market Value (USD Million) and CAGR & Y-o-Y Growth Trend, 2026-2036F
- Australia Market Value (USD Million) and CAGR & Y-o-Y Growth Trend, 2026-2036F
- Indonesia Market Value (USD Million) and CAGR & Y-o-Y Growth Trend, 2026-2036F
- Malaysia Market Value (USD Million) and CAGR & Y-o-Y Growth Trend, 2026-2036F
- Vietnam Market Value (USD Million) and CAGR & Y-o-Y Growth Trend, 2026-2036F
- Thailand Market Value (USD Million) and CAGR & Y-o-Y Growth Trend, 2026-2036F
- Singapore Market Value (USD Million) and CAGR & Y-o-Y Growth Trend, 2026-2036F
- New Zealand Market Value (USD Million) and CAGR & Y-o-Y Growth Trend, 2026-2036F
- Rest of Asia Pacific Excluding Japan Market Value (USD Million) and CAGR & Y-o-Y Growth Trend, 2026-2036F
- Japan Market
- Overview
- Market Value (USD Million), Current and Future Projections, 2026-2036
- Increment $ Opportunity Assessment, 2026-2036
- Segmentation (USD million), 2026-2036, By
- By Technology
- Electrophoretic Display, Market Value (USD Million), and CAGR, 2026-2036F
- Electro Wetting Display, Market Value (USD Million), and CAGR, 2026-2036F
- Cholesteric Display, Market Value (USD Million), and CAGR, 2026-2036F
- Interferomatic Display, Market Value (USD Million), and CAGR, 2026-2036F
- Others, Market Value (USD Million), and CAGR, 2026-2036F
- By Product Form
- Flat EPDs, Market Value (USD Million), and CAGR, 2026-2036F
- Curved EPDs, Market Value (USD Million), and CAGR, 2026-2036F
- Flexible EPDs, Market Value (USD Million), and CAGR, 2026-2036F
- Foldable EPDs, Market Value (USD Million), and CAGR, 2026-2036F
- By Type
- E-Readers, Market Value (USD Million), and CAGR, 2026-2036F
- Mobile Devices, Market Value (USD Million), and CAGR, 2026-2036F
- Smart Cards, Market Value (USD Million), and CAGR, 2026-2036F
- Poster and Signage, Market Value (USD Million), and CAGR, 2026-2036F
- Auxiliary Displays, Market Value (USD Million), and CAGR, 2026-2036F
- Electronic Shelf Label, Market Value (USD Million), and CAGR, 2026-2036F
- Wearables, Market Value (USD Million), and CAGR, 2026-2036F
- By Technology
- Overview
- By End User
- Automotive, Market Value (USD Million), and CAGR, 2026-2036F
- Packaging and Logistics, Market Value (USD Million), and CAGR, 2026-2036F
- Consumer Electronics, Market Value (USD Million), and CAGR, 2026-2036F
- Retail, Market Value (USD Million), and CAGR, 2026-2036F
- Institutional, Market Value (USD Million), and CAGR, 2026-2036F
- Healthcare, Market Value (USD Million), and CAGR, 2026-2036F
- Media and Entertainment, Market Value (USD Million), and CAGR, 2026-2036F
- Others, Market Value (USD Million), and CAGR, 2026-2036F
- Latin America Market
- Overview
- Market Value (USD Million), Current and Future Projections, 2026-2036
- Increment $ Opportunity Assessment, 2026-2036
- Year-on-Year Growth Forecast (%)
- Segmentation (USD million), 2026-2036, By
- By Technology
- Electrophoretic Display, Market Value (USD Million), and CAGR, 2026-2036F
- Electro Wetting Display, Market Value (USD Million), and CAGR, 2026-2036F
- Cholesteric Display, Market Value (USD Million), and CAGR, 2026-2036F
- Interferomatic Display, Market Value (USD Million), and CAGR, 2026-2036F
- Others, Market Value (USD Million), and CAGR, 2026-2036F
- By Product Form
- Flat EPDs, Market Value (USD Million), and CAGR, 2026-2036F
- Curved EPDs, Market Value (USD Million), and CAGR, 2026-2036F
- Flexible EPDs, Market Value (USD Million), and CAGR, 2026-2036F
- Foldable EPDs, Market Value (USD Million), and CAGR, 2026-2036F
- By Type
- E-Readers, Market Value (USD Million), and CAGR, 2026-2036F
- Mobile Devices, Market Value (USD Million), and CAGR, 2026-2036F
- Smart Cards, Market Value (USD Million), and CAGR, 2026-2036F
- Poster and Signage, Market Value (USD Million), and CAGR, 2026-2036F
- Auxiliary Displays, Market Value (USD Million), and CAGR, 2026-2036F
- Electronic Shelf Label, Market Value (USD Million), and CAGR, 2026-2036F
- Wearables, Market Value (USD Million), and CAGR, 2026-2036F
- By Technology
- Overview
- By End User
- Automotive, Market Value (USD Million), and CAGR, 2026-2036F
- Packaging and Logistics, Market Value (USD Million), and CAGR, 2026-2036F
- Consumer Electronics, Market Value (USD Million), and CAGR, 2026-2036F
- Retail, Market Value (USD Million), and CAGR, 2026-2036F
- Institutional, Market Value (USD Million), and CAGR, 2026-2036F
- Healthcare, Market Value (USD Million), and CAGR, 2026-2036F
- Media and Entertainment, Market Value (USD Million), and CAGR, 2026-2036F
- Others, Market Value (USD Million), and CAGR, 2026-2036F
- Country Level Analysis, Value (USD Million)
- Brazil Market Value (USD Million) and CAGR & Y-o-Y Growth Trend, 2026-2036F
- Argentina Market Value (USD Million) and CAGR & Y-o-Y Growth Trend, 2026-2036F
- Mexico Market Value (USD Million) and CAGR & Y-o-Y Growth Trend, 2026-2036F
- Rest of Latin America Market Value (USD Million) and CAGR & Y-o-Y Growth Trend, 2026-2036F
- Middle East & Africa Market
- Overview
- Market Value (USD Million), Current and Future Projections, 2026-2036
- Increment $ Opportunity Assessment, 2026-2036
- Year-on-Year Growth Forecast (%)
- Segmentation (USD million), 2026-2036, By
- By Technology
- Electrophoretic Display, Market Value (USD Million), and CAGR, 2026-2036F
- Electro Wetting Display, Market Value (USD Million), and CAGR, 2026-2036F
- Cholesteric Display, Market Value (USD Million), and CAGR, 2026-2036F
- Interferomatic Display, Market Value (USD Million), and CAGR, 2026-2036F
- Others, Market Value (USD Million), and CAGR, 2026-2036F
- By Product Form
- Flat EPDs, Market Value (USD Million), and CAGR, 2026-2036F
- Curved EPDs, Market Value (USD Million), and CAGR, 2026-2036F
- Flexible EPDs, Market Value (USD Million), and CAGR, 2026-2036F
- Foldable EPDs, Market Value (USD Million), and CAGR, 2026-2036F
- By Type
- E-Readers, Market Value (USD Million), and CAGR, 2026-2036F
- Mobile Devices, Market Value (USD Million), and CAGR, 2026-2036F
- Smart Cards, Market Value (USD Million), and CAGR, 2026-2036F
- Poster and Signage, Market Value (USD Million), and CAGR, 2026-2036F
- Auxiliary Displays, Market Value (USD Million), and CAGR, 2026-2036F
- Electronic Shelf Label, Market Value (USD Million), and CAGR, 2026-2036F
- Wearables, Market Value (USD Million), and CAGR, 2026-2036F
- By Technology
- Overview
- By End User
- Automotive, Market Value (USD Million), and CAGR, 2026-2036F
- Packaging and Logistics, Market Value (USD Million), and CAGR, 2026-2036F
- Consumer Electronics, Market Value (USD Million), and CAGR, 2026-2036F
- Retail, Market Value (USD Million), and CAGR, 2026-2036F
- Institutional, Market Value (USD Million), and CAGR, 2026-2036F
- Healthcare, Market Value (USD Million), and CAGR, 2026-2036F
- Media and Entertainment, Market Value (USD Million), and CAGR, 2026-2036F
- Others, Market Value (USD Million), and CAGR, 2026-2036F
- Country Level Analysis, Value (USD Million)
- Saudi Arabia Market Value (USD Million) and CAGR & Y-o-Y Growth Trend, 2026-2036F
- UAE Market Value (USD Million) and CAGR & Y-o-Y Growth Trend, 2026-2036F
- Israel Market Value (USD Million) and CAGR & Y-o-Y Growth Trend, 2026-2036F
- Qatar Market Value (USD Million) and CAGR & Y-o-Y Growth Trend, 2026-2036F
- Kuwait Market Value (USD Million) and CAGR & Y-o-Y Growth Trend, 2026-2036F
- Oman Market Value (USD Million) and CAGR & Y-o-Y Growth Trend, 2026-2036F
- South Africa Market Value (USD Million) and CAGR & Y-o-Y Growth Trend, 2026-2036F
- Rest of Middle East & Africa Market Value (USD Million) and CAGR & Y-o-Y Growth Trend, 2026-2036F
- Global Economic Scenario
- World Economic Outlook
- About Research Nester
- Our Global Clientele
- We Serve Clients Across World
E-Paper Display Market Outlook:
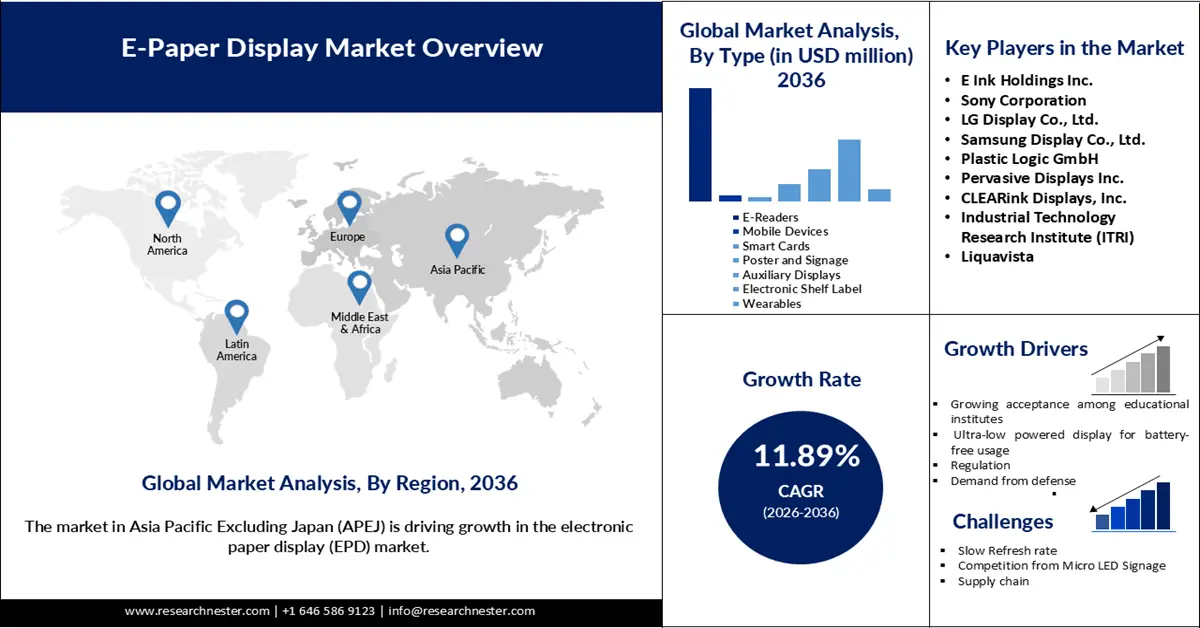
E-Paper Display Market size was valued at USD 35.47 billion in 2025 and is projected to reach USD 12.86 billion by the end of 2036, rising at a CAGR of 11.89% during the forecast period 2026-2036. In 2026, the industry size of the electronic paper display is evaluated at USD 41.85 billion.
Growing awareness of environmental sustainability has accelerated the adoption of paperless solutions and contributed to the expansion of the digital electronics space. The use of leisure e-readers has risen in recent years, reflecting strong and sustained demand for dedicated e-reading devices. In addition, the growth of online education and the shift from traditional classroom note-taking to digitized content delivery have further propelled the e-paper display market. Traditional print media continues to experience a notable decline as magazines and newspapers move to digital formats, increasing the consumption of e-readers and online content. According to a 2023 report by the Pew Research Center, the estimated total U.S. daily newspaper circulation (print and digital) fell from 63 million in 1990 to 20.9 million in 2022, highlighting the steep decline of traditional print. This transformation in reading behavior is driving wider adoption of electronic paper displays, which provide a paper-like viewing experience while offering the portability and convenience of digital devices.
Strong demand from government bodies is fostering innovation in electronic paper display technologies, particularly in regions such as Europe, where policies strongly encourage the reduction of paper use and waste. The EU Packaging and Packaging Waste Regulation, for instance, has contributed to the significant growth of the e-paper display market in the region by promoting sustainable packaging and digital alternatives. In response, manufacturers have advanced their digital signage and electronic paper display solutions, supporting broader adoption across multiple industries and geographic markets. Furthermore, innovations such as ultra-low-power displays reduce reliance on battery-based IoT sensors, reinforcing environmentally responsible practices and enhancing the long-term sustainability of electronic display systems.
Key E-Paper Display Market Insights Summary:
Regional Highlights:
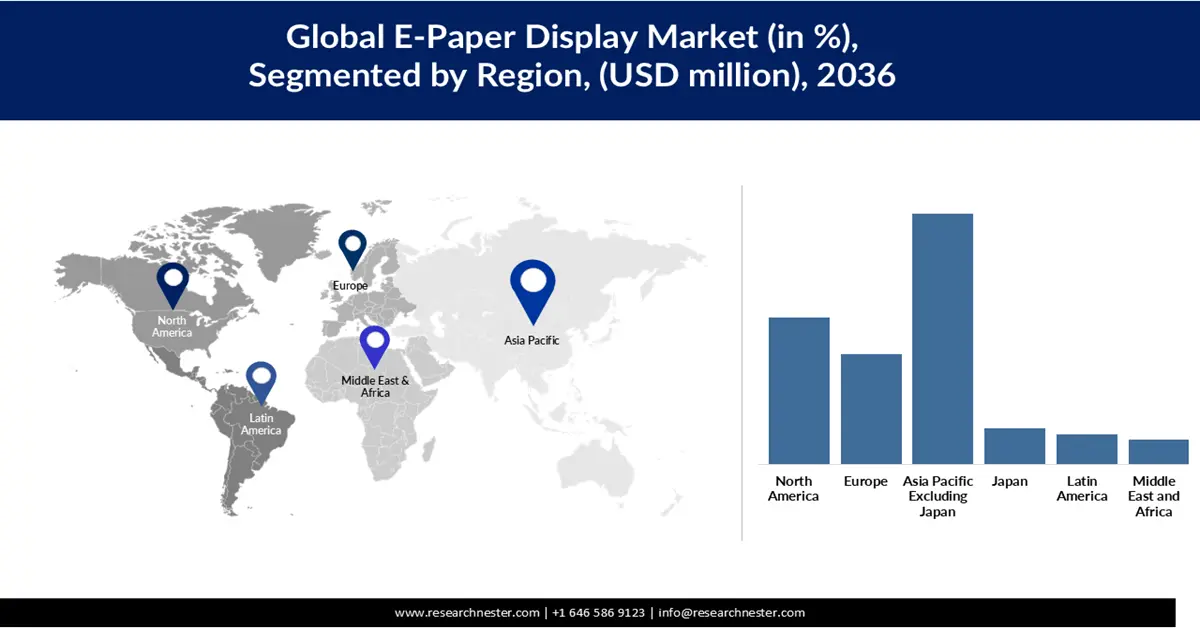
- By 2036, Asia Pacific Excluding Japan (APEJ) is projected to secure a 41.80% share of the e-paper display market owing to rapid digitalization and expanding deployment of digital signage across key sectors.
- North America is expected to record a CAGR of 11.01% through 2036 as adoption of electronic paper displays accelerates because of widespread retail infrastructure modernization.
Segment Insights:
- By 2036, the electrophoretic display segment in the e-paper display market is projected to command an 86.42% share, propelled by its strong commercialization in major consumer applications.
- The e-readers segment is set to expand at a 10.92% CAGR by 2036, supported by its pivotal role in driving large-scale demand and technological advancement within electronic paper displays.
Key Growth Trends:
- Growing acceptance among academic institutes
- Ultra-low-powered displays for battery-free IOT usage
Major Challenges:
- Slow refresh rate
- High initial cost of EPD devices and components
Key Players:E Ink Holdings Inc. (Taiwan), Sony Corporation (Japan), LG Display Co., Ltd. (South Korea), Samsung Display Co., Ltd. (South Korea), Plastic Logic GmbH (Germany), Pervasive Displays Inc. (Taiwan), CLEARink Displays, Inc. (U.S.), Industrial Technology Research Institute (ITRI) (Taiwan), Liquavista (Amazon subsidiary) (Netherlands).
Global E-Paper Display Market Forecast and Regional Outlook:
Market Size & Growth Projections:
- 2025 Market Size: USD 17.83 billion
- 2026 Market Size: USD 18.3 billion
- Projected Market Size: USD 23.73 billion by 2035
- Growth Forecasts: 2.9%
Key Regional Dynamics:
- Largest Region: Asia Pacific Excluding Japan (APEJ) (41.80% Share by 2036)
- Fastest Growing Region: North America
- Dominating Countries: United States, China, Germany, Japan, South Korea
- Emerging Countries: India, Brazil, Mexico, Indonesia, Vietnam
Last updated on : 24 November, 2025
E-Paper Display Market - Growth Drivers and Challenges
Growth Drivers
- Growing acceptance among academic institutes: Schools, colleges, and universities are increasingly adopting e-paper-based devices for digital textbooks, timetables, library systems, and examination processes to reduce printing costs and support sustainability goals. These displays provide a comfortable, paper-like reading experience that reduces eye strain for students during long study hours, making them suitable for continuous learning environments. The surge in remote and digital learning has further strengthened demand for e-paper tablets and e-notebooks, which enable efficient note-taking and easy content distribution. The Pew Research Center found that the pandemic accelerated the adoption of digital tools, with a 2021 survey revealing that 93% of households with K-12 students reported engaging in some form of online learning, cementing a lasting shift towards technology-enabled education. Additionally, institutions benefit from the low power consumption and long battery life of e-paper devices, making them cost-effective for large-scale academic deployment. Overall, this transition toward digitized education is significantly contributing to the expansion of the e-paper display market.
- Ultra-low-powered displays for battery-free IOT usage: Ultra-low-powered electronic paper displays for battery-free IoT applications are driving growth in the global e-paper display market by enabling energy-efficient operation of smart devices, sensors, and signage. Their minimal power requirements allow continuous functioning in remote or hard-to-access locations, making them ideal for applications such as smart shelves, logistics tracking, and environmental monitoring. By combining e-paper technology with IoT devices, they provide real-time data visualization while maintaining a paper-like reading experience. This approach reduces operational costs, minimizes maintenance needs, and promotes environmentally friendly practices, encouraging broader adoption across industries and accelerating market expansion.
- Regulations for paper waste reduction: Regulations aimed at reducing paper waste are driving growth in the global e-paper display market by encouraging organizations to adopt digital alternatives. Policies such as the EU Packaging and Packaging Waste Reduction Regulation push businesses and institutions to minimize paper usage, creating strong demand for e-paper solutions in signage, labeling, and documentation. Electronic paper displays offer a sustainable, reusable, and low-power alternative to traditional paper, aligning with government mandates and corporate sustainability goals. As compliance with these regulations becomes a priority, adoption of e-paper technology increases across industries such as retail, logistics, and education. This regulatory support not only promotes environmental responsibility but also fuels innovation and broader market expansion.
Challenges
- Slow refresh rate: Electronic paper displays (EPDs) use moving pigment particles to render text and images, resulting in slow pixel update rates compared with LED or OLED screens. This prevents them from supporting animations or video, limiting their use to static content. As advertisers prioritize dynamic displays for audience engagement, EPDs remain confined to niches such as signage, e-readers, and digital labels where static presentation is sufficient.
- High initial cost of EPD devices and components: Compared with traditional LCD or LED displays, EPDs often involve expensive materials, specialized manufacturing processes, and lower production volumes, which raise unit costs. This can deter small- and medium-sized businesses from adopting EPD technology, particularly for large-scale signage or commercial deployments. Additionally, limited color reproduction and lower brightness compared with alternative displays reduce their suitability for certain applications, such as outdoor advertising or vibrant retail displays. Collectively, these cost and performance limitations slow wider adoption and act as a market restraint.
E-Paper Display Market Size and Forecast
| Report Attribute | Details |
|---|---|
|
Base Year |
2025 |
|
Forecast Year |
2026-2036 |
|
CAGR |
11.89% |
|
Base Year Market Size (2025) |
USD 35.47 million |
|
Forecast Year Market Size (2036) |
USD 12.86 billion |
|
Regional Scope |
|
E-Paper Display Market Segmentation:
Technology Segment Analysis
The electrophoretic display segment is expected to hold a e-paper display market share of 86.42% by 2036, fueled by its successful commercialization in major consumer applications, most notably in popular e-readers like Amazon's Kindle. The technology is prized for its excellent readability in sunlight, extremely low power consumption, and a paper-like viewing experience that reduces eye strain. Continuous advancements in this segment, such as the development of color E-ink and faster refresh rates, are consistently expanding the market into new areas like e-notes, digital signage, and retail labels. Consequently, the growth and innovation within electrophoretic displays directly dictate the overall pace and direction of the entire electronic paper display industry.
Type Segment Analysis
The e-readers segment is expected to grow with a CAGR of 10.92% by 2036. The e-reader sub-segment acts as the foundational driver for the entire electronic paper display (EPD) market, creating the initial and sustained demand that enabled the technology's mass production and cost reduction. Its success with consumers, primarily through devices like Amazon's Kindle, validated the core value proposition of EPDs: low power consumption and paper-like readability. This massive volume from e-readers has directly fueled the dominance of the rigid EPD segment, as these displays are perfectly suited for the durable, single-purpose nature of reading devices. Furthermore, the profitability and scale achieved from e-readers have funded ongoing R&D, leading to advancements in screen size, resolution, and color that benefit other segments. Thus, the e-reader sub-segment remains the critical anchor, whose market performance and innovation cycles directly influence the growth and technological evolution of all EPD types.
End user Segment Analysis
The consumer electronics sub-segment is the dominant force propelling the end-user segment of the global electronic paper display (EPD) market. It creates the highest volume demand, primarily through mass-market devices like e-readers and smart notebooks, which drives down production costs and makes the technology more accessible for other applications. This widespread adoption in consumer goods validates EPDs' commercial viability and raises brand awareness among a global audience. The success in this segment directly fuels investment in research and development, leading to innovations like color E-ink and flexible displays that subsequently benefit other end-user segments like retail and logistics. Ultimately, the performance and trends within consumer electronics set the primary growth trajectory for the entire EPD end-user market.
Our in-depth analysis of the E-Paper Display Market includes the following segments:
|
Segments |
Subsegments |
|
Technology |
|
|
Type |
|
|
Product Form |
|
|
End user |
|

Vishnu Nair
Head - Global Business DevelopmentCustomize this report to your requirements — connect with our consultant for personalized insights and options.
E-Paper Display Market - Regional Insights
Asia Pacific Excluding Japan Market Insights
Asia Pacific Excluding Japan (APEJ) is driving growth in the electronic paper display (EPD) market with a market share of 41.80%, due to rapid digitalization, increasing adoption of e-readers, and expanding use of digital signage across retail, logistics, and education sectors. Rising government initiatives promoting paperless solutions and sustainability further support EPD adoption. Growing investments by local manufacturers in affordable and innovative e-paper devices are boosting accessibility for consumers and businesses. Additionally, the region’s large population and expanding middle class create a strong demand for low-power, portable, and cost-effective display solutions. These factors collectively position APEJ as a key growth engine for the global electronic paper display market.
China is witnessing robust growth in the e-paper display market, driven by rising adoption of e-readers, digital signage, and smart retail solutions. Government initiatives promoting paperless offices and sustainable technologies are encouraging businesses and educational institutions to adopt EPDs. The World Bank reports that China's Digital China strategy has led to a massive expansion of its digital economy, which accounted for over 40% of the national GDP in recent years. This top-down push for digitalization directly encourages the adoption of paperless technologies like EPDs across industries. Local manufacturers are investing in cost-effective and innovative e-paper devices, enhancing accessibility and fueling demand. Additionally, the expanding e-commerce and logistics sectors are leveraging EPD-based smart labels and shelf displays, further boosting market expansion. China’s large urban population and tech-savvy consumers provide a favorable environment for continued growth in the sector.
India’s e-paper display market is growing rapidly, supported by increasing digitalization in education, retail, and corporate sectors. Rising environmental awareness and government policies encouraging paperless solutions are driving the adoption of e-paper devices in schools, colleges, and offices. The proliferation of e-readers and low-power digital signage is catering to the growing demand for portable and energy-efficient displays. Additionally, expanding retail, logistics, and banking sectors are using EPD-based smart labels, price tags, and informational displays. Favorable demographics, coupled with improving technology penetration, are positioning India as a high-potential market for electronic paper displays.
North America Market Insights
North America leads in the adoption of electronic paper displays (EPDs) and electronic signage systems, supported by a well-developed retail infrastructure utilizing electronic shelf labels. The market is projected to grow at a CAGR of 11.01% through 2036, driven further by rising demand for e-readers. Government and public sector initiatives to replace paper-based information with digital boards are also fueling market growth, with reported cost savings following the transition. The region prioritizes sustainability and energy efficiency, particularly as consumer products and FMCG markets expand rapidly, reinforcing the adoption of EPD technologies across various sectors.
The U.S. e-paper display market is expanding due to widespread adoption of e-readers, electronic shelf labels, and digital signage across retail, education, and corporate sectors. Government and public institutions are increasingly replacing paper-based systems with digital boards, driving efficiency and cost savings. Rising consumer demand for sustainable and energy-efficient technologies further supports market growth. Major retailers and logistics companies are implementing EPDs for inventory management and smart labeling, boosting adoption. Innovation by local manufacturers in low-power and high-quality e-paper devices is also contributing to steady market expansion.
Canada’s electronic paper display market is growing steadily, driven by initiatives in education, government, and retail sectors to digitize information and reduce paper consumption. Adoption of electronic shelf labels and digital signage in retail chains is enhancing operational efficiency and reducing costs. The emphasis on sustainability and energy efficiency encourages public and private organizations to switch to EPD solutions. The rising popularity of e-readers and low-power displays in homes and offices further supports demand. Combined with government incentives for environmentally friendly technologies, these factors are fueling market growth across the country.
Europe Market Insights
The European e-paper display market is growing steadily, driven by strong government regulations promoting paper waste reduction and sustainability initiatives across public and private sectors. Widespread adoption of electronic shelf labels in retail, digital signage in offices, and e-readers in education and leisure sectors is fueling demand. Manufacturers are innovating with low-power, high-quality EPD solutions to meet the region’s focus on energy efficiency and eco-friendly technologies. Additionally, the growing shift from print to digital media is encouraging businesses to implement EPDs for cost savings and operational efficiency. Combined, these factors are supporting sustained market expansion across Europe.
Germany’s market is expanding rapidly due to strong government initiatives promoting sustainability and paperless operations across public institutions and businesses. Retailers are increasingly adopting electronic shelf labels and digital signage to enhance operational efficiency and reduce costs. The country’s focus on energy-efficient and eco-friendly technologies drives innovation in low-power EPD solutions. Additionally, growing interest in e-readers and digital education tools supports consumer demand. These factors collectively position Germany as a key growth market in Europe.
France is witnessing steady growth in the electronic paper display market, fueled by the adoption of digital signage, electronic shelf labels, and e-readers across retail, education, and public sectors. Government policies encouraging paper reduction and sustainability are accelerating the shift from traditional print to electronic displays. The emphasis on energy efficiency and environmentally friendly solutions encourages businesses and institutions to adopt EPDs. Rising awareness of digital learning tools and portable e-paper devices further drives consumer demand. Overall, these initiatives are strengthening France’s role in the European market.
Key E-Paper Display Market Players:
- E Ink Holdings Inc. (Taiwan)
- Company Overview
- Business Strategy
- Key Product Offering
- Financial Performance
- Key Performance Indicators
- Risk Analysis
- Recent Development
- Regional Presence
- SWOT Analysis
- Sony Corporation (Japan)
- LG Display Co., Ltd. (South Korea)
- Samsung Display Co., Ltd. (South Korea)
- Plastic Logic GmbH (Germany)
- Pervasive Displays Inc. (Taiwan)
- CLEARink Displays, Inc. (U.S.)
- Industrial Technology Research Institute (ITRI) (Taiwan)
- Liquavista (Amazon subsidiary) (Netherlands)
- E Ink Holdings is a pioneer in electrophoretic display technology, providing EPD solutions for e-readers, electronic shelf labels, and signage. The company is known for its energy-efficient, high-contrast displays that mimic the appearance of paper. E Ink collaborates with major global brands to integrate e-paper solutions across consumer electronics and retail sectors. Its continuous innovation and strong patent portfolio reinforce its leadership in the electronic paper display market.
- Sony Corporation is a leading electronics company that has developed advanced e-paper technologies for e-readers and professional displays. The company leverages its expertise in imaging and display technologies to deliver high-quality, durable, and energy-efficient EPD products. Sony’s innovation and global brand recognition support its adoption in education, publishing, and corporate sectors. Its focus on sustainability and low-power displays aligns with increasing market demand.
- LG Display specializes in high-resolution display technologies, including e-paper solutions for retail signage, digital labels, and consumer electronics. The company invests heavily in R&D to produce energy-efficient and lightweight displays suitable for large-scale deployment. LG Display’s strong partnerships with global manufacturers enhance its reach across diverse industries. Its technological advancements and commitment to eco-friendly solutions contribute to its competitive position in the electronic paper display market.
- Samsung Display develops innovative electronic paper and flexible display technologies for commercial and consumer applications. Its EPD products emphasize low power consumption, portability, and durability, catering to e-readers, signage, and IoT devices. The company leverages its extensive manufacturing capabilities and global distribution network to strengthen market penetration. Continuous R&D investment helps Samsung maintain technological leadership in the electronic display space.
- Plastic Logic GmbH focuses on flexible and lightweight electronic paper displays for e-readers, industrial applications, and digital signage. Its technology emphasizes durability, low power consumption, and versatile form factors suitable for commercial use. The company collaborates with technology partners to expand the adoption of flexible EPD solutions in Europe and globally. Its innovative approach and specialized offerings position it as a prominent player in the niche electronic paper display market.
Here are a few areas of focus covered in the competitive landscape of the e-paper display market:
The global e-paper display market is expected to experience intense competition over the forecast period, driven by the presence of both established players and new entrants. While the market remains moderately fragmented, emerging companies pose strong competitive pressure, limiting the revenue share of existing players. Specialized manufacturers continue to maintain a competitive edge through innovation and niche offerings. Key market participants also benefit from government support for research and development, which fosters technological advancements and strengthens their market positions.
Corporate Landscape of the E-Paper Display Market
Recent Developments
- In September 2025, Pervasive Displays Inc. (PDi), a global leader in e-paper technology, announced the launch of its groundbreaking 3.4-inch E-Paper Display (EPD) module. Engineered for next-generation smart industrial and home applications, this unique, nearly square form factor delivers high-resolution clarity (456 x 392, 177 DPI), providing exceptional balance and readability for text and graphics.
- In May 2025, Samsung Electronics globally launched the 32-inch Color E-Paper monitor (model EM32DX). Utilizing advanced digital ink technology, this display provides a sustainable digital signage solution characterized by ultra-low power consumption, superior visibility in various lighting conditions, and a lightweight design for versatile business applications.
- Report ID: 8267
- Published Date: Nov 24, 2025
- Report Format: PDF, PPT
- Explore a preview of key market trends and insights
- Review sample data tables and segment breakdowns
- Experience the quality of our visual data representations
- Evaluate our report structure and research methodology
- Get a glimpse of competitive landscape analysis
- Understand how regional forecasts are presented
- Assess the depth of company profiling and benchmarking
- Preview how actionable insights can support your strategy
Explore real data and analysis
Frequently Asked Questions (FAQ)
E-Paper Display Market Report Scope
Free Sample includes current and historical market size, growth trends, regional charts & tables, company profiles, segment-wise forecasts, and more.
Connect with our Expert


Copyright @ 2026 Research Nester. All Rights Reserved.
