Petrochemical Market Outlook:
Petrochemical market was valued at USD 672.5 billion in 2025 and is projected to reach USD 1.15 trillion by the end of 2035, rising at a CAGR of 5.6% during the forecast period, i.e., 2026-2035. In 2026, the industry size of the petrochemical is estimated at USD 716.7 billion.
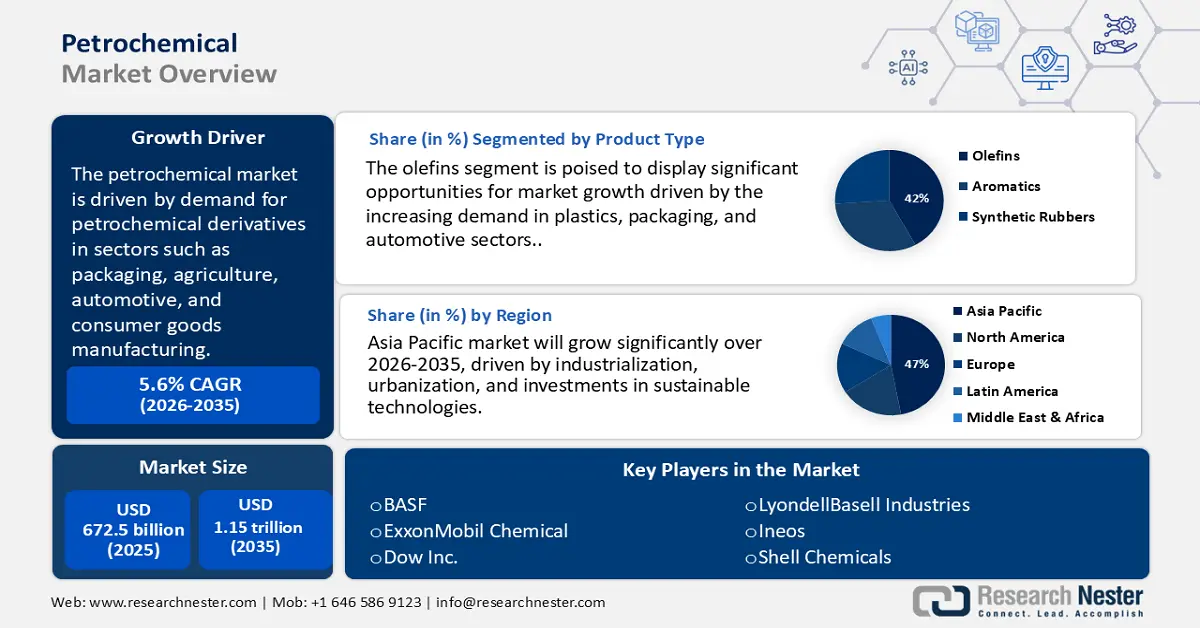
The market is currently undergoing substantial growth, driven by heightened demand for petrochemical derivatives in critical sectors such as packaging, agriculture, automotive, and consumer goods manufacturing. With record natural gas production, U.S. ethane production increased 9% to an average of 2.6 million barrels per day (b/d) in 2023, reflecting an increase in downstream production efforts. A significant shift towards gas-based feedstocks in North America and the Middle East, aided by favorable policy incentives, has improved both cost efficiency and supply chain security. Considerable investments in steam crackers and derivative production units are modernizing infrastructure to cater to the increasing global demand for essential chemicals like ethylene and propylene. Additionally, trade agreements and zero-tariff frameworks in the Asia-Pacific have been enhanced, enabling manufacturers to expand their global distribution channels and counteract volatility related to crude oil prices.
Sourcing raw materials, especially naphtha, natural gas liquids (NGLs), and refinery byproducts, is crucial for production economics. In the United States, almost all ethane is extracted at natural gas processing plants that extract ethane and other natural gas plant liquids (NGPL) from raw natural gas. The Texas Inland and New Mexico refining districts, which make up the Permian Basin, accounted for 61% of all U.S. ethane output in 2023. Average production levels in these two districts were approximately 1.6 million b/d in 2023, which is essentially the same as in 2022. Domestic consumption of ethane, measured as product supplied, grew 5% to 2.1 million b/d in 2023. Ethane in the United States is nearly exclusively consumed as a feedstock in the petrochemical industry.
Key Petrochemical Market Insights Summary:
Regional Insights:
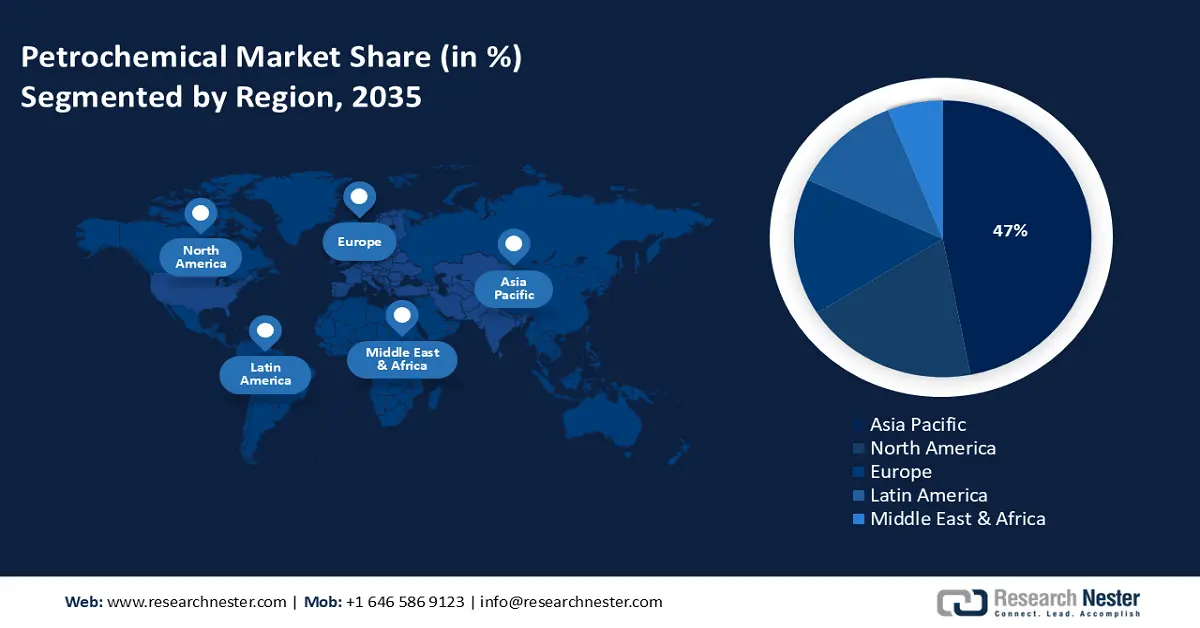
- Asia Pacific is expected to command 47% of the Petrochemical Market by 2035, propelled by rapid industrialization, urbanization, and rising investments in sustainable chemical technologies.
- North America is forecasted to secure around 19% of the market by 2035, growing at a 2.9% CAGR from 2026–2035, owing to strong demand from automotive, packaging, and construction industries alongside advances in sustainable manufacturing.
Segment Insights:
- The Olefins segment is projected to capture 42% of the market by 2035, impelled by the accelerating shift toward lightweight and recyclable material applications.
- The Naphtha segment is anticipated to account for 36% of the market by 2035, underpinned by refiners optimizing feedstock outputs to meet rising petrochemical demand.
Key Growth Trends:
- Innovation in advanced catalytic technologies
- Expansion in end-use sectors
Major Challenges:
- Complex and evolving regulatory frameworks
- Market access barriers due to tariffs and trade policies
Key Players: Dow Inc., BASF SE, SABIC (Saudi Basic Industries Corp), Sinopec (China Petroleum & Chemical Corp), LyondellBasell Industries, INEOS Group, Formosa Plastics Group, LG Chem, Reliance Industries Limited, SABIC Innovative Plastics, Orica Limited, Lotte Chemical, Petronas Chemicals Group Berhad, Borealis AG, Mitsubishi Chemical Holdings.
Global Petrochemical Market Forecast and Regional Outlook:
Market Size & Growth Projections:
- 2025 Market Size: USD 672.5 billion
- 2026 Market Size: USD 716.7 billion
- Projected Market Size: USD 1.15 trillion by 2035
- Growth Forecasts: 5.6% CAGR (2026-2035)
Key Regional Dynamics:
- Largest Region: Asia Pacific (47% Share by 2035)
- Fastest Growing Region: Asia Pacific
- Dominating Countries: China, United States, Saudi Arabia, India, South Korea
- Emerging Countries: Vietnam, Indonesia, United Arab Emirates, Mexico, Brazil
Last updated on : 9 September, 2025
Petrochemical Market - Growth Driver and Challenges
Growth Driver
- Innovation in advanced catalytic technologies: The implementation of cutting-edge catalytic technologies has led to an increase in throughput efficiency, as reported by the U.S. Department of Energy. These advancements not only decrease energy usage but also minimize greenhouse gas emissions while boosting overall production levels. Consequently, these technologies have become essential differentiators for operations focused on cost efficiency and sustainability compliance.
- Expansion in end-use sectors: The increasing demand from the packaging, electronics, and automotive industries, particularly for plastic resins and synthetic rubbers, is significantly enhancing the consumption of petrochemicals. In 2024, the U.S. Bureau of Economic Analysis and the U.S. Census Bureau reported that the goods and services deficit increased by $19.5 billion from $78.9 billion in November to $98.4 billion in December, highlighting the worldwide need for polymer-based materials in both manufacturing and consumer products.
- Advancements in shale gas extraction: The rise of affordable feedstock from shale gas has transformed the petrochemical market, especially in North America. Ethane from shale gas is a basic building block for ethylene, which is used to create plastics and other derivatives. Shale formations accounted for roughly 78% (37.87 trillion cubic feet) of all dry natural gas production in the United States in 2023. This feedstock advantage has encouraged production of new petrochemical facilities and provides an ongoing supply of a raw material at a low cost and thereby increasing profit margins and growth in the market.
Trade Dynamics: Polymers of Halogenated Olefins
The trade of polymers of halogenated olefins drives the petrochemical market by boosting demand for upstream olefin and halogen feedstocks like ethylene and chlorine. These high-performance polymers are essential in sectors such as electronics, aerospace, and energy, making them economically significant despite lower volumes. Their specialized applications command premium pricing, influencing global trade balances and investment flows. As industries pivot toward advanced materials and clean technologies, these polymers play a pivotal role in shaping petrochemical innovation and capacity expansion.
Top Exporters of Polymers of Halogenated Olefins in 2023
|
Exporter |
Trade Value (thousand USD) |
Quantity (Kg) |
|
European Union |
118,771.73 |
46,696,600 |
|
Japan |
98,925.25 |
58,554,200 |
|
United States |
85,485.96 |
18,342,800 |
|
Belgium |
71,341.80 |
27,286,700 |
|
Thailand |
57,989.83 |
32,934,700 |
|
Netherlands |
53,510.38 |
37,940,300 |
|
Korea, Rep. |
37,570.55 |
20,266,300 |
|
Germany |
26,717.75 |
3,869,870 |
|
South Africa |
4,653.80 |
3,816,240 |
|
Romania |
4,473.23 |
1,924,600 |
Source: WITS
Challenges
- Complex and evolving regulatory frameworks: Regulatory frameworks vary significantly from one region to another, making compliance more challenging and prolonging product approvals. For instance, the safety standards implemented in China in 2022 resulted in a six-month postponement of petrochemical product launches, which in turn caused revenue losses and hindered competitiveness. According to the WTO (2021), these regulatory discrepancies can increase trade costs by as much as 14%.
- Market access barriers due to tariffs and trade policies: Import duties and non-tariff obstacles, such as licensing requirements and customs holdups, hinder the trade of petrochemicals. In 2023, the tensions between the US and China led to additional tariffs, which increased the prices of petrochemical imports and restricted market entry. The WTO Trade Policy Reviews (2023) highlight the extent to which these actions interfere with global petrochemical supply chains.
Petrochemical Market Size and Forecast:
| Report Attribute | Details |
|---|---|
|
Base Year |
2025 |
|
Forecast Year |
2026-2035 |
|
CAGR |
5.6% |
|
Base Year Market Size (2025) |
USD 672.5 billion |
|
Forecast Year Market Size (2035) |
USD 1.15 trillion |
|
Regional Scope |
|
Petrochemical Market Segmentation:
Product Type Segment Analysis
Olefins segment is projected to capture 42% of the market by 2035, with ethylene and propylene leading the way as the most significant contributors among petrochemical products. Their importance stems from their fundamental role as foundational elements in plastics, packaging, and automotive components. The American Chemistry Council emphasizes that the demand for these olefins is anticipated to rise sharply as the worldwide movement towards lightweight and recyclable materials gains momentum. Ethylene plays a crucial role in the production of polyethylene, whereas propylene is vital for the manufacturing of polypropylene, both of which are integral to a wide range of consumer and industrial uses.
Feedstock Type Segment Analysis
Naphtha segment is anticipated to account for 36% of the petrochemical market by 2035, continuing to be the leading feedstock worldwide due to its accessibility and adaptability in generating essential petrochemicals such as ethylene and propylene. As reported by the U.S. Energy Information Administration, the consumption of naphtha-based feedstock is expected to experience substantial growth, driven by refiners who are optimizing their product offerings to satisfy the increasing demand for petrochemicals. Its widespread application in Asia-Pacific refining centers and developing economies enhances its market leadership, bolstered by reliable supply chains and regulatory frameworks that encourage cleaner processing techniques.
End use Segment Analysis
The automotive segment is anticipated to account for 30% of the market by 2035, because of the number of plastics, synthetic rubbers, resins, and composites that are made into vehicles. Petrochemicals are vital in creating plastics, rubbers, and resins for light-weight, strong, and fuel-efficient parts of vehicles such as bumpers and dashboards, interior trims, and tires. The growth of the electric vehicle (EV) market will increase the demand for lightweight materials, particularly as a means of improving energy efficiency. The automotive industry will continue to be a much larger consumer of petrochemicals when compared to packaging, electronics, construction, and agriculture.
Our in-depth analysis of the global petrochemical market includes the following segments:
|
Segment |
Subsegments |
|
Product Type |
|
|
Feedstock Type |
|
|
Manufacturing Process |
|
|
Type |
|
|
End use |
|

Vishnu Nair
Head - Global Business DevelopmentCustomize this report to your requirements — connect with our consultant for personalized insights and options.
Petrochemical Market - Regional Analysis
Asia Pacific Market Insights
Asia Pacific petrochemical market is expected to hold 47% of the global market by 2035, driven by industrialization, urbanization, rising consumer demand, supportive policies, and investments in sustainable technologies. Over the past five years, government funding for clean chemical technologies has increased, led by agencies such as the Ministry of Ecology and Environment (MEE) and the National Development and Reform Commission (NDRC). In 2023, millions of businesses in China embraced sustainable chemical practices, underscoring the extensive involvement of the industry in eco-friendly initiatives. These statistics underscore China's strong investment in sustainable development and its strategic leadership in the petrochemical sector.
India's chemicals and petrochemicals sector is expected to be one of the fastest-growing sectors in the country. Demand for chemicals is expected to increase nearly threefold, while the petrochemicals sector is expected to touch USD 1 trillion by 2040. India ranks sixth in the world when it comes to the production of chemicals (third in Asia) and exports chemicals to over 175 countries, accounting for 15% of its total exports. The sector aims to garner an investment of USD 87 billion over the next decade. This is backed by the PCPIR Policy 2020–35, which aims to achieve ₹10 lakh crore (USD 142 billion) by 2025.
North America Market Insights
North America, comprising the United States and Canada, is forecasted to hold approximately 19% of the market by 2035, growing at a CAGR of 2.9% from 2026 to 2035. The market growth is driven by robust demand in the automotive, packaging, and construction sectors, alongside increasing investments in sustainable and advanced manufacturing technologies.
The U.S. petrochemical market holds control of the North American market, leveraging affordable shale gas feedstock and a comprehensive refining network. The U.S petrochemical industry is a major supplier of ethylene and polyethylene, with rising demand from the packaging materials and automotive industry. The Gulf Coast is also key to larger volume, capital projects. The U.S. continues to support our petrochemical industry through introductory policies for cleaner (lower carbon) process routes, along with the backing of carbon reduction technologies by the Department of Energy and the EPA.
Europe Market Insights
Europe market is projected to hold 16% of the global market by 2035, driven by essential raw material services for plastics, fertilizers, and specialty chemicals, while adapting to the decarbonization policies outlined in the European Green Deal. The sector will grow through ongoing innovation focused on circular economy initiatives, renewable feedstocks, and recycling technologies. As decarbonizing the global economy gains increasing importance in supply chains and production processes, the industry continues to evolve in line with innovation and growth. Germany is considered by some reports to possess some of Europe’s most advanced advantages in existing petrochemical hub needs.
Further, ethylene exports play a crucial role in driving Europe's petrochemical market by supporting cracker utilization and balancing regional supply-demand gaps. As a foundational building block for plastics and chemicals, strong export performance helps offset domestic overcapacity and weak derivative demand. It also sustains competitiveness amid rising energy costs and regulatory pressures like the EU Emissions Trading Scheme. Ultimately, ethylene trade reinforces Europe's position in global petrochemical value chains while influencing investment and production strategies.
Ethylene Exports in 2023
|
Region / Country |
Export Value (USD ’000) |
Quantity (Kg) |
|
United Kingdom |
517,486.97 |
398,067,000 |
|
Germany |
193,979.02 |
- |
|
France |
128,843.97 |
132,673,000 |
|
Italy |
26,032.44 |
37,995,100 |
|
Spain |
17,600.34 |
22,223,300 |
Source: WITS
Germany has significant refining capacity and large integrated chemical parks, particularly in industrial regions such as North Rhine-Westphalia. The petrochemical industry is vital to German sectors, including automotive, construction, and packaging. Due to their sustainability targets and legislation, German petrochemical producers are investing in new, innovative low-carbon processes, hydrogen-based technologies, and bio-feedstocks to meet EU climate performance goals and capitalize on competitive advantages in global trade.
Key Petrochemical Market Players:
- Dow Inc.
- Company Overview
- Business Strategy
- Key Product Offerings
- Financial Performance
- Key Performance Indicators
- Risk Analysis
- Recent Development
- Regional Presence
- SWOT Analysis
- BASF SE
- SABIC (Saudi Basic Industries Corp)
- Sinopec (China Petroleum & Chemical Corp)
- LyondellBasell Industries
- INEOS Group
- Formosa Plastics Group
- LG Chem
- Reliance Industries Limited
- SABIC Innovative Plastics
- Orica Limited
- Lotte Chemical
- Petronas Chemicals Group Berhad
- Borealis AG
- Mitsubishi Chemical Holdings
The global petrochemical industry is predominantly driven by leading multinational corporations based in Europe, the USA, and the Asia-Pacific. These corporations utilize cutting-edge research and development, comprehensive supply chain integration, and strategic acquisitions to uphold their market dominance. For instance, BASF and Dow Inc. are significantly committed to sustainable chemistry and circular economy projects, while Asian frontrunners like Sinopec and Reliance focus on expanding capacity and advancing technology. Key strategic efforts encompass investments in green chemical technologies, digital transformation, and regional diversification to reduce supply chain vulnerabilities. Collaborative partnerships and alliances with governmental organizations are increasingly common, especially in regions with stringent environmental regulations, allowing businesses to adhere to compliance and gain a competitive advantage. Below is a detailed table listing the top 15 global petrochemical manufacturers, including their estimated market shares and countries of origin.
Some of the key players operating in the market are listed below:
Recent Developments
- In September 2024, Sinopec declared the commercial introduction of bio-based ethylene sourced from agricultural waste at its facility in Nanjing. This development is in line with China's national objectives to lower carbon emissions in petrochemical production. Initial implementation resulted in a 16% rise in sustainable chemical output, and Sinopec intends to increase bio-ethylene production by 35% each year until 2030. This launch enhances Sinopec's standing in the bio-petrochemical sector, addressing the swiftly expanding demand for green alternatives in the Asia-Pacific.
- In March 2024, BASF unveiled its latest line of biodegradable plastic products branded as EcoFlex Bio, specifically designed for packaging applications. This introduction was a direct response to the increasing regulatory demands in North America and Europe for sustainable materials. The product holds certification as compostable by ASTM D6400 standards, making it attractive to both environmentally conscious consumers and manufacturers.
- Report ID: 4125
- Published Date: Sep 09, 2025
- Report Format: PDF, PPT
- Explore a preview of key market trends and insights
- Review sample data tables and segment breakdowns
- Experience the quality of our visual data representations
- Evaluate our report structure and research methodology
- Get a glimpse of competitive landscape analysis
- Understand how regional forecasts are presented
- Assess the depth of company profiling and benchmarking
- Preview how actionable insights can support your strategy
Explore real data and analysis
Frequently Asked Questions (FAQ)
About this Report
Connect with our Expert

Report, 2026-2035


Copyright @ 2026 Research Nester. All Rights Reserved.
