PEM Electrolyzer Market Size & Share - Growth Analysis and Forecast 2027-2036

Market Size - By Capacity (≤500 kW, >500 kW – 2 MW, >2 - 5 MW, Above 5 MW); Component; Membrane Type; Application; End user - Global Supply & Demand Analysis, Growth Forecasts, Statistical Report. The market forecasts are provided in terms of revenue (USD Million) and volume (Units)

  • Report ID: 8557
  • Published Date: Jul 14, 2026
  • Report Format: PDF, PPT

Global PEM Electrolyzers Market
1. An Outline of the Global PEM Electrolyzers Market
1.1. Market Definition and Segmentation
1.2. Study Assumptions and Abbreviations
2. Research Methodology & Approach
2.1. Primary Research
2.2. Secondary Research
2.3. Data Triangulation
2.4. SPSS Methodology
3. Executive Summary
4. Growth Drivers
5. Major Roadblocks
6. Opportunities
7. Prevalent Trends
8. Government Regulation
9. Growth Outlook
10. Competitive White Space Analysis – Identifying Untapped Market Gaps
11. Risk Overview
12. SWOT
13. Technological Advancement
14. Technology Maturity Matrix for the PEM Electrolyzers Market: Recent News
15. Regional Demand
16. Global PEM Electrolyzers by Geography – Strategic Comparative Analysis
17. Strategic Segment Analysis: PEM Electrolyzers Demand Landscape
18. PEM Electrolyzers Demand Trends Driven by expansion of hydrogen hubs and integrated energy projects, and favorable policies promoting industrial decarburization. (2027-2036)
19. Root Cause Analysis (RCA) for discovering problems of the PEM Electrolyzers Market
20. Porter Five Forces
21. PESTLE
22. Comparative Positioning
23. Global PEM Electrolyzers – Key Player Analysis (2036)
24. Competitive Landscape: Key Suppliers/Players
25. Competitive Model: A Detailed Inside View for Investors
26. Company Market Share, 2036 (%)
26.1. Air Liquide
26.2. Cummins Inc
26.3. Elogen
26.4. FEST Group
26.5. GreenH Electrolysis
26.6. H2Next Pvt Ltd.
26.7. HOVOGEN
26.8. HyAxiom, Inc. (Doosan Corporation.)
26.9. HYDGEN
26.10. Hygreen Energy
26.11. Hyster
26.12. ITM Power plc
26.13. Nel ASA
26.14. Ohmium
26.15. Plug Power Inc.
26.16. Quest One
26.17. Siemens Energy.
27. Global PEM Electrolyzers Market Outlook
27.1. Market Overview
27.1.1. Market Revenue by Value (USD Million) and Compound Annual Growth Rate (CAGR)
27.2. PEM Electrolyzers Market Segmentation Analysis (2027-2036)
27.2.1. By Capacity
27.2.1.1. ≤500 kW, Market Value (USD Million), and CAGR, 2027-2036F
27.2.1.2. >500 kW – 2 MW, Market Value (USD Million), and CAGR, 2027-2036F
27.2.1.3. >2 - 5 MW, Market Value (USD Million), and CAGR, 2027-2036F
27.2.1.4. Above 5 MW, Market Value (USD Million), and CAGR, 2027-2036F
27.2.2. By Component
27.2.2.1. Stack, Market Value (USD Million), and CAGR, 2027-2036F
27.2.2.1.1. Interconnect, Market Value (USD Million), and CAGR, 2027-2036F
27.2.2.1.2. Cell Frame, Market Value (USD Million), and CAGR, 2027-2036F
27.2.2.1.3. End Plates, Market Value (USD Million), and CAGR, 2027-2036F
27.2.2.1.4. Others, Market Value (USD Million), and CAGR, 2027-2036F
27.2.2.2. Balance of Plant (BoP), Market Value (USD Million), and CAGR, 2027-2036F

27.2.3. By Membrane Type
27.2.3.1. Perfluorosulfonic Acid (PFSA), Market Value (USD Million), and CAGR, 2027-2036F
27.2.3.2. Composite / Hybrid Membranes, Market Value (USD Million), and CAGR, 2027-2036F
27.2.3.3. Hydrocarbon-Based Membranes, Market Value (USD Million), and CAGR, 2027-2036F
27.2.3.4. Others, Market Value (USD Million), and CAGR, 2027-2036F
27.2.4. By Application
27.2.4.1. Power Generation, Market Value (USD Million), and CAGR, 2027-2036F
27.2.4.2. Mobility & Transportation, Market Value (USD Million), and CAGR, 2027-2036F
27.2.4.3. Industry Energy, Market Value (USD Million), and CAGR, 2027-2036F
27.2.4.4. Industry Feedstock, Market Value (USD Million), and CAGR, 2027-2036F
27.2.4.5. Building Heating & Power, Market Value (USD Million), and CAGR, 2027-2036F
27.2.4.6. Industrial Hydrogen Applications, Market Value (USD Million), and CAGR, 2027-2036F
27.2.4.7. Others, Market Value (USD Million), and CAGR, 2027-2036F
27.2.5. By End user
27.2.5.1. Energy & Power, Market Value (USD Million), and CAGR, 2027-2036F
27.2.5.2. Chemical Industry, Market Value (USD Million), and CAGR, 2027-2036F
27.2.5.3. Oil & Gas Industry, Market Value (USD Million), and CAGR, 2027-2036F
27.2.5.4. Metals & Heavy Industry, Market Value (USD Million), and CAGR, 2027-2036F
27.2.5.5. Mobility & Infrastructure, Market Value (USD Million), and CAGR, 2027-2036F
27.2.5.6. Others (Electronics & Semiconductor), Market Value (USD Million), and CAGR, 2027-2036F

27.2.6. Regional Synopsis, Value (USD Million), 2027-2036
27.2.6.1. North America Market Value (USD Million) and CAGR & Y-o-Y Growth Trend, 2027-2036F
27.2.6.2. Europe Market Value (USD Million) and CAGR & Y-o-Y Growth Trend, 2027-2036F
27.2.6.3. Asia Pacific, excluding Japan Market Value (USD Million) and CAGR & Y-o-Y Growth Trend, 2027-2036F
27.2.6.4. Latin America Market Value (USD Million) and CAGR & Y-o-Y Growth Trend, 2027-2036F
27.2.6.5. Middle East and Africa Market Value (USD Million) and CAGR & Y-o-Y Growth Trend, 2027-2036F
28. North America Market
28.1. Overview
28.1.1. Market Value (USD Million), Current and Future Projections, 2027-2036
28.1.2. Increment $ Opportunity Assessment, 2027-2036
28.2. Segmentation (USD Million), 2027-2036, By
28.2.1. By Capacity
28.2.1.1. ≤500 kW, Market Value (USD Million), and CAGR, 2027-2036F
28.2.1.2. >500 kW – 2 MW, Market Value (USD Million), and CAGR, 2027-2036F
28.2.1.3. >2 - 5 MW, Market Value (USD Million), and CAGR, 2027-2036F
28.2.1.4. Above 5 MW, Market Value (USD Million), and CAGR, 2027-2036F
28.2.2. By Component
28.2.2.1. Stack, Market Value (USD Million), and CAGR, 2027-2036F
28.2.2.1.1. Interconnect, Market Value (USD Million), and CAGR, 2027-2036F
28.2.2.1.2. Cell Frame, Market Value (USD Million), and CAGR, 2027-2036F
28.2.2.1.3. End Plates, Market Value (USD Million), and CAGR, 2027-2036F
28.2.2.1.4. Others, Market Value (USD Million), and CAGR, 2027-2036F
28.2.2.2. Balance of Plant (BoP), Market Value (USD Million), and CAGR, 2027-2036F

28.2.3. By Membrane Type
28.2.3.1. Perfluorosulfonic Acid (PFSA), Market Value (USD Million), and CAGR, 2027-2036F
28.2.3.2. Composite / Hybrid Membranes, Market Value (USD Million), and CAGR, 2027-2036F
28.2.3.3. Hydrocarbon-Based Membranes, Market Value (USD Million), and CAGR, 2027-2036F
28.2.3.4. Others, Market Value (USD Million), and CAGR, 2027-2036F
28.2.4. By Application
28.2.4.1. Power Generation, Market Value (USD Million), and CAGR, 2027-2036F
28.2.4.2. Mobility & Transportation, Market Value (USD Million), and CAGR, 2027-2036F
28.2.4.3. Industry Energy, Market Value (USD Million), and CAGR, 2027-2036F
28.2.4.4. Industry Feedstock, Market Value (USD Million), and CAGR, 2027-2036F
28.2.4.5. Building Heating & Power, Market Value (USD Million), and CAGR, 2027-2036F
28.2.4.6. Industrial Hydrogen Applications, Market Value (USD Million), and CAGR, 2027-2036F
28.2.4.7. Others, Market Value (USD Million), and CAGR, 2027-2036F
28.2.5. By End user
28.2.5.1. Energy & Power, Market Value (USD Million), and CAGR, 2027-2036F
28.2.5.2. Chemical Industry, Market Value (USD Million), and CAGR, 2027-2036F
28.2.5.3. Oil & Gas Industry, Market Value (USD Million), and CAGR, 2027-2036F
28.2.5.4. Metals & Heavy Industry, Market Value (USD Million), and CAGR, 2027-2036F
28.2.5.5. Mobility & Infrastructure, Market Value (USD Million), and CAGR, 2027-2036F
28.2.5.6. Others (Electronics & Semiconductor), Market Value (USD Million), and CAGR, 2027-2036F
28.2.6. Country Level Analysis, Value (USD Million)
28.2.6.1. U.S. Market Value (USD Million) and CAGR & Y-o-Y Growth Trend, 2027-2036F
28.2.6.2. Canada Market Value (USD Million) and CAGR & Y-o-Y Growth Trend, 2027-2036F
29. Europe Market
29.1. Overview
29.1.1. Market Value (USD Million), Current and Future Projections, 2027-2036
29.1.2. Increment $ Opportunity Assessment, 2027-2036
29.2. Segmentation (USD Million), 2027-2036, By
29.2.1. By Capacity
29.2.1.1. ≤500 kW, Market Value (USD Million), and CAGR, 2027-2036F
29.2.1.2. >500 kW – 2 MW, Market Value (USD Million), and CAGR, 2027-2036F
29.2.1.3. >2 - 5 MW, Market Value (USD Million), and CAGR, 2027-2036F
29.2.1.4. Above 5 MW, Market Value (USD Million), and CAGR, 2027-2036F
29.2.2. By Component
29.2.2.1. Stack, Market Value (USD Million), and CAGR, 2027-2036F
29.2.2.1.1. Interconnect, Market Value (USD Million), and CAGR, 2027-2036F
29.2.2.1.2. Cell Frame, Market Value (USD Million), and CAGR, 2027-2036F
29.2.2.1.3. End Plates, Market Value (USD Million), and CAGR, 2027-2036F
29.2.2.1.4. Others, Market Value (USD Million), and CAGR, 2027-2036F
29.2.2.2. Balance of Plant (BoP), Market Value (USD Million), and CAGR, 2027-2036F

29.2.3. By Membrane Type
29.2.3.1. Perfluorosulfonic Acid (PFSA), Market Value (USD Million), and CAGR, 2027-2036F
29.2.3.2. Composite / Hybrid Membranes, Market Value (USD Million), and CAGR, 2027-2036F
29.2.3.3. Hydrocarbon-Based Membranes, Market Value (USD Million), and CAGR, 2027-2036F
29.2.3.4. Others, Market Value (USD Million), and CAGR, 2027-2036F
29.2.4. By Application
29.2.4.1. Power Generation, Market Value (USD Million), and CAGR, 2027-2036F
29.2.4.2. Mobility & Transportation, Market Value (USD Million), and CAGR, 2027-2036F
29.2.4.3. Industry Energy, Market Value (USD Million), and CAGR, 2027-2036F
29.2.4.4. Industry Feedstock, Market Value (USD Million), and CAGR, 2027-2036F
29.2.4.5. Building Heating & Power, Market Value (USD Million), and CAGR, 2027-2036F
29.2.4.6. Industrial Hydrogen Applications, Market Value (USD Million), and CAGR, 2027-2036F
29.2.4.7. Others, Market Value (USD Million), and CAGR, 2027-2036F
29.2.5. By End user
29.2.5.1. Energy & Power, Market Value (USD Million), and CAGR, 2027-2036F
29.2.5.2. Chemical Industry, Market Value (USD Million), and CAGR, 2027-2036F
29.2.5.3. Oil & Gas Industry, Market Value (USD Million), and CAGR, 2027-2036F
29.2.5.4. Metals & Heavy Industry, Market Value (USD Million), and CAGR, 2027-2036F
29.2.5.5. Mobility & Infrastructure, Market Value (USD Million), and CAGR, 2027-2036F
29.2.5.6. Others (Electronics & Semiconductor), Market Value (USD Million), and CAGR, 2027-2036F
29.2.6. Country Level Analysis, Value (USD Million)
29.2.6.1. UK Market Value (USD Million) and CAGR & Y-o-Y Growth Trend, 2027-2036F
29.2.6.2. Germany Market Value (USD Million) and CAGR & Y-o-Y Growth Trend, 2027-2036F
29.2.6.3. France Market Value (USD Million) and CAGR & Y-o-Y Growth Trend, 2027-2036F
29.2.6.4. Italy Market Value (USD Million) and CAGR & Y-o-Y Growth Trend, 2027-2036F
29.2.6.5. Spain Market Value (USD Million) and CAGR & Y-o-Y Growth Trend, 2027-2036F
29.2.6.6. Netherlands Market Value (USD Million) and CAGR & Y-o-Y Growth Trend, 2027-2036F
29.2.6.7. Russia Market Value (USD Million) and CAGR & Y-o-Y Growth Trend, 2027-2036F
29.2.6.8. Switzerland Market Value (USD Million) and CAGR & Y-o-Y Growth Trend, 2027-2036F
29.2.6.9. Poland Market Value (USD Million) and CAGR & Y-o-Y Growth Trend, 2027-2036F
29.2.6.10. Belgium Market Value (USD Million) and CAGR & Y-o-Y Growth Trend, 2027-2036F
29.2.6.11. Rest of Europe Market Value (USD Million) and CAGR & Y-o-Y Growth Trend, 2027-2036F
30. Asia Pacific Market
30.1. Overview
30.1.1. Market Value (USD Million), Current and Future Projections, 2027-2036
30.1.2. Increment $ Opportunity Assessment, 2027-2036
30.2. Segmentation (USD Million), 2027-2036, By
30.2.1. By Capacity
30.2.1.1. ≤500 kW, Market Value (USD Million), and CAGR, 2027-2036F
30.2.1.2. >500 kW – 2 MW, Market Value (USD Million), and CAGR, 2027-2036F
30.2.1.3. >2 - 5 MW, Market Value (USD Million), and CAGR, 2027-2036F
30.2.1.4. Above 5 MW, Market Value (USD Million), and CAGR, 2027-2036F
30.2.2. By Component
30.2.2.1. Stack, Market Value (USD Million), and CAGR, 2027-2036F
30.2.2.1.1. Interconnect, Market Value (USD Million), and CAGR, 2027-2036F
30.2.2.1.2. Cell Frame, Market Value (USD Million), and CAGR, 2027-2036F
30.2.2.1.3. End Plates, Market Value (USD Million), and CAGR, 2027-2036F
30.2.2.1.4. Others, Market Value (USD Million), and CAGR, 2027-2036F
30.2.2.2. Balance of Plant (BoP), Market Value (USD Million), and CAGR, 2027-2036F

30.2.3. By Membrane Type
30.2.3.1. Perfluorosulfonic Acid (PFSA), Market Value (USD Million), and CAGR, 2027-2036F
30.2.3.2. Composite / Hybrid Membranes, Market Value (USD Million), and CAGR, 2027-2036F
30.2.3.3. Hydrocarbon-Based Membranes, Market Value (USD Million), and CAGR, 2027-2036F
30.2.3.4. Others, Market Value (USD Million), and CAGR, 2027-2036F
30.2.4. By Application
30.2.4.1. Power Generation, Market Value (USD Million), and CAGR, 2027-2036F
30.2.4.2. Mobility & Transportation, Market Value (USD Million), and CAGR, 2027-2036F
30.2.4.3. Industry Energy, Market Value (USD Million), and CAGR, 2027-2036F
30.2.4.4. Industry Feedstock, Market Value (USD Million), and CAGR, 2027-2036F
30.2.4.5. Building Heating & Power, Market Value (USD Million), and CAGR, 2027-2036F
30.2.4.6. Industrial Hydrogen Applications, Market Value (USD Million), and CAGR, 2027-2036F
30.2.4.7. Others, Market Value (USD Million), and CAGR, 2027-2036F
30.2.5. By End user
30.2.5.1. Energy & Power, Market Value (USD Million), and CAGR, 2027-2036F
30.2.5.2. Chemical Industry, Market Value (USD Million), and CAGR, 2027-2036F
30.2.5.3. Oil & Gas Industry, Market Value (USD Million), and CAGR, 2027-2036F
30.2.5.4. Metals & Heavy Industry, Market Value (USD Million), and CAGR, 2027-2036F
30.2.5.5. Mobility & Infrastructure, Market Value (USD Million), and CAGR, 2027-2036F
30.2.5.6. Others (Electronics & Semiconductor), Market Value (USD Million), and CAGR, 2027-2036F
30.2.6. Country Level Analysis, Value (USD Million)
30.2.6.1. China Market Value (USD Million) and CAGR & Y-o-Y Growth Trend, 2027-2036F
30.2.6.2. Japan Market Value (USD Million) and CAGR & Y-o-Y Growth Trend, 2027-2036F
30.2.6.3. India Market Value (USD Million) and CAGR & Y-o-Y Growth Trend, 2027-2036F
30.2.6.4. South Korea Market Value (USD Million) and CAGR & Y-o-Y Growth Trend, 2027-2036F
30.2.6.5. Australia Market Value (USD Million) and CAGR & Y-o-Y Growth Trend, 2027-2036F
30.2.6.6. Indonesia Market Value (USD Million) and CAGR & Y-o-Y Growth Trend, 2027-2036F
30.2.6.7. Malaysia Market Value (USD Million) and CAGR & Y-o-Y Growth Trend, 2027-2036F
30.2.6.8. Vietnam Market Value (USD Million) and CAGR & Y-o-Y Growth Trend, 2027-2036F
30.2.6.9. Thailand Market Value (USD Million) and CAGR & Y-o-Y Growth Trend, 2027-2036F
30.2.6.10. Singapore Market Value (USD Million) and CAGR & Y-o-Y Growth Trend, 2027-2036F
30.2.6.11. New Zealand Market Value (USD Million) and CAGR & Y-o-Y Growth Trend, 2027-2036F
30.2.6.12. Rest of Asia Pacific Excluding Japan Market Value (USD Million) and CAGR & Y-o-Y Growth Trend, 2027-2036F

31. Latin America Market
31.1. Overview
31.1.1. Market Value (USD Million), Current and Future Projections, 2027-2036
31.1.2. Increment $ Opportunity Assessment, 2027-2036
31.1.3. Year-on-Year Growth Forecast (%)
31.2. Segmentation (USD Million), 2027-2036, By
31.2.1. By Capacity
31.2.1.1. ≤500 kW, Market Value (USD Million), and CAGR, 2027-2036F
31.2.1.2. >500 kW – 2 MW, Market Value (USD Million), and CAGR, 2027-2036F
31.2.1.3. >2 - 5 MW, Market Value (USD Million), and CAGR, 2027-2036F
31.2.1.4. Above 5 MW, Market Value (USD Million), and CAGR, 2027-2036F
31.2.2. By Component
31.2.2.1. Stack, Market Value (USD Million), and CAGR, 2027-2036F
31.2.2.1.1. Interconnect, Market Value (USD Million), and CAGR, 2027-2036F
31.2.2.1.2. Cell Frame, Market Value (USD Million), and CAGR, 2027-2036F
31.2.2.1.3. End Plates, Market Value (USD Million), and CAGR, 2027-2036F
31.2.2.1.4. Others, Market Value (USD Million), and CAGR, 2027-2036F
31.2.2.2. Balance of Plant (BoP), Market Value (USD Million), and CAGR, 2027-2036F

31.2.3. By Membrane Type
31.2.3.1. Perfluorosulfonic Acid (PFSA), Market Value (USD Million), and CAGR, 2027-2036F
31.2.3.2. Composite / Hybrid Membranes, Market Value (USD Million), and CAGR, 2027-2036F
31.2.3.3. Hydrocarbon-Based Membranes, Market Value (USD Million), and CAGR, 2027-2036F
31.2.3.4. Others, Market Value (USD Million), and CAGR, 2027-2036F
31.2.4. By Application
31.2.4.1. Power Generation, Market Value (USD Million), and CAGR, 2027-2036F
31.2.4.2. Mobility & Transportation, Market Value (USD Million), and CAGR, 2027-2036F
31.2.4.3. Industry Energy, Market Value (USD Million), and CAGR, 2027-2036F
31.2.4.4. Industry Feedstock, Market Value (USD Million), and CAGR, 2027-2036F
31.2.4.5. Building Heating & Power, Market Value (USD Million), and CAGR, 2027-2036F
31.2.4.6. Industrial Hydrogen Applications, Market Value (USD Million), and CAGR, 2027-2036F
31.2.4.7. Others, Market Value (USD Million), and CAGR, 2027-2036F
31.2.5. By End user
31.2.5.1. Energy & Power, Market Value (USD Million), and CAGR, 2027-2036F
31.2.5.2. Chemical Industry, Market Value (USD Million), and CAGR, 2027-2036F
31.2.5.3. Oil & Gas Industry, Market Value (USD Million), and CAGR, 2027-2036F
31.2.5.4. Metals & Heavy Industry, Market Value (USD Million), and CAGR, 2027-2036F
31.2.5.5. Mobility & Infrastructure, Market Value (USD Million), and CAGR, 2027-2036F
31.2.5.6. Others (Electronics & Semiconductor), Market Value (USD Million), and CAGR, 2027-2036F
31.2.6. Country Level Analysis, Value (USD Million)
31.2.6.1. Brazil Market Value (USD Million) and CAGR & Y-o-Y Growth Trend, 2027-2036F
31.2.6.2. Argentina Market Value (USD Million) and CAGR & Y-o-Y Growth Trend, 2027-2036F
31.2.6.3. Mexico Market Value (USD Million) and CAGR & Y-o-Y Growth Trend, 2027-2036F
31.2.6.4. Rest of Latin America Market Value (USD Million) and CAGR & Y-o-Y Growth Trend, 2027-2036F
32. Middle East & Africa Market
32.1. Overview
32.1.1. Market Value (USD Million), Current and Future Projections, 2027-2036
32.1.2. Increment $ Opportunity Assessment, 2027-2036
32.1.3. Year-on-Year Growth Forecast (%)
32.2. Segmentation (USD Million), 2027-2036, By
32.2.1. By Capacity
32.2.1.1. ≤500 kW, Market Value (USD Million), and CAGR, 2027-2036F
32.2.1.2. >500 kW – 2 MW, Market Value (USD Million), and CAGR, 2027-2036F
32.2.1.3. >2 - 5 MW, Market Value (USD Million), and CAGR, 2027-2036F
32.2.1.4. Above 5 MW, Market Value (USD Million), and CAGR, 2027-2036F
32.2.2. By Component
32.2.2.1. Stack, Market Value (USD Million), and CAGR, 2027-2036F
32.2.2.1.1. Interconnect, Market Value (USD Million), and CAGR, 2027-2036F
32.2.2.1.2. Cell Frame, Market Value (USD Million), and CAGR, 2027-2036F
32.2.2.1.3. End Plates, Market Value (USD Million), and CAGR, 2027-2036F
32.2.2.1.4. Others, Market Value (USD Million), and CAGR, 2027-2036F
32.2.2.2. Balance of Plant (BoP), Market Value (USD Million), and CAGR, 2027-2036F

32.2.3. By Membrane Type
32.2.3.1. Perfluorosulfonic Acid (PFSA), Market Value (USD Million), and CAGR, 2027-2036F
32.2.3.2. Composite / Hybrid Membranes, Market Value (USD Million), and CAGR, 2027-2036F
32.2.3.3. Hydrocarbon-Based Membranes, Market Value (USD Million), and CAGR, 2027-2036F
32.2.3.4. Others, Market Value (USD Million), and CAGR, 2027-2036F
32.2.4. By Application
32.2.4.1. Power Generation, Market Value (USD Million), and CAGR, 2027-2036F
32.2.4.2. Mobility & Transportation, Market Value (USD Million), and CAGR, 2027-2036F
32.2.4.3. Industry Energy, Market Value (USD Million), and CAGR, 2027-2036F
32.2.4.4. Industry Feedstock, Market Value (USD Million), and CAGR, 2027-2036F
32.2.4.5. Building Heating & Power, Market Value (USD Million), and CAGR, 2027-2036F
32.2.4.6. Industrial Hydrogen Applications, Market Value (USD Million), and CAGR, 2027-2036F
32.2.4.7. Others, Market Value (USD Million), and CAGR, 2027-2036F
32.2.5. By End user
32.2.5.1. Energy & Power, Market Value (USD Million), and CAGR, 2027-2036F
32.2.5.2. Chemical Industry, Market Value (USD Million), and CAGR, 2027-2036F
32.2.5.3. Oil & Gas Industry, Market Value (USD Million), and CAGR, 2027-2036F
32.2.5.4. Metals & Heavy Industry, Market Value (USD Million), and CAGR, 2027-2036F
32.2.5.5. Mobility & Infrastructure, Market Value (USD Million), and CAGR, 2027-2036F
32.2.5.6. Others (Electronics & Semiconductor), Market Value (USD Million), and CAGR, 2027-2036F
32.2.6. Country Level Analysis, Value (USD Million)
32.2.6.1. Saudi Arabia Market Value (USD Million) and CAGR & Y-o-Y Growth Trend, 2027-2036F
32.2.6.2. UAE Market Value (USD Million) and CAGR & Y-o-Y Growth Trend, 2027-2036F
32.2.6.3. Israel Market Value (USD Million) and CAGR & Y-o-Y Growth Trend, 2027-2036F
32.2.6.4. Qatar Market Value (USD Million) and CAGR & Y-o-Y Growth Trend, 2027-2036F
32.2.6.5. Kuwait Market Value (USD Million) and CAGR & Y-o-Y Growth Trend, 2027-2036F
32.2.6.6. Oman Market Value (USD Million) and CAGR & Y-o-Y Growth Trend, 2027-2036F
32.2.6.7. South Africa Market Value (USD Million) and CAGR & Y-o-Y Growth Trend, 2027-2036F
32.2.6.8. Rest of Middle East & Africa Market Value (USD Million) and CAGR & Y-o-Y Growth Trend, 2027-2036F

33. Global Economic Scenario
33.1. World Economic Outlook
34. About Research Nester
34.1. Our Global Clientele
34.2. We Serve Clients Across World

2026 Market Size
$ 883.81 Mn
Base Year Value
2036 Forecast
$ 11.86 Bn
Projected by 2036
CAGR 2027-2036
29.59 %
Growth Rate
Leading Region
Europe
37.4% Share by 2036

PEM Electrolyzer Market Outlook:

PEM Electrolyzer Market size was valued at USD 883.81 million in 2026 and is projected to cross USD 11.86 billion by the end of 2036, expanding at more than 29.59% CAGR during the forecast period, i.e., 2027-2036. In 2027, the industry size of PEM electrolyzer is assessed at USD 1.15 billion.

PEM Electrolyzers Market Size
Discover Market Trends & Growth Opportunities:

The worldwide PEM electrolyzer market is expanding, based on several factors, including technological convergence, supply chain dynamics, trade facilities, regional hydrogen strategies, and suitable investment and funding opportunities. In this regard, electricity plays a huge role in the market growth, and as stated by the 2026 OECD data report, France is considered the topmost exporter of electricity, amounting to USD 8.2 billion, and Germany is the topmost importer with USD 7.1 billion. In addition, the global trade valuation was worth USD 62.7 billion, with 0.2% as the global trade share. Therefore, with a continuous supply of electricity, electrolyzer devices are gaining a power source. Moreover, based on this supply, there is a huge demand for electrical energy, which is also responsible for driving the market growth.

2024 Electrical Energy Global Import and Export Analysis

Countries/Components

Export (USD)

Import (USD)

France

8.2 billion

-

Germany

4.5 billion

7.1 billion

Switzerland

4.1 billion

-

Italy

-

5.1 billion

Hungary

-

3.7 billion

Global Trade Valuation

62.7 billion

Global Trade Share

0.2%

Source: OEC

Furthermore, the vertical integration of manufacturing models, repurposing lower-duty applications, digital twin adoption, and ensuring rapid deployment are a few trends that are responsible for positively impacting the market globally. As per an article published by the Decision Analytics Journal in March 2023, the digital twin industry size was estimated to be worth USD 8 billion as of 2022, which is further projected to expand at almost 25% by the end of 2032. Based on this growth, the industry is set to expand by nearly USD 32 billion by the end of 2026, with 60% of organizational executives planning to implement the technology in their operations by 2028, thus enhancing the market exposure.

Key PEM Electrolyzer Market Insights Summary:

  • Regional Highlights:

    • Europe is projected to command 37.4% of the pem electrolyzer market by 2036, underpinned by strong decarbonization approaches, a suitable regulatory framework, comprehensive national hydrogen strategies, industrial collaboration, and continuous development in electrolyzer technology
    • Asia Pacific is anticipated to secure 32% market share by 2036, stimulated by strong hydrogen roadmaps, state-funded infrastructure programs, and rapid manufacturing expansion
  • Segment Insights:

    • The >500 kW–2 MW segment in the pem electrolyzer market is projected to account for 41.7% market share by 2036, bolstered by its optimal balance between production capacity and investment cost
    • The Energy and Power segment is expected to hold 29.4% of the market share by 2036, fueled by the growing role of green hydrogen in supporting renewable energy integration
  • Key Growth Trends:

    • Industrial heat decarbonization
    • Increase in green maritime fuel
  • Major Challenges:

    • Performance degradation under dynamic operating conditions
    • Immature balance-of-plant and aftermarket ecosystem
  • Key Players: Air Liquide, Cummins Inc, Elogen, FEST Group, GreenH Electrolysis, H2Next Pvt Ltd., HOVOGEN, HyAxiom, Inc., HYDGEN, Hygreen Energy, Hyster, ITM Power plc, Nel ASA, Ohmium, Plug Power Inc., Quest One, Siemens Energy.

Global PEM Electrolyzer Market Forecast and Regional Outlook:

  • Market Size & Growth Projections:

    • 2026 Market Size: USD 883.81 million
    • 2027 Market Size: USD 1.15 billion
    • Projected Market Size: USD 11.86 billion by 2036
    • Growth Forecasts: 29.59% CAGR (2027-2036)
  • Key Regional Dynamics:

    • Largest Region: Europe (37.4% share by 2036)
    • Fastest Growing Region: Asia Pacific
    • Dominating Countries: China, Germany, United States, Japan, South Korea
    • Emerging Countries: India, Australia, Canada, Saudi Arabia, United Arab Emirates
  • Last updated on : 14 July, 2026

Growth Drivers

  • Industrial heat decarbonization: Beyond nitrogen as a chemical feedstock, this particular driver is positively fueling the market globally and playing an essential role in industrial temperature heat processes. As stated in an article published by the IEA Organization in 2025, heat consumption expanded by 6% globally as of 2024. Besides, almost 80% of worldwide growth in renewable heat utilization was in the bioenergy form as well as renewable electricity, thereby creating an acceleration in renewable consumption and lowering carbon emissions.
  • Increase in green maritime fuel: The global Maritime Organization has tightened emissions regulations, which is creating a distinct driver for expanding the market through e-methanol and green ammonia pathways. As per a data report published by the UNFCCC Organization in January 2026, green ammonia is very expensive and rare, making up only 1% of the worldwide industry, and the expense amounts to 2 to 6 times, in comparison to traditional ammonia. Meanwhile, based on the February 2025 World Economic Forum article, the International Maritime Organization (IMO) is poised to demand a 20% reduction in shipping emissions by the end of 2030 and further escalate to 70% to 80% by 2040, resulting in a surge in e-methanol, which is also driving the overall market growth.
  • Grid modernization initiatives: The centralized grid-connected utility’s upliftment is primarily attributed to the massive production of electricity at suitable facilities, such as nuclear, hydro, solar, and coal factories, far from end users, which is readily transported through high-voltage lines. According to official statistics published by the Department of Energy (DOE) in July 2024, the grid modernization portfolio assists in integrating electricity sources, enhances security, solves energy risks, and offers a crucial platform for innovation and competitiveness, thus directly supporting the intention of achieving a 50% to 52% of greenhouse gas reduction by the end of 2030, thereby driving the centralized grid-connected utility’s growth.

Challenges

  • Performance degradation under dynamic operating conditions: While PEM electrolyzers are marketed for their compatibility with intermittent renewables, real-world field data reveals accelerated membrane and catalyst degradation when subjected to frequent power fluctuations, standby states, and partial load operations. Besides, end users operate the asset conservatively to extend lifespan, thereby losing the flexibility advantage, or accept premature stack replacement costs that erode project economics, thus creating a negative impact on the market globally.
  • Immature balance-of-plant and aftermarket ecosystem: Beyond the stack itself, the broader ecosystem of compressors, deionized water treatment units, thermal management systems, and hydrogen purification trains remains fragmented and underdeveloped for the market requirements. Unlike mature industrial gas technologies with standardized maintenance protocols, PEM systems require specialized field service engineers, proprietary replacement parts, and long lead times for critical spares. This immaturity introduces unplanned downtime risks, extended repair cycles, and higher operational expenditures, thus causing a hindrance in market growth.

PEM Electrolyzer Market Size and Forecast:

Report Attribute Details

Base Year

2026

Forecast Year

2027-2036

CAGR

29.59%

Base Year Market Size (2026)

USD 883.81 million

Forecast Year Market Size (2036)

USD 11.86 billion

Regional Scope

  • North America (U.S. and Canada)
  • Asia Pacific (China, India, Japan, Indonesia, Malaysia, Australia, South Korea, Rest of Asia Pacific)
  • Europe (UK, Germany, France, Italy, Spain, Russia, NORDIC, Rest of Europe)
  • Latin America (Mexico, Argentina, Brazil, Rest of Latin America)
  • Middle East and Africa (Israel, GCC, North Africa, South Africa, Rest of the Middle East and Africa)

Access Detailed Forecasts & Data-Driven Insights:

PEM Electrolyzer Market Segmentation:

Capacity Segment Analysis

The >500 kW–2 MW capacity segment is projected to capture 41.7% of the market share through 2036, as it offers an optimal balance between production capacity and investment cost. The operational flexibility and scalability also contribute to the segmental growth. Industries such as chemical manufacturing, refineries, electronics, food processing, and mobility fueling stations increasingly prefer this capacity range to support decarbonization initiatives while maintaining manageable project economics. In March 2025, FEST GmbH announced an order for its 2 MW PEM electrolysis system, gEl 400. Stadtwerke Düsseldorf AG is set to use it to make hydrogen for fuel cell buses and trucks, using biogenic electricity from its waste incineration plant. This is an important step toward cleaner urban transport.

End user Segment Analysis

The energy and power segment is anticipated to account for the 29.4% share of the PEM electrolyzer market due to the growing role of green hydrogen in supporting renewable energy integration. Grid stability and long-duration energy storage are also propelling the use of PEM electrolyzers in the energy and power sector. Ember Energy reports that solar power rose by a record 636 TWh in 2025, reaching 2,778 TWh, which is 30% higher than in 2024. It also met 75% of the increase in global electricity demand that year. Thus, as electricity generation from solar and wind sources continues to expand, the demand for PEM electrolyzers is set to boom.

Application Segment Analysis

The industrial hydrogen applications segment is estimated to hold 22.2% of the global market share throughout the forecast period. The segment’s development is highly propelled by the aspect of not emitting polluting gases during production and combustion, and it is easy to store, thereby permitting it to be utilized for different purposes. Based on government estimates published by the PIB in November 2025, India has significantly targeted 5 MMT of green hydrogen production by the end of 2030. Additionally, hydrogen mobility pilots were unveiled across 10 routes that involve 37 fuel cell and hydrogen internal combustion engine vehicles, thus positively contributing towards the sub-segment’s expansion.

Our in-depth analysis of the PEM electrolyzer market includes the following segments:

Segments

Subsegments

Capacity

  • ≤500 kW
  • >500 kW – 2 MW
  • >2 - 5 MW
  • Above 5 MW

Component


  • Stack
    • Interconnect
    • Cell Frame
    • End Plates
    • Others
  • Balance of Plant (BoP)

Membrane Type

  • Perfluorosulfonic Acid (PFSA)
  • Composite / Hybrid Membranes
  • Hydrocarbon-Based Membranes
  • Others

Application

  • Power Generation
  • Mobility & Transportation
  • Industry Energy
  • Industry Feedstock
  • Building Heating & Power
  • Industrial Hydrogen Applications
  • Others

End user

  • Energy & Power
  • Chemical Industry
  • Oil & Gas Industry
  • Metals & Heavy Industry
  • Mobility & Infrastructure
  • Others (Electronics & Semiconductor)
Vishnu Nair

Vishnu Nair

Head - Global Business Development

Customize this report to your requirements — connect with our consultant for personalized insights and options.


PEM Electrolyzer Market - Regional Analysis

Europe Market Insights

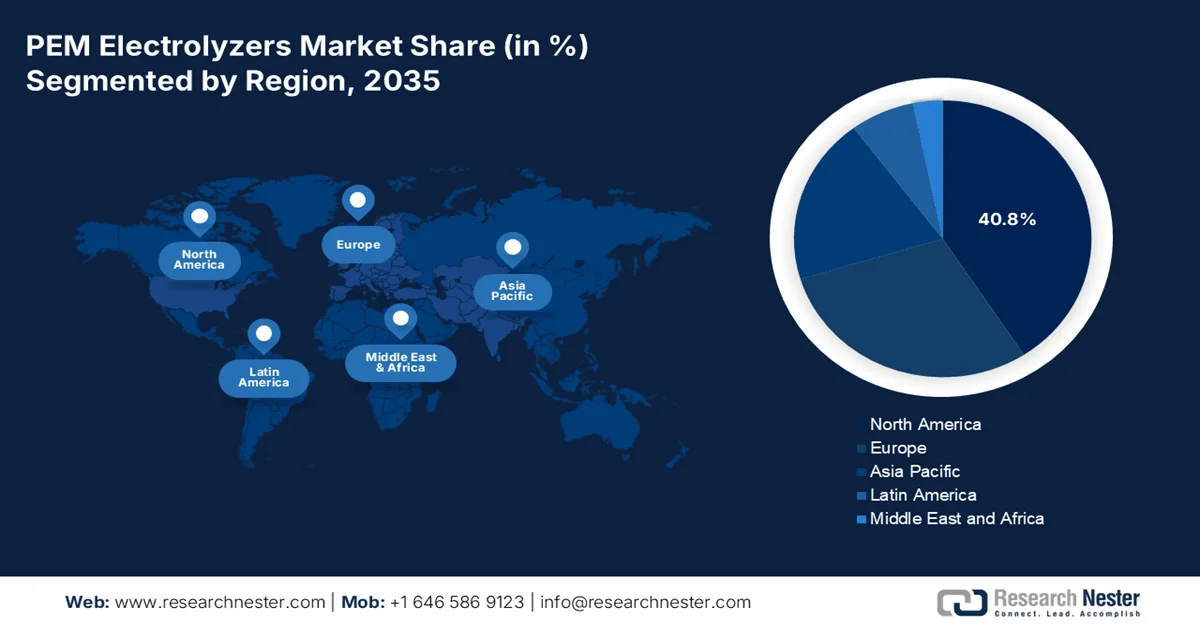
Europe is projected to capture 37.4% of the global PEM electrolyzer market share throughout the forecast period. The market growth is set to be driven by strong decarbonization approaches, a suitable regulatory framework, comprehensive national hydrogen strategies across different countries, industrial collaboration, and continuous development in electrolyzer technology. According to official statistics published by the European Commission in 2025, hydrogen accounted for 2.05 of the region’s total energy consumption as of 2022. Besides, 96% of hydrogen has been produced with natural gas, leading to a significant amount of carbon dioxide emissions. Moreover, the REPowerEU Strategy is focused on producing and importing 10 million tons of hydrogen by the end of 2030, which is positively impacting the market growth.

2024 Hydrogen Export and Import Analysis in Europe

Countries

Export (USD)

Import (USD)

Belgium

36.7 million

4.0 million

Netherlands

25.5 million

36.3 million

Germany

17.6 million

8.6 million

France

6.5 million

17.9 million

Poland

3.6 million

2.5 million

Slovakia

3.1 million

1.8 million

UK

1.0 million

7.6 million

Source: OEC

The PEM electrolyzer market in Germany is estimated to reach USD 1,191.05 million by 2036, owing to its huge industrial base, reduction in industrial emissions, technological innovations, organizational collaborations, stack durability, catalyst efficiency, and the integration of electrolyzers. As stated in an article published by Clean Energy Wire Organization in April 2026, the country has significantly aimed to lower emissions by almost 65% by the end of 2030, as well as 88% by 2040. Besides, within the same timeline, the forestry and land use in the country is predicted to lower carbon dioxide equivalent emissions by 25 million and 40 million by 2045, thereby denoting an optimistic outlook for the market’s exposure.

Spain’s market for PEM electrolyzers is projected to increase at a CAGR of 28.74% from 2027 to 2036. The presence of government targets, abundance in renewable energy, an increase in the manufacturing industry, suitable industrial applications, and company collaborations are a few trends that are driving the market. As per the July 2024 ITA article, industrial materials and supplies account for the largest share of U.S.-based exports to the country as of 2022, catering to 42% of overall exports. This is readily followed by 5% for financial services, 7% for capital goods, and 16% for automotive. Besides, the service sector plays a crucial role in the economy, deliberately comprising an estimated 70% of the country’s GDP, which is positively fueling the market exposure.
Asia Pacific Market Insights

Asia Pacific is expected to capture 32% of the global market share by the end of the forecast period. The market’s development is highly propelled by the existence of strong hydrogen roadmaps across countries, such as India, South Korea, Japan, and China, followed by state-funded infrastructure programs and rapid manufacturing expansion. For instance, the April 2024 ITA article noted that India’s manufacturing industry accounts for nearly 16% to 17% at constant prices, as well as 14% at current prices. Moreover, the National Manufacturing Policy of the Government of India aimed to boost the manufacturing share in gross domestic product (GDP) to 25% as of 2025, which is positively impacting the market development in the region.

The PEM electrolyzer market in China is set to reach USD 1,506.64 million by 2036, owing to integrated industrial policies, upscaling green hydrogen, leveraging the manufacturing capacity, the presence of national mandates, and a decline in renewable electricity expenses. As stated in the November 2025 State Council Information Office article, the country’s value-added industrial output effectively expanded by 4.9% year-on-year (YoY) in October 2025. Besides, there was an upsurge in domestic industrial output by 6.1%, with a yearly business turnover of almost USD 2.8 million, thereby ensuring market expansion.

The Japan PEM electrolyzer market is estimated at USD 44.30 million in 2027. The aspects of ambitious government policies, industrial partnership, and technological leadership are a few trends that are proliferating and developing the market in Japan. As per the May 2024 CSIS Organization article, the country comprises hydrocarbon resources and is highly reliant on energy imports, with coal, natural gas, and oil imports that accounted for 90% of the overall energy supply as of 2022. Moreover, in the same year, solar energy accounted for 10% of electricity generation, positioning the country’s installed solar capacity as the third-largest globally, and in turn denoting a huge growth opportunity for the market to generate electricity for powering electrolyzers.

North America Market Insights

North America in the global market is anticipated to garner a share of 21.4% by the end of 2036, owing to renewable energy, robust government support, and green hydrogen facilities. As per the May 2026 DOE article, renewable energy generates more than 20% of overall electricity, particularly in the U.S. Additionally, the yearly renewable energy generation exceeded coal as of 2022, while the domestic solar energy generation surpassed coal by 75%, along with wind by 11% by the end of 2025. Besides, the U.S. is considered a resource-rich nation in the overall region with immense renewable energy resources for generating over 100 times the amount of electricity that the entire population utilizes every year, which is highly responsible for boosting the market.

Renewable Energy Sources Capacity in the U.S., 2022

Source Type

Capacity %

Wind

10.3

Hydropower

6.0

Solar

3.4

Biomass

1.2

Geothermal

0.4

Source: DOE

The PEM electrolyzer market in the U.S. is set to reach USD 2,131.47 million by 2036, owing to federal tax incentives, an increase in hydrogen infrastructure, technological investments, an escalation in commercial-scale demonstrations, and the growing demand for decarbonized feedstock. As stated in an article published by NLM in November 2023, the federal government in the country established the objective of electrifying 50% of the newest light-duty vehicle sales by the end of 2030, and further diminishing nationwide greenhouse gas emissions by 50% to 52% by 2030. Therefore, with this suitable intention, the country is highly focused on a decarbonization approach, which is driving the market’s growth.

The Canada PEM electrolyzer market is anticipated to expand at a CAGR of 29.08% during the forecast period. The wide-ranging federal policy support, massive renewable energy resources, carbon intensity programs, a surge in clean fuel production, and reducing greenhouse gas emissions every year are certain factors that are responsible for fueling the market in Canada. As per an article published by Natural Resources Canada in January 2026, there has been a generous investment of USD 1.5 billion for more than 5 years. The purpose was to establish a Clean Fuels Fund for de-risking capital investment that is essential to develop new and expanded existing clean fuel production infrastructures, which includes facility conversions, thereby making it suitable for enhancing the market upliftment.

PEM Electrolyzers Market Share
Get Strategic Analysis by Region Now:

Key PEM Electrolyzer Market Players:

    Below is the list of the key players, among several others, operating in the global market:

    • Air Liquide (France)
    • Cummins Inc (U.S.)
    • Elogen (France)
    • FEST Group (Germany)
    • GreenH Electrolysis (India)
    • H2Next Pvt Ltd. (India)
    • HOVOGEN (China)
    • HyAxiom, Inc. (Doosan Corporation.) (U.S.)
    • HYDGEN (Singapore)
    • Hygreen Energy (China)
    • Hyster (Norway)
    • ITM Power plc (England)
    • Nel ASA (Norway)
    • Ohmium (U.S.)
    • Plug Power Inc. (U.S.)
    • Quest One (Germany)
    • Siemens Energy (Germany)
      • Company Overview
      • Business Strategy
      • Key Product Offerings
      • Financial Performance
      • Key Performance Indicators
      • Risk Analysis
      • Recent Development
      • Regional Presence
      • SWOT Analysis

    The PEM electrolyzer market is increasingly competitive, with Europe and North America-based manufacturers holding a strong technological lead in stack efficiency and membrane durability, while China-specific producers are rapidly scaling manufacturing capacity to capture cost advantages. Key players are pursuing vertical integration strategies to secure supply chains for critical raw materials, particularly iridium and platinum, which remain the primary bottleneck for PEM scale-up. Besides, in June 2025, ITM Power launched Hydropulse GmbH, which is a wholly owned subsidiary based in Germany for developing, owning, and operating decentralised green hydrogen production facilities, thus proliferating the PEM electrolyzers industry growth.

    Corporate Landscape of the Global Market:

    • Air Liquide is a leading French multinational industrial gases and engineering company and ranks among the world's largest suppliers of industrial and medical gases. The company operates through two primary business segments, Gas & Services and Engineering & Technologies, delivering advanced solutions across the industrial gas value chain. Air Liquide has established a strong presence in the hydrogen economy through its development of Proton Exchange Membrane (PEM) electrolyzer technologies and integrated hydrogen production systems, supporting large-scale green hydrogen projects and the global transition toward low-carbon energy.
    • Cummins Inc. is a leading global power technology company engaged in the design, manufacture, and distribution of a broad portfolio of advanced power solutions, including diesel and natural gas engines, electric powertrains, and power generation systems. The company's diversified portfolio encompasses air handling systems, after-treatment technologies, fuel systems, turbochargers, transmissions, batteries, electrified power solutions, and PEM electrolyzers. Through continuous investment in hydrogen technologies, Cummins is expanding its presence in the clean energy sector while strengthening its position in sustainable power generation.
    • Elogen is a leading French hydrogen technology company specializing in the design, manufacture, and maintenance of Proton Exchange Membrane (PEM) electrolyzers for green hydrogen production. The company focuses on delivering high-performance electrolysis technologies for industrial, mobility, and renewable energy applications. Its portfolio includes containerized electrolyzers, high-capacity electrolysis systems, and comprehensive lifecycle maintenance services, enabling customers to deploy efficient and scalable hydrogen production solutions.
    • FEST GmbH is a Germany-based engineering and renewable energy company specializing in PEM electrolysis, industrial automation, digitalization, and integrated hydrogen technologies. Leveraging its engineering expertise, the company develops complete hydrogen production solutions that support the expansion of sustainable hydrogen ecosystems. Its portfolio includes PEM electrolyzers, hydrogen refueling stations, and turnkey hydrogen production systems, providing end-to-end solutions for industrial and mobility applications.
    • GreenH Electrolysis is a leading Indian hydrogen technology company focused on accelerating the green hydrogen economy through the development and manufacture of PEM electrolyzers and integrated hydrogen production solutions. The company serves industrial and energy customers by delivering innovative technologies that support low-carbon hydrogen generation. Its comprehensive portfolio spans the hydrogen value chain, including PEM electrolyzers, integrated hydrogen production plants, and hydrogen refueling infrastructure, enabling the deployment of scalable and sustainable hydrogen projects.

Recent Developments

  • In April 2026, Nel Hydrogen received a purchase order for PEM electrolyzer equipment with a total value of almost USD 7 million, with the intention of utilizing it to produce hydrogen at a public utility, especially in the U.S.
  • In October 2025, Plug Power Inc. executed a binding supply agreement with Allied Biofuels FE LLC for nearly 2 gigawatts of Plug’s GenEco PEM electrolyzer systems for supporting ABF’s sustainable aviation fuel, as well as electro-sustainable aviation fuel and green diesel developments.
  • In March 2025, Cummins’ Accelera™ and GAIL Limited signed a memorandum of understanding for collaborating on zero-emissions and green hydrogen technologies, particularly in India, for leveraging expertise in hydrogen generation technology and establishing natural gas infrastructure.
  • Report ID: 8557
  • Published Date: Jul 14, 2026
  • Report Format: PDF, PPT
  • Explore a preview of key market trends and insights
  • Review sample data tables and segment breakdowns
  • Experience the quality of our visual data representations
  • Evaluate our report structure and research methodology
  • Get a glimpse of competitive landscape analysis
  • Understand how regional forecasts are presented
  • Assess the depth of company profiling and benchmarking
  • Preview how actionable insights can support your strategy

Explore real data and analysis

Frequently Asked Questions (FAQ)

In 2026, the industry size of PEM electrolyzer is estimated at USD 883.81 million.

The global PEM electrolyzer market is anticipated to surpass USD 11.86 billion by 2036, expanding at a CAGR of 29.59% during the forecast period, i.e., 2027 to 2036.

Some of the key players in the market are Air Liquide, Cummins Inc, Elogen, FEST Group, and GreenH Electrolysis.

The energy and power segment is significantly driving the growth of the end user segment and is expected to grow at a market share of 29.4% by 2036.

Europe is expected to dominate the global PEM electrolyzer market, accounting for a 37.4% share by 2036, driven by ambitious climate targets, the European Green Deal, REPowerEU, and various hydrogen funding programs.

Connect with our Expert

Shweta Singh

Shweta Singh

Research Analyst

PEM Electrolyzer Market
Report, 2027-2036
footer-bottom-logos