Online Microtransaction Market Outlook:
Online Microtransaction Market size was valued at USD 62.5 billion in 2025 and is projected to reach USD 128.9 billion by the end of 2035, rising at a CAGR of 7.5% during the forecast period, i.e., 2026-2035. In 2026, the industry size of online microtransaction is assessed at USD 67.2 billion.

The global online microtransaction market represents a significant and established revenue model within the digital content and interactive entertainment sectors. It is defined by the sale of virtual goods or advantages within a primary software product, typically a video game or mobile application. This market’s expansion is directly linked to the proliferation of high-speed internet connectivity, the ubiquity of smartphones, and the industry-wide shift towards live service and games as a service business model. The NLM study in November 2022 indicated that nearly 26.1% of free-to-play gamers have spent money on games. This reflects a sustained demand for digital interactive experiences and their associated monetization channels. Furthermore, the data also indicates that microtransaction-driven monetization is now a core revenue mechanism for online platforms, especially in online games and mobile applications.
Growth in this market is influenced by several structural and regulatory factors. The dominance of the specific platform ecosystems, namely mobile operating systems and closed gaming consoles, which control payment processing and distribution, establishes a defined framework for commercial transactions. The International Trade Administration data in 2023 depicted that the global gaming market reached USD 184 billion, with 3.2 billion people playing games worldwide. This data underscores the critical economic importance of the platform-controlled frameworks, where the gatekeepers can mandate technical standards and the commercial terms for all transactions. Further, supplier strategies and profit margins are intrinsically shaped by navigating these concentrated distribution channels. On the other hand, the regulatory developments necessitate rigorous compliance protocols and ethical design standards from suppliers operating in this space.
Key Online Microtransaction Market Insights Summary:
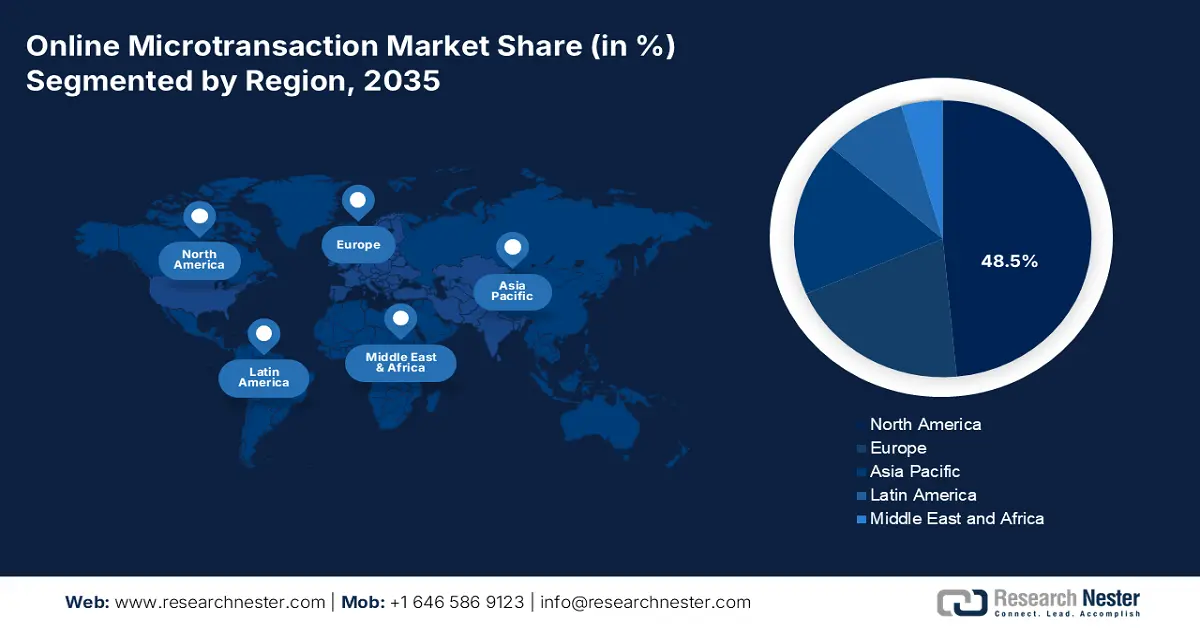
Regional Insights:
- North America is projected to command a 48.5% revenue share by 2035 in the online microtransaction market, underpinned by mature console and PC gaming ecosystems, widespread smartphone usage, and sophisticated digital payment adoption.
- Asia Pacific is anticipated to expand at a CAGR of 8.8% during 2026–2035, supported by its vast mobile-first gamer base, strong cultural acceptance of virtual goods, and the refinement of gacha-based monetization models.
Segment Insights:
- The Individual/Gamer end-user sub-segment is forecast to account for 98.3% share by 2035 in the online microtransaction market, strengthened by players’ pursuit of personalization, in-game progression, and social status signaling.
- The Free-to-Play revenue model sub-segment holds the largest share by 2035, sustained by the removal of upfront purchase barriers and reinforced through continuous engagement loops, live service content, and data-driven retention strategies.
Key Growth Trends:
- Ubiquity of high-speed internet and smartphone penetration
- Data analytics and personalized monetization
Major Challenges:
- Platform dominance and tax
- High technical infrastructure and security costs
Key Players: Google (U.S.), Tencent (China), Sony Interactive Entertainment (Japan), Microsoft (Xbox) (U.S.), NetEase (China), Nintendo (Japan), Activision Blizzard (King) (U.S.), Electronic Arts (U.S.), Sea Limited (Garena) (Singapore), NCSoft (South Korea), Nexon (South Korea), Supercell (Finland/Europe), Epic Games (U.S.), Take-Two Interactive (U.S.), Ubisoft (France/Europe), Roblox Corporation (U.S.), MiHoYo (HoYoverse) (China), Playtika (Israel), Pearl Abyss (South Korea).
Global Online Microtransaction Market Forecast and Regional Outlook:
Market Size & Growth Projections:
- 2025 Market Size: USD 62.5 billion
- 2026 Market Size: USD 67.2 billion
- Projected Market Size: USD 128.9 billion by 2035
- Growth Forecasts: 7.5% CAGR (2026-2035)
Key Regional Dynamics:
- Largest Region: North America (48.5% Share by 2035)
- Fastest Growing Region: Asia Pacific
- Dominating Countries: United States, China, Japan, South Korea, United Kingdom
- Emerging Countries: India, Brazil, Indonesia, Vietnam, Mexico
Last updated on : 2 January, 2026
Online Microtransaction Market - Growth Drivers and Challenges
Growth Drivers
- Ubiquity of high-speed internet and smartphone penetration: The foundational driver in the online microtransaction market is the near-universal access to the devices and networks required for digital consumption. The government data confirms this infrastructure is in place. As cited by the U.S. Census Bureau in June 2024, reports that over 90% of people have a broadband internet subscription, and others use the internet via smartphone daily. This creates a massive always connected addressable market. The actionable insight is that market growth is now less about new user acquisition and more about deepening monetization within this entrenched user base. The microtransaction models must be optimized for the mobile-first instant access experience. On the other hand, the developers can shift focus from infrastructure-dependent growth to exploiting high-frequency engagement, leveraging persistent connectivity to introduce time-sensitive offers and live events that drive daily spending.
- Data analytics and personalized monetization: The ability to analyze user behavior at scale allows for an advanced targeting of the offers and content, dramatically increasing the efficiency of the monetization. By understanding the player patterns, companies can present the right offer at the moment of highest likely conversion. This driver in the online microtransaction market is supported by the federal investment in the underlying data economy, for example, the National Science Foundation funds research in big data analytics and human-centered AI technologies central to modern monetization platforms. Personalization is now a baseline expectation for competitive user monetization. This trend is further boosted by the rise of the first-party data platforms, where user consent and privacy-compliant data collection are paramount for building predictive spending models.
- Expansion of government-backed digital payment infrastructure: Government investment in national digital payment rails is a foundational demand driver for online microtransactions. The U.S. Federal Reserve confirms that the real-time payment systems are designed to support low value high frequency transaction directly aligning with the microtransaction economies. In parallel, the World Bank reports that governments in Asia and Europe have prioritized instant payment infrastructure to improve the digital commerce efficiency and reduce cash dependency. According to the PIB March 2025 report, the digital payment transactions increased from over 18,000 crore transactions in 2024 to 2025. These public investments reduce transaction friction and settlement costs for platforms, improving monetization viability.
Challenges
- Platform dominance and tax: Manufacturers cede significant control and revenue to the platform holders, such as Apple and Google, who mandate the use of their payment systems and take a certain commission on every transaction. This platform tax drastically reduces the margins in the online microtransaction market. The top players in the market have highlighted this struggle, arguing that the policies of the App Store constitute a monopoly. While Epic saw a regulatory win, the core economic model remains a formidable barrier, as noted in the court finding, which detailed the super-competitive commission fees.
- High technical infrastructure and security costs: Building and maintaining the secure, scalable, low-latency backend required for the live service microtransaction models demands a massive upfront and ongoing investment. This includes fraud prevention, server stability, and the real time transaction processing. Companies invest heavily in proprietary platforms to ensure seamless in-game purchases and combat hacking, which is a constant, costly threat that can instantly erode players' trust and revenue if compromised.
Online Microtransaction Market Size and Forecast:
| Report Attribute | Details |
|---|---|
|
Base Year |
2025 |
|
Forecast Year |
2026-2035 |
|
CAGR |
7.5% |
|
Base Year Market Size (2025) |
USD 62.5 billion |
|
Forecast Year Market Size (2035) |
USD 128.9 billion |
|
Regional Scope |
|
Online Microtransaction Market Segmentation:
End user Segment Analysis
The end user segment is dominated by the individual/ gamer sub-segment and is poised to hold a share value of 98.3% by 2035 in the online microtransaction market. This includes all purchases made by the players for personal use, from casual mobile gamers to dedicated console enthusiasts. The remaining fraction is attributed to Esports Organization, which purchases the team-branded cosmetic items for promotional purposes and player customization. The individual consumer spending is heavily driven by the personalization progression and social status within games. The report from the International Trade Administration in 2023 depicts that nearly 190 million people in the U.S. play video games. This vast player base provides the essential scale that makes monetizing even a small percentage of users extraordinarily profitable for publishers.
Revenue Model Segment Analysis
Under the revenue model segment, the free-to-play subsegment holds the largest share value in the online microtransaction market. The segment has become the industry standard because it eliminates the initial purchase barrier, maximizing the player base and converting a portion into paying users via continuous engagement loops and live service content. Its dominance is validated by its use in virtually all top-grossing mobile and live service PC/console titles. The data from the Consumer Financial Protection Bureau in April 2024 has noted that U.S. people spent USD 57 billion in in-game transactions in 2023, highlighting the immense monetization efficiency of the F2P model, where a small percentage of the whales contribute to a disproportionately large share of total revenue. The market's development is linked to enhanced player analytics and retention techniques that are intended to find and nurture high-value individuals within the free player ecosystem.
Device Type Segment Analysis
Within the device type, the smartphone leads, consistently capturing the greatest share in the online microtransaction market. Their dominance is fueled by the ubiquitous ownership of integrated app store payment systems and games designed for short, frequent engagement sessions that incentivize impulse purchases. This sub-segment’s lead is entrenched by massive markets in Asia and the West. The pervasive use of the primary device for this activity is highlighted in a National Telecommunications and Information Administration reported people are using smartphones to go online daily, driving the mobile-first microtransaction economy and solidifying its leading revenue positions. This deep integration of hardware, software, and payment ecosystems creates a frictionless spending environment unmatched by other platforms.
Our in-depth analysis of the online microtransaction market includes the following segments:
|
Segment |
Subsegments |
|
Platform |
|
|
Content Type |
|
|
Application |
|
|
Revenue Model |
|
|
Device Type |
|
|
End user |
|

Vishnu Nair
Head - Global Business DevelopmentCustomize this report to your requirements — connect with our consultant for personalized insights and options.
Online Microtransaction Market - Regional Analysis
North America Market Insights
North America is dominating the online microtransaction market and is expected to hold the revenue share of 48.5% by 2035. The market is driven by the technological infrastructure and high consumer disposable income. The growth is fueled by the deepening monetization within an established user base rather than new user acquisition. The key drivers include the dominance of premium console and PC gaming ecosystems, high smartphone penetration enabling mobile-first strategies, and advanced digital payment adoption. Primary trends involve a strategic focus on player lifetime value via personalized live service content, increased regulatory scrutiny on loot boxes and deceptive design patterns, and the expansion of cross-platform play that enhances the utility and value of virtual goods.
The online microtransaction market in the U.S. is navigating a shift from expansion to advanced monetization, with the personalization via first party data analytics becoming a core competitive differentiator. A dominant trend is the regulatory environment where the Federal Trade Commission actively enforces against the dark patterns and undisclosed loot box mechanics, directly shaping the ethical design standards. The dissolution of platform silos via cross-platform play and cloud gaming is increasing the permanence and value of virtual goods, encouraging spending. The Pew Research Center in November 2025 indicated that 16% of U.S. people are smartphone-only internet users, facilitating the impulse-driven purchasing essential to the market. This infrastructure, combined with the high per-user spending, makes the high-value microtransaction arena, forcing business models to prioritize retention and lifetime value over user acquisition.
Percentage of U.S. People Who Own a Smartphone by Age
|
Age |
Percentage |
|
18-29 |
97 |
|
30-49 |
96 |
|
50-64 |
90 |
|
65+ |
78 |
Source: Pew Research Center November 2025
Canada’s online microtransaction market exhibits robust growth driven by digital inclusivity and cultural diversity. A key trend is the move towards localization of content and monetization to serve its multilingual population, extending beyond translation to cultural relevance. The regulatory alignment with the international standards for consumer protection and privacy is increasingly shaping the marketplace fairness. The government policy plays a supportive role via the Canadian Radio-Television and Telecommunications Commission focus on universal broadband, expanding the reliable digital access necessary for market participation. The Government of Canada report in September 2025 has noted that 98% of the people are expected to connect to high-speed internet by 2026, which reflects a mature acceptance of microtransaction models.
APAC Market Insights
Asia Pacific is the fastest-growing online microtransaction market and is expected to grow at a CAGR of 8.8% during the forecast period 2026 to 2035. The market is driven by its massive digitally native population and the region’s pioneering role in mobile-first and free-to-play gaming. The unparalleled smartphone penetration, mainly in countries such as China and India, provides a ubiquitous platform for gaming and in-app spending. The integration of gaming into daily social life and the acceptance of virtual goods as valuable commodities are more pronounced than in Western markets. A key regional trend is the dominance of the gacha monetization model, a mechanic for obtaining the random virtual items that originated in Japan and has become highly refined across the region.
China’s online microtransaction market is the world’s largest, defined by its scale and advanced platform-driven ecosystems. Dominated by domestic giants Tencent and NetEase, growth is fueled by the deep integration of gaming with everyday digital life via super apps such as WeChat. The market is highly mobile, first with a vast engaged user base across diverse demographics. A defining characteristic is its operation under a proactive and strict regulatory framework focused on youth protection and content oversight. For instance, the National Press and Publication Administration (NPPA) mandates playtime and spending limits for minors. The report from the People’s Republic of China in December 2025 indicates that the number of digital consumers in China reached 958 million in the first half of 2025. This data highlights the growing role of digital spending in China’s overall consumption.
India represents the Asia Pacific region’s most dynamic high-growth online microtransaction market, primarily fueled by an unprecedented mobile gaming revolution. The catalyst for this expansion is the widespread availability of affordable smartphones and some of the world’s cheapest mobile data that has brought hundreds of millions of new users online. The market is driven by a young, digitally native population with a strong preference for casual, hyper casual, and real money gaming formats, with cricket-themed games being mainly potent for monetization. The data from the IBEF in November 2024 shows that in-app purchases are the fastest-growing revenue stream in India’s gaming sector, with 41% YoY in FY2024 and projected to grow at a 44% CAGR through FY2029. This growth is attracting significant investment and facing evolving regulatory scrutiny concerning real-money gaming and user data protection.
India Gaming Market & Online Microtransaction Alignment (2024-2029)
|
Category |
Data Point |
Relevance to Online Microtransaction Market |
|
Total Gaming Market Size |
USD 3.8 billion in FY24 |
Establishes overall revenue base from which microtransactions are expanding |
|
Market Growth |
23% YoY growth in FY24 |
Indicates strong underlying demand for digital gaming spend |
|
Projected Market Size |
> USD 9.2 billion by FY29 |
Expanding addressable market for in-app purchase monetization |
|
Fastest-Growing Revenue Segment |
In-app purchases grew 41% YoY in FY24 |
Direct evidence of accelerating microtransaction adoption |
|
In-App Purchase Outlook |
44% CAGR (FY24–FY29); projected to surpass RMG |
Signals structural shift toward microtransaction-led revenues |
|
Largest Revenue Contributor (FY24) |
Real-money gaming (USD 2.4 billion) |
Benchmark for upcoming crossover with in-app purchases |
|
Game Type Growth |
Mid-core games +53% YoY; casual games +10% |
These segments primarily rely on microtransactions |
|
Paying User Base |
25% of 590 million gamers |
Indicates scalable volume for low-value, high-frequency transactions |
|
Demographic Reach |
44% women; 66% non-metro users |
Broad, diversified microtransaction demand base |
|
Regulatory Context |
28% GST on online gaming |
Highlights resilience of non-RMG microtransactions under tax pressure |
Source: IBEF November 2024
Europe Market Insights
Europe’s online microtransaction market is a diverse segment of the global digital gaming industry. The key drivers of the market are high levels of internet and smartphone penetration across the continent, coupled with a large and engaged gamer population across all age groups. Growth is primarily sustained by the global industry-wide shift towards live service games, which rely on ongoing player engagement and recurrent spending for virtual items, battle passes, and downloadable content. However, the market operates under a distinct regulatory landscape that shapes its operation. The key trends include the increasing scrutiny of loot box mechanics under the national gambling regulations, the need for clear consumer protection regarding in-game purchases, and the push for transparency in odds disclosure. Further, Europe’s complex data privacy regulations under the General Data Protection Regulation significantly impact how companies collect and use player data for personalized monetization.
The UK’s online microtransaction market is supported by a digitally engaged population and is one of Europe’s largest. The primary driver is the country’s mature gaming ecosystem featuring a major development hub and a high-spending player base. The online microtransaction market is heavily influenced by the widespread adoption of free-to-play live service models on the mobile and console platforms, which generate recurring revenue streams. The NLM study in November 2024 has indicated that 39% of 11 to 16-year-olds were aware of and used in-game items such as skins and loot boxes, which directly reflects the participation in microtransaction-based monetization models. The skins, loot boxes, and similar virtual items are core microtransaction formats mainly in the online gaming ecosystem. Their use indicates early adoption and the normalization of the small-value digital purchases that expand the long-term user base and lifetime value potential for platforms.
Germany is a vital online microtransaction market in Europe and is defined by a large tech-savvy population and a strong economy. The growth is fueled by a significant PC and console gaming culture alongside rapidly increasing mobile game penetration. The online microtransaction market evolution is notable, having matured from historical regulatory constraints on certain game content. The current growth is driven by the normalization of in-game purchases across all age groups and the success of major international live service titles. The country’s regulators maintain a focus on consumer protection and youth media literacy. Underpinning this activity is solid household expenditure on entertainment. The household expenditure on leisure entertainment and culture demonstrates the substantial budget allocation to discretionary digital entertainment, where the microtransactions compete.
Key Online Microtransaction Market Players:
- Apple (U.S.)
- Company Overview
- Business Strategy
- Key Product Offerings
- Financial Performance
- Key Performance Indicators
- Risk Analysis
- Recent Development
- Regional Presence
- SWOT Analysis
- Google (U.S.)
- Tencent (China)
- Sony Interactive Entertainment (Japan)
- Microsoft (Xbox) (U.S.)
- NetEase (China)
- Nintendo (Japan)
- Activision Blizzard (King) (U.S.)
- Electronic Arts (U.S.)
- Sea Limited (Garena) (Singapore)
- NCSoft (South Korea)
- Nexon (South Korea)
- Supercell (Finland/Europe)
- Epic Games (U.S.)
- Take-Two Interactive (U.S.)
- Ubisoft (France/Europe)
- Roblox Corporation (U.S.)
- MiHoYo (HoYoverse) (China)
- Playtika (Israel)
- Pearl Abyss (South Korea)
- Apple dominates the online microtransaction market structurally via its App Store, which mandates the use of its proprietary payment system for digital goods. By taking a standard revenue share on every in-app purchase, Apple has turned its iOS ecosystem into an unparalleled high-margin microtransaction platform. Its strategic initiatives focus on tightening this control via policy enforcement and expanding services, offering subscription-based access to games funded by microtransactions.
- Google leverages the online microtransaction market via the Google Play Store, competing directly with Apple as the primary gateway for Android users. Its strategy involves creating a seamless, secure payment infrastructure to foster user spending. Key initiatives include experimenting with reduced commission rates for developers in certain market improving discovery algorithms to promote high-grossing live service games.
- Tencent is a global titan in the online microtransaction market primarily via its massive game portfolio. Its core strategy is perfecting the free-to-play model, where the games are distribution platforms for cosmetic items, battle passes, and character upgrades. The strategic initiatives include leveraging its social network for viral user acquisition and integrated payments, making the spending frictionless. The company has made a revenue of RMB 660,257 million in 2024.
- Sony Interactive Entertainment strategically harnesses the online microtransaction market within its PlayStation ecosystem. While revenue from the game sales is primary Sony aggressively monetizes its large engaged user base via in-game purchases in first-party live service titles and by taking a share of all third-party microtransactions on its network. In 2024, the company has made a revenue of USD 3.9 billion, which is all time high since 2020.
- Microsoft approaches the online microtransaction market via a multi-faceted strategy centered on ecosystem expansion. Its game pass subscription service acts as a powerful discovery engine, introducing millions of players to games they then engage with via microtransactions from which Microsoft shares revenue. The key initiatives include leveraging its acquisition to gain expertise in mobile microtransactions and promoting cross-play to increase player pools.
Here is a list of key players operating in the global online microtransaction market:
The online microtransaction market is fiercely competitive and is dominated by platform titans taking a share of all transactions from the U.S., China, Japan, and South Korea. The key strategies include live service models to sustain payers' engagement with seasonal content battle passes, and cross-platform play to maximize audience reach. The major players are heavily investing in acquisitions to consolidate IP and talent. Further, there is a strategic pivot towards games as a platform and leveraging established IP across media to drive fan-based spending, ensuring recurring revenue streams in a saturated market. According to the Private Equity Stake Holders Project's October 2025 report, PESP is concerned about the private equity takeover of Electronic Arts. The acquisition expands the EA's live services, including microtransactions, subscriptions, and in-game advertising.
Corporate Landscape of the Online Microtransaction Market:
Recent Developments
- In September 2025, Cloudfare, the leading connectivity cloud company, announced plans to introduce NET Dollar, a new U.S. dollar-backed stablecoin that will enable instant, secure transactions for the agentic web.
- In May 2025, Visa and Samsung has announced the launch of the Tap to Transfer feature with Samsung Wallet. Users can send/receive money between different payment apps, simplifying peer-to-peer microtransfers.
- Report ID: 3738
- Published Date: Jan 02, 2026
- Report Format: PDF, PPT
- Explore a preview of key market trends and insights
- Review sample data tables and segment breakdowns
- Experience the quality of our visual data representations
- Evaluate our report structure and research methodology
- Get a glimpse of competitive landscape analysis
- Understand how regional forecasts are presented
- Assess the depth of company profiling and benchmarking
- Preview how actionable insights can support your strategy
Explore real data and analysis
Frequently Asked Questions (FAQ)
About this Report
Connect with our Expert

Report, 2026-2035


Copyright @ 2026 Research Nester. All Rights Reserved.
