Non-Destructive Testing Market
- An Outline of the Non-Destructive Testing Market
- Market Definition and Segmentation
- Study Assumptions and Abbreviations
- Research Methodology & Approach
- Primary Research
- Secondary Research
- Data Triangulation
- SPSS Methodology
- Executive Summary
- Growth Drivers
- Major Roadblocks
- Opportunities
- Prevalent Trends
- Government Regulation
- Growth Outlook
- Competitive White Space Analysis – Identifying Untapped Market Gaps
- Risk Overview
- SWOT
- Technological Advancement
- Technology Maturity Matrix for Automotive Aftermarket Fuel Additive
- Recent News
- Regional Demand
- Non-Destructive Testing by Geography – Strategic Comparative Analysis
- Strategic Segment Analysis: Automotive Aftermarket Fuel Additive Demand Landscape
- Non-Destructive Testing Demand Trends Driven by Digital Twin Technology, AI Inspection and Advanced UT Platforms (2026-2036)
- Root Cause Analysis (RCA) for discovering problems of the Automotive Aftermarket Fuel Additive Porter Five Forces
- PESTLE
- Comparative Positioning
- Automotive Aftermarket Fuel Additive– Key Player Analysis (2036)
- Competitive Landscape: Key Suppliers/Players
- Competitive Model: A Detailed Inside View for Investors
- Company Market Share, 2036 (%)
- Business Profile of Key Enterprise
- BASF
- Clariant
- DHALOP CHEMICALS
- Huntsman International LLC Kollmorgen
- LIQUI MOLY GmbH
- Qingdao IRO Surfactant Co., Ltd
- Rislone
- TIANJIN ZHONGXIN CHEMTECH CO., LTD. (ZX CHEMTECH)
- Business Profile of Key Enterprise
- Non-Destructive Testing Market Outlook
- Market Overview
- Market Revenue by Value (USD Million), Volume (Million Tons), and Compound Annual Growth Rate (CAGR)
- Global Segmentation Automotive Aftermarket Fuel Additive Analysis (2026-2036)
- By Offering
- Equipment, Market Value (USD Million), and CAGR, 2026-2036F
- Instruments
- Probes
- Sensors
- Accessories
- Software
- Service, Market Value (USD Million), and CAGR, 2026-2036F
- Training services
- Equipment Rental Services
- Calibration Services
- Insurance
- Others
- Equipment, Market Value (USD Million), and CAGR, 2026-2036F
- By Technology
- Radiography testing (RT), Market Value (USD Million), and CAGR, 2026-2036F
- By Offering
- Market Overview
27.2.2.1.1 2D Radiography Testing
27.2.2.1.2 3D/CT (Computed Tomography)
- Ultrasonic Testing (UT), Market Value (USD Million), and CAGR, 2026-2036F
27.2.2.2.1 Conventional
27.2.2.2.2 Phased Array (UT) (PAUT)
27.2.2.2.3 Time of Flight Diffraction (ToFD)
- Eddy Current Testing (ET), Market Value (USD Million), and CAGR, 2026-2036F
- Penetrant Testing (PT), Market Value (USD Million), and CAGR, 2026-2036F
- Magnetic Particle Testing (MT), Market Value (USD Million), and CAGR, 2026-2036F
- Visual Testing (VT), Market Value (USD Million), and CAGR, 2026-2036F
- Acoustic Emission (AE), Market Value (USD Million), and CAGR, 2026-2036F
- Data Management System, Market Value (USD Million), and CAGR, 2026-2036F
- By End Use Industry
- Oil and Gas, Market Value (USD Million), and CAGR, 2026-2036F
27.2.3.1.1 Construction
27.2.3.1.2 maintenance
- Power Plant, Market Value (USD Million), and CAGR, 2026-2036F
- Construction
- Maintenance
- Aerospace, Market Value (USD Million), and CAGR, 2026-2036F
- Construction
- MRO
- Space and Defense, Market Value (USD Million), and CAGR, 2026-2036F
- Ship, Market Value (USD Million), and CAGR, 2026-2036F
- Mobility/Battery, Market Value (USD Million), and CAGR, 2026-2036F
- Electronics Semiconductor, Market Value (USD Million), and CAGR, 2026-2036F
- Infrastructure, Market Value (USD Million), and CAGR, 2026-2036F
- Security, Market Value (USD Million), and CAGR, 2026-2036F
- By Technique
- Traditional/Conventional, Market Value (USD Million), and CAGR, 2026-2036F
- AI Enabled, Market Value (USD Million), and CAGR, 2026-2036F
- Regional Synopsis, Value (USD Million), 2026-2036
- North America Market Value (USD Million) and CAGR & Y-o-Y Growth Trend, 2026-2036F
- Europe Market Value (USD Million) and CAGR & Y-o-Y Growth Trend, 2026-2036F
- Asia Pacific excluding Japan Market Value (USD Million) and CAGR & Y-o-Y Growth Trend, 2026-2036F
- Japan Market Value (USD Million) and CAGR & Y-o-Y Growth Trend, 2026-2036F
- Latin America Market Value (USD Million) and CAGR & Y-o-Y Growth Trend, 2026-2036F
- Middle East and Africa Market Value (USD Million) and CAGR & Y-o-Y Growth Trend, 2026-2036F
- North America Market
- Overview
- Market Value (USD Million), Current and Future Projections, 2026-2036
- Increment $ Opportunity Assessment, 2026-2036
- Segmentation (USD Million), 2026-2036, By
- By Offering
- Equipment, Market Value (USD Million), and CAGR, 2026-2036F
- Instruments
- Probes
- Sensors
- Accessories
- Software
- Service, Market Value (USD Million), and CAGR, 2026-2036F
- Training services
- Equipment Rental Services
- Calibration Services
- Insurance
- Others
- Equipment, Market Value (USD Million), and CAGR, 2026-2036F
- By Technology
- Radiography testing (RT), Market Value (USD Million), and CAGR, 2026-2036F
- By Offering
- Overview
27.2.2.1.1 2D Radiography Testing
27.2.2.1.2 3D/CT (Computed Tomography)
- Ultrasonic Testing (UT), Market Value (USD Million), and CAGR, 2026-2036F
27.2.2.2.1 Conventional
27.2.2.2.2 Phased Array (UT) (PAUT)
27.2.2.2.3 Time of Flight Diffraction (ToFD)
- Eddy Current Testing (ET), Market Value (USD Million), and CAGR, 2026-2036F
- Penetrant Testing (PT), Market Value (USD Million), and CAGR, 2026-2036F
- Magnetic Particle Testing (MT), Market Value (USD Million), and CAGR, 2026-2036F
- Visual Testing (VT), Market Value (USD Million), and CAGR, 2026-2036F
- Acoustic Emission (AE), Market Value (USD Million), and CAGR, 2026-2036F
- Data Management System, Market Value (USD Million), and CAGR, 2026-2036F
- By End Use Industry
- Oil and Gas, Market Value (USD Million), and CAGR, 2026-2036F
27.2.3.1.1 Construction
27.2.3.1.2 maintenance
- Power Plant, Market Value (USD Million), and CAGR, 2026-2036F
- Construction
- Maintenance
- Aerospace, Market Value (USD Million), and CAGR, 2026-2036F
- Construction
- MRO
- Space and Defense, Market Value (USD Million), and CAGR, 2026-2036F
- Ship, Market Value (USD Million), and CAGR, 2026-2036F
- Mobility/Battery, Market Value (USD Million), and CAGR, 2026-2036F
- Electronics Semiconductor, Market Value (USD Million), and CAGR, 2026-2036F
- Infrastructure, Market Value (USD Million), and CAGR, 2026-2036F
- Security, Market Value (USD Million), and CAGR, 2026-2036F
- By Technique
- Traditional/Conventional, Market Value (USD Million), and CAGR, 2026-2036F
- AI Enabled, Market Value (USD Million), and CAGR, 2026-2036F
- Country Level Analysis, Value (USD Million)
- U.S. Market Value (USD Million) and CAGR & Y-o-Y Growth Trend, 2026-2036F
- Canada Market Value (USD Million) and CAGR & Y-o-Y Growth Trend, 2026-2036F
- Europe Market
- Overview
- Market Value (USD Million), Current and Future Projections, 2026-2036
- Increment $ Opportunity Assessment, 2026-2036
- Segmentation (USD Million), 2026-2036, By
- By Offering
- Equipment, Market Value (USD Million), and CAGR, 2026-2036F
- Instruments
- Probes
- Sensors
- Accessories
- Software
- Service, Market Value (USD Million), and CAGR, 2026-2036F
- Training services
- Equipment Rental Services
- Calibration Services
- Insurance
- Others
- Equipment, Market Value (USD Million), and CAGR, 2026-2036F
- By Technology
- Radiography testing (RT), Market Value (USD Million), and CAGR, 2026-2036F
- By Offering
- Overview
27.2.2.1.1 2D Radiography Testing
27.2.2.1.2 3D/CT (Computed Tomography)
- Ultrasonic Testing (UT), Market Value (USD Million), and CAGR, 2026-2036F
27.2.2.2.1 Conventional
27.2.2.2.2 Phased Array (UT) (PAUT)
27.2.2.2.3 Time of Flight Diffraction (ToFD)
- Eddy Current Testing (ET), Market Value (USD Million), and CAGR, 2026-2036F
- Penetrant Testing (PT), Market Value (USD Million), and CAGR, 2026-2036F
- Magnetic Particle Testing (MT), Market Value (USD Million), and CAGR, 2026-2036F
- Visual Testing (VT), Market Value (USD Million), and CAGR, 2026-2036F
- Acoustic Emission (AE), Market Value (USD Million), and CAGR, 2026-2036F
- Data Management System, Market Value (USD Million), and CAGR, 2026-2036F
- By End Use Industry
- Oil and Gas, Market Value (USD Million), and CAGR, 2026-2036F
27.2.3.1.1 Construction
27.2.3.1.2 maintenance
- Power Plant, Market Value (USD Million), and CAGR, 2026-2036F
- Construction
- Maintenance
- Aerospace, Market Value (USD Million), and CAGR, 2026-2036F
- Construction
- MRO
- Space and Defense, Market Value (USD Million), and CAGR, 2026-2036F
- Ship, Market Value (USD Million), and CAGR, 2026-2036F
- Mobility/Battery, Market Value (USD Million), and CAGR, 2026-2036F
- Electronics Semiconductor, Market Value (USD Million), and CAGR, 2026-2036F
- Infrastructure, Market Value (USD Million), and CAGR, 2026-2036F
- Security, Market Value (USD Million), and CAGR, 2026-2036F
- By Technique
- Traditional/Conventional, Market Value (USD Million), and CAGR, 2026-2036F
- AI Enabled, Market Value (USD Million), and CAGR, 2026-2036F
- Country Level Analysis, Value (USD Million)
- UK Market Value (USD Million) and CAGR & Y-o-Y Growth Trend, 2026-2036F
- Germany Market Value (USD Million) and CAGR & Y-o-Y Growth Trend, 2026-2036F
- France Market Value (USD Million) and CAGR & Y-o-Y Growth Trend, 2026-2036F
- Italy Market Value (USD Million) and CAGR & Y-o-Y Growth Trend, 2026-2036F
- Spain Market Value (USD Million) and CAGR & Y-o-Y Growth Trend, 2026-2036F
- Netherlands Market Value (USD Million) and CAGR & Y-o-Y Growth Trend, 2026-2036F
- Russia Market Value (USD Million) and CAGR & Y-o-Y Growth Trend, 2026-2036F
- Switzerland Market Value (USD Million) and CAGR & Y-o-Y Growth Trend, 2026-2036F
- Poland Market Value (USD Million) and CAGR & Y-o-Y Growth Trend, 2026-2036F
- Belgium Market Value (USD Million) and CAGR & Y-o-Y Growth Trend, 2026-2036F
- Rest of Europe Market Value (USD Million) and CAGR & Y-o-Y Growth Trend, 2026-2036F
- Asia Pacific excluding Japan Market
- Overview
- Market Value (USD Million), Current and Future Projections, 2026-2036
- Increment $ Opportunity Assessment, 2026-2036
- Segmentation (USD Million), 2026-2036, By
- By Offering
- Equipment, Market Value (USD Million), and CAGR, 2026-2036F
- Instruments
- Probes
- Sensors
- Accessories
- Software
- Service, Market Value (USD Million), and CAGR, 2026-2036F
- Training services
- Equipment Rental Services
- Calibration Services
- Insurance
- Others
- Equipment, Market Value (USD Million), and CAGR, 2026-2036F
- By Technology
- Radiography testing (RT), Market Value (USD Million), and CAGR, 2026-2036F
- By Offering
- Overview
27.2.2.1.1 2D Radiography Testing
27.2.2.1.2 3D/CT (Computed Tomography)
- Ultrasonic Testing (UT), Market Value (USD Million), and CAGR, 2026-2036F
27.2.2.2.1 Conventional
27.2.2.2.2 Phased Array (UT) (PAUT)
27.2.2.2.3 Time of Flight Diffraction (ToFD)
- Eddy Current Testing (ET), Market Value (USD Million), and CAGR, 2026-2036F
- Penetrant Testing (PT), Market Value (USD Million), and CAGR, 2026-2036F
- Magnetic Particle Testing (MT), Market Value (USD Million), and CAGR, 2026-2036F
- Visual Testing (VT), Market Value (USD Million), and CAGR, 2026-2036F
- Acoustic Emission (AE), Market Value (USD Million), and CAGR, 2026-2036F
- Data Management System, Market Value (USD Million), and CAGR, 2026-2036F
- By End Use Industry
- Oil and Gas, Market Value (USD Million), and CAGR, 2026-2036F
27.2.3.1.1 Construction
27.2.3.1.2 maintenance
- Power Plant, Market Value (USD Million), and CAGR, 2026-2036F
- Construction
- Maintenance
- Aerospace, Market Value (USD Million), and CAGR, 2026-2036F
- Construction
- MRO
- Space and Defense, Market Value (USD Million), and CAGR, 2026-2036F
- Ship, Market Value (USD Million), and CAGR, 2026-2036F
- Mobility/Battery, Market Value (USD Million), and CAGR, 2026-2036F
- Electronics Semiconductor, Market Value (USD Million), and CAGR, 2026-2036F
- Infrastructure, Market Value (USD Million), and CAGR, 2026-2036F
- Security, Market Value (USD Million), and CAGR, 2026-2036F
- By Technique
- Traditional/Conventional, Market Value (USD Million), and CAGR, 2026-2036F
- AI Enabled, Market Value (USD Million), and CAGR, 2026-2036F
- Country Level Analysis, Value (USD Million)
- China Market Value (USD Million) and CAGR & Y-o-Y Growth Trend, 2026-2036F
- India Market Value (USD Million) and CAGR & Y-o-Y Growth Trend, 2026-2036F
- South Korea Market Value (USD Million) and CAGR & Y-o-Y Growth Trend, 2026-2036F
- Australia Market Value (USD Million) and CAGR & Y-o-Y Growth Trend, 2026-2036F
- Indonesia Market Value (USD Million) and CAGR & Y-o-Y Growth Trend, 2026-2036F
- Malaysia Market Value (USD Million) and CAGR & Y-o-Y Growth Trend, 2026-2036F
- Vietnam Market Value (USD Million) and CAGR & Y-o-Y Growth Trend, 2026-2036F
- Thailand Market Value (USD Million) and CAGR & Y-o-Y Growth Trend, 2026-2036F
- Singapore Market Value (USD Million) and CAGR & Y-o-Y Growth Trend, 2026-2036F
- New Zealand Market Value (USD Million) and CAGR & Y-o-Y Growth Trend, 2026-2036F
- Rest of Asia Pacific Excluding Japan Market Value (USD Million) and CAGR & Y-o-Y Growth Trend, 2026-2036F
- Latin America Market
- Overview
- Market Value (USD Million), Current and Future Projections, 2026-2036
- Increment $ Opportunity Assessment, 2026-2036
- Year-on-Year Growth Forecast (%)
- Segmentation (USD Million), 2026-2036, By
- By Offering
- Equipment, Market Value (USD Million), and CAGR, 2026-2036F
- Instruments
- Probes
- Sensors
- Accessories
- Software
- Service, Market Value (USD Million), and CAGR, 2026-2036F
- Training services
- Equipment Rental Services
- Calibration Services
- Insurance
- Others
- Equipment, Market Value (USD Million), and CAGR, 2026-2036F
- By Technology
- Radiography testing (RT), Market Value (USD Million), and CAGR, 2026-2036F
- By Offering
- Overview
27.2.2.1.1 2D Radiography Testing
27.2.2.1.2 3D/CT (Computed Tomography)
- Ultrasonic Testing (UT), Market Value (USD Million), and CAGR, 2026-2036F
27.2.2.2.1 Conventional
27.2.2.2.2 Phased Array (UT) (PAUT)
27.2.2.2.3 Time of Flight Diffraction (ToFD)
- Eddy Current Testing (ET), Market Value (USD Million), and CAGR, 2026-2036F
- Penetrant Testing (PT), Market Value (USD Million), and CAGR, 2026-2036F
- Magnetic Particle Testing (MT), Market Value (USD Million), and CAGR, 2026-2036F
- Visual Testing (VT), Market Value (USD Million), and CAGR, 2026-2036F
- Acoustic Emission (AE), Market Value (USD Million), and CAGR, 2026-2036F
- Data Management System, Market Value (USD Million), and CAGR, 2026-2036F
- By End Use Industry
- Oil and Gas, Market Value (USD Million), and CAGR, 2026-2036F
27.2.3.1.1 Construction
27.2.3.1.2 maintenance
- Power Plant, Market Value (USD Million), and CAGR, 2026-2036F
- Construction
- Maintenance
- Aerospace, Market Value (USD Million), and CAGR, 2026-2036F
- Construction
- MRO
- Space and Defense, Market Value (USD Million), and CAGR, 2026-2036F
- Ship, Market Value (USD Million), and CAGR, 2026-2036F
- Mobility/Battery, Market Value (USD Million), and CAGR, 2026-2036F
- Electronics Semiconductor, Market Value (USD Million), and CAGR, 2026-2036F
- Infrastructure, Market Value (USD Million), and CAGR, 2026-2036F
- Security, Market Value (USD Million), and CAGR, 2026-2036F
- By Technique
- Traditional/Conventional, Market Value (USD Million), and CAGR, 2026-2036F
- AI Enabled, Market Value (USD Million), and CAGR, 2026-2036F
- Country Level Analysis, Value (USD Million)
- Brazil Market Value (USD Million) and CAGR & Y-o-Y Growth Trend, 2026-2036F
- Argentina Market Value (USD Million) and CAGR & Y-o-Y Growth Trend, 2026-2036F
- Mexico Market Value (USD Million) and CAGR & Y-o-Y Growth Trend, 2026-2036F
- Rest of Latin America Market Value (USD Million) and CAGR & Y-o-Y Growth Trend, 2026-2036F
- Middle East & Africa Market
- Overview
- Market Value (USD Million), Current and Future Projections, 2026-2036
- Increment $ Opportunity Assessment, 2026-2036
- Year-on-Year Growth Forecast (%)
- Segmentation (USD Million), 2026-2036, By
- By Offering
- Equipment, Market Value (USD Million), and CAGR, 2026-2036F
- Instruments
- Probes
- Sensors
- Accessories
- Software
- Service, Market Value (USD Million), and CAGR, 2026-2036F
- Training services
- Equipment Rental Services
- Calibration Services
- Insurance
- Others
- Equipment, Market Value (USD Million), and CAGR, 2026-2036F
- By Technology
- Radiography testing (RT), Market Value (USD Million), and CAGR, 2026-2036F
- By Offering
- Overview
27.2.2.1.1 2D Radiography Testing
27.2.2.1.2 3D/CT (Computed Tomography)
- Ultrasonic Testing (UT), Market Value (USD Million), and CAGR, 2026-2036F
27.2.2.2.1 Conventional
27.2.2.2.2 Phased Array (UT) (PAUT)
27.2.2.2.3 Time of Flight Diffraction (ToFD)
- Eddy Current Testing (ET), Market Value (USD Million), and CAGR, 2026-2036F
- Penetrant Testing (PT), Market Value (USD Million), and CAGR, 2026-2036F
- Magnetic Particle Testing (MT), Market Value (USD Million), and CAGR, 2026-2036F
- Visual Testing (VT), Market Value (USD Million), and CAGR, 2026-2036F
- Acoustic Emission (AE), Market Value (USD Million), and CAGR, 2026-2036F
- Data Management System, Market Value (USD Million), and CAGR, 2026-2036F
- By End Use Industry
- Oil and Gas, Market Value (USD Million), and CAGR, 2026-2036F
27.2.3.1.1 Construction
27.2.3.1.2 maintenance
- Power Plant, Market Value (USD Million), and CAGR, 2026-2036F
- Construction
- Maintenance
- Aerospace, Market Value (USD Million), and CAGR, 2026-2036F
- Construction
- MRO
- Space and Defense, Market Value (USD Million), and CAGR, 2026-2036F
- Ship, Market Value (USD Million), and CAGR, 2026-2036F
- Mobility/Battery, Market Value (USD Million), and CAGR, 2026-2036F
- Electronics Semiconductor, Market Value (USD Million), and CAGR, 2026-2036F
- Infrastructure, Market Value (USD Million), and CAGR, 2026-2036F
- Security, Market Value (USD Million), and CAGR, 2026-2036F
- By Technique
- Traditional/Conventional, Market Value (USD Million), and CAGR, 2026-2036F
- AI Enabled, Market Value (USD Million), and CAGR, 2026-2036F
- Country Level Analysis, Value (USD Million)
- Saudi Arabia Market Value (USD Million) and CAGR & Y-o-Y Growth Trend, 2026-2036F
- UAE Market Value (USD Million) and CAGR & Y-o-Y Growth Trend, 2026-2036F
- Israel Market Value (USD Million) and CAGR & Y-o-Y Growth Trend, 2026-2036F
- Qatar Market Value (USD Million) and CAGR & Y-o-Y Growth Trend, 2026-2036F
- Kuwait Market Value (USD Million) and CAGR & Y-o-Y Growth Trend, 2026-2036F
- Oman Market Value (USD Million) and CAGR & Y-o-Y Growth Trend, 2026-2036F
- South Africa Market Value (USD Million) and CAGR & Y-o-Y Growth Trend, 2026-2036F
- Rest of Middle East & Africa Market Value (USD Million) and CAGR & Y-o-Y Growth Trend, 2026-2036F
- Global Economic Scenario
- World Economic Outlook
- About Research Nester
- Our Global Clientele
- We Serve Clients Across World
Non-Destructive Testing Market Outlook:
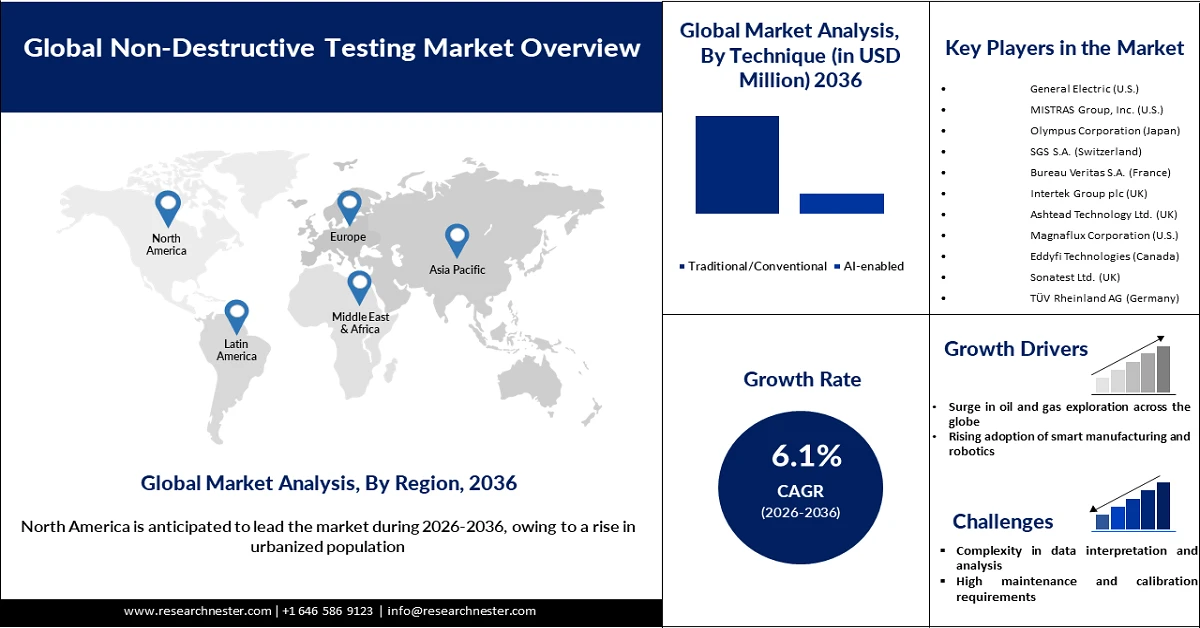
Non-Destructive Testing Market size was valued at USD 4.25 billion in 2025 and is projected to reach USD 8.12 billion by the end of 2036, rising at a CAGR of 6.1% during the forecast period, 2026-2036. In 2026, the industry size of non-destructive testing is estimated at USD 4,639.88 million.
The rapid growth of the market is augmented by the rapid expansion of the aerospace industry, as aircraft manufacturers are prioritizing load-bearing stability. There has been a surge in the development of military jets, commercial aircraft, space vehicles, etc. This has further intensified the necessity to incorporate advanced inspection techniques to find material flaws or the presence of any manufacturing defects. The burgeoning usage of next-generation alloys and lightweight composites in modern aircraft is further amplifying the demand for cutting-edge NDT methods such as phased array inspection. According to the Federal Aviation Administration, the commercial fleet in the U.S. is anticipated to surge from 7,572 aircraft in 2023 to 10,793 aircraft by the year 2044, illustrating long-term expansion in air travel as well as aircraft production.
Various market players are significantly investing in the market owing to the widening targetable end-use base across safety-sensitive industries. The market is getting benefits from asset life extension programs and rising demand in power generation, automotive, and manufacturing sectors. Also, the advent of modern technologies such as phased array ultrasonics and AI-enabled defect detection is increasing the accuracy in inspection. There are recurring revenue streams from calibration and inspection services, creating stable cash flows. There are favorable regulatory frameworks and rising capital expenditure in industrial modernization, which are further making the NDT sector full of lucrative investment opportunities.
Key Non-Destructive Testing Market Insights Summary:
Regional Highlights:
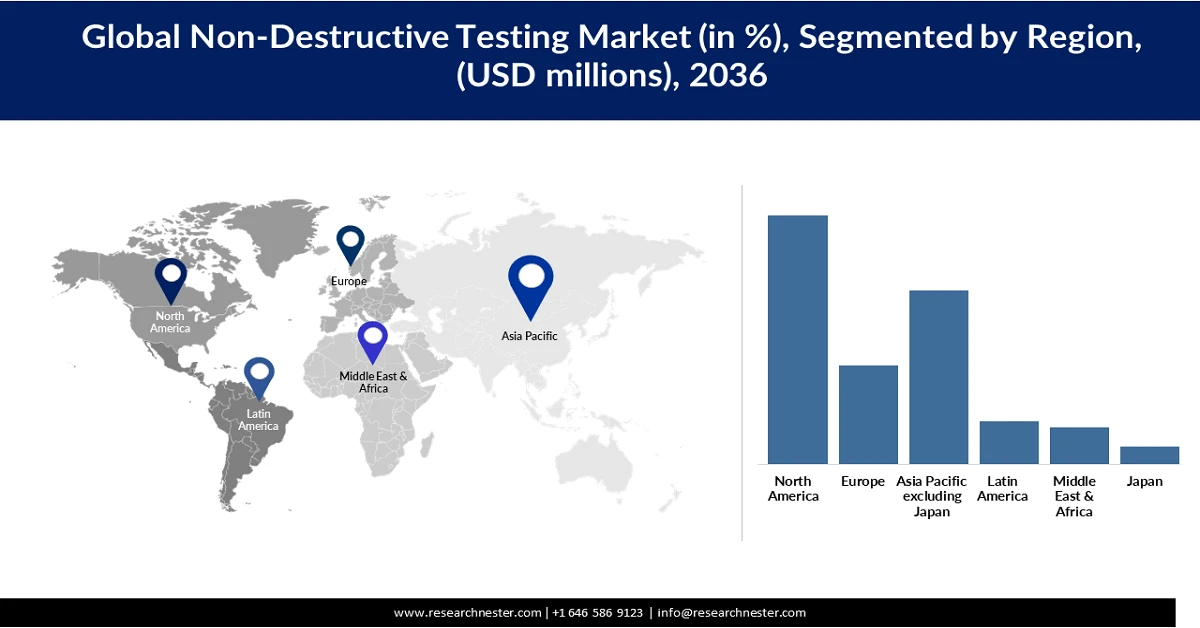
- North America in the non-destructive testing market is projected to secure 40% share by 2036, reinforced by strong demand from oil & gas and aerospace industries, rising adoption of AI-enabled inspection systems, and increasing investments in aging infrastructure maintenance
- Asia Pacific Excluding Japan is expected to hold 28% share by 2036, supported by large-scale infrastructure development, expanding mobility projects, and tightening regulatory mandates encouraging routine and advanced NDT inspections
Segment Insights:
- The equipment rental services segment in the non-destructive testing market is forecast to account for 24.5% share during the assessed period, supported by the preference for cost-effective access to advanced inspection technologies across short-term industrial projects and offshore energy applications
- The mobility/battery segment is anticipated to capture 21% share by 2036, emerging as the largest end-use segment as electric vehicle production scales globally and battery systems demand rigorous quality and safety validation
Key Growth Trends:
- Surge in oil and gas exploration across the globe
- Rising adoption of smart manufacturing and robotics
Major Challenges:
- Complexity in data interpretation and analysis
- High maintenance and calibration requirements
Key Players: General Electric (U.S.), MISTRAS Group, Inc. (U.S.), Olympus Corporation (Japan), SGS S.A. (Switzerland), Bureau Veritas S.A. (France), Intertek Group plc (UK), Ashtead Technology Ltd. (UK), Nikon Metrology NV (Belgium), Magnaflux Corporation (U.S.), Eddyfi Technologies (Canada), Sonatest Ltd. (UK), Applus+ Laboratories (Spain), TÜV Rheinland AG (Germany), DEKRA SE (Germany), Comet Group (Switzerland), Previan Technologies, Inc. (Canada), NDT Solutions (U.S.).
Global Non-Destructive Testing Market Forecast and Regional Outlook:
Market Size & Growth Projections:
- 2025 Market Size: USD 4.25 billion
- 2026 Market Size: USD 4,639.88 million
- Projected Market Size: USD 8.12 billion by 2036
- Growth Forecasts: 6.1% CAGR (2026-2036)
Key Regional Dynamics:
- Largest Region: North America (40% Share by 2036)
- Fastest Growing Region: Asia Pacific Excluding Japan
- Dominating Countries: United States, China, Germany, Japan, France
- Emerging Countries: India, South Korea, Canada, Italy, Spain
Last updated on : 28 January, 2026
Non-Destructive Testing Market Growth Drivers and Challenges:
Growth Drivers:
- Surge in oil and gas exploration across the globe: The surge in oil and gas activities is prominently augmenting the growth of the market, with rising emphasis on regulatory compliance and operational safety. There has been a significant expansion in deep-water and ultra-deep-water exploration projects, increasing the need for modern inspection solutions. A myriad of NDT techniques, such as radiographic and acoustic emission testing, are deployed for inspection in the pipelines and storage tanks. Furthermore, aging oil and gas infrastructure, combined with strict safety standards, necessitates periodic inspection cycles and predictive maintenance programs.
Top 10 Oil Producers and Share of Total World Oil Production (2023)
|
Country |
Oil Production (Million Barrels per Day) |
Share of World Total (%) |
|
United States |
21.91 |
22% |
|
Saudi Arabia |
11.13 |
11% |
|
Russia |
10.75 |
11% |
|
Canada |
5.76 |
6% |
|
China |
5.26 |
5% |
|
Iraq |
4.42 |
4% |
|
Brazil |
4.28 |
4% |
|
United Arab Emirates |
4.16 |
4% |
|
Iran |
3.99 |
4% |
|
Kuwait |
2.91 |
3% |
|
Total (Top 10 Countries) |
74.59 |
73% |
|
World Total |
101.81 |
— |
Source: EIA
- Rising adoption of smart manufacturing and robotics: The burgeoning adoption of industrial robots and smart manufacturing is significantly augmenting the growth of the market. The inclusion of the smart manufacturing systems depends heavily on the systematically linked sensors, robotics, machines, etc. Prominent NDT technologies, such as radiographic testing and automated optical inspection, are being integrated with the robotic arms to foster real-time quality monitoring. Also, the significant inclusion of robotics increases the deployment of robotics by enabling smooth inspection even in high-temperature environments, while enhancing accuracy and speed. According to the International Federation of Robotics, in September 2024, 4,281,585 units were operating in the factories globally.
- Growth in wind energy generation: The swift expansion of wind energy generation is prominently propelling the market growth. The large size of wind turbines and other capital-intensive assets requires strict quality assurance and management of the lifecycle integrity. Prominent turbine components such as gearboxes and towers are vulnerable to the harsh environmental conditions, increasing the requirement for modern NDT techniques such as radiographic testing and acoustic emission. There has been a surge in investment globally in offshore and onshore wind farms, where operators are giving importance to condition-based monitoring to lower the unplanned downtime.
Installed Wind Power Capacity by Country/Region (2021–2024)
|
Country / Region |
Installed Capacity 2024 (MW) |
New Capacity Added in 2024 (MW) |
Growth Rate 2024 (%) |
Installed Capacity 2023 (MW) |
Installed Capacity 2022 (MW) |
Installed Capacity 2021 (MW) |
|
China |
561,492 |
86,892 |
18.3% |
474,600 |
395,230 |
346,670 |
|
United States |
154,609 |
4,154 |
2.8% |
150,455 |
144,053 |
135,177 |
|
Germany |
72,683 |
3,208 |
4.6% |
69,475 |
66,242 |
63,924 |
|
India |
48,163 |
3,427 |
7.7% |
44,736 |
41,600 |
39,800 |
|
Brazil |
34,000 |
5,420 |
19.0% |
28,580 |
23,661 |
21,567 |
|
United Kingdom |
32,360 |
2,324 |
7.7% |
30,036 |
28,683 |
25,668 |
|
Spain |
32,007 |
1,210 |
3.9% |
30,797 |
30,158 |
28,143 |
|
France |
24,383 |
909 |
3.9% |
23,474 |
20,915 |
19,084 |
|
Canada |
18,435 |
1,449 |
8.5% |
16,986 |
15,212 |
14,206 |
|
Sweden |
17,266 |
1,015 |
6.2% |
16,251 |
14,278 |
12,173 |
Source: WWEA
Challenges
- Complexity in data interpretation and analysis: Modern NDT strategies generate humongous inspection data, such as signals, which can be difficult to comprehend without any technical expertise. If the data is assessed accurately, inspectors might either identify defects that do not actually exist or fail to find real structural problems. Adding to this, the a widely accepted standard for interpreting NDT data across varied applications and industries. The lack of consistency makes the result less predictable and lowers the confidence amongst the end users. To overcome these issues, companies are investing in training and hiring proficient personnel, which increases costs and slows the adoption of advanced NDT technologies in less technologically developed sectors.
- High maintenance and calibration requirements: The utilization of the NDT equipment needs regular maintenance and precise calibration to ensure the correct results. The calibration errors can affect the quality of inspection and result in inaccurate assessments. Various operational necessities can result in downtime and the cost of maintenance, mainly for companies handling large fleets of inspection. This has resulted in long-term cost efficiency and reliability in the operations.
Non-Destructive Testing Market Size and Forecast:
| Report Attribute | Details |
|---|---|
|
Base Year |
2025 |
|
Forecast Year |
2026-2036 |
|
CAGR |
6.1% |
|
Base Year Market Size (2025) |
USD 4.25 billion |
|
Forecast Year Market Size (2036) |
USD 8.12 billion |
|
Regional Scope |
|
Non-Destructive Testing Market Segmentation
Offering Segment Analysis
The equipment rental services segment is predicted to account for 24.5% of the market share during the assessed time period. Cutting-edge NDT equipment, such as digital radiography and ultrasonic testing systems, encompasses a substantial initial capital expenditure, making full ownership economically less feasible. Opting for renting equipment aids end users in accessing modern technologies without any prolonged financial commitments, fostering swift adoption and increased inspection accuracy. Additionally, the surge in the use cases for brief inspection projects in a myriad of vital sectors, such as wind energy and energy generation, significantly aids in propelling the rent-based operating model. Also, the widespread expansion of offshore wind farms and turnaround maintenance activities further augments the segment growth.
End use Segment Analysis
The mobility/battery segment is anticipated to acquire 21% of the market share by 2036, making it the largest segment. The pioneering position of the segment can be mainly attributed to the rising worldwide transition to electric vehicles and large-scale battery manufacturing ecosystems. The lithium-ion batteries and modern energy storage systems need strict quality assurance owing to safety sensitivity and intricate internal structures. Other NDT techniques, such as ultrasonic testing, acoustic emission testing, etc., are pivotal for detecting internal defects. As the production of electric vehicles is scaling across battery gigafactories, NDTs are becoming a crucial part of lifecycle safety validation.
Technique Segment Analysis
The conventional NDT techniques are predicted to hold 82% of the non-destructive testing market share by 2036. The dominance of the segment can be primarily attributed to the cost economics and operational familiarity. Various traditional NDT methods, such as radiographic testing, are already deeply embedded in industrial inspection. These strategies are acknowledged by regulatory bodies in aerospace and transportation. Also, the compliance-oriented industries emphasize certified methods to depend heavily on traditional NDT to meet safety requirements. Other than this, conventional NDT strategies render broad applicability across geometries and industrial environments.
Our in-depth analysis of the non-destructive testing market includes the following segments:
|
Segments |
Subsegments |
|
Offerings |
|
|
Technology |
|
|
End-use Industry |
|
|
Technique |
|

Vishnu Nair
Head - Global Business DevelopmentCustomize this report to your requirements — connect with our consultant for personalized insights and options.
Non-Destructive Testing Market Regional Analysis:
North America Market Insights
The North America region is anticipated to garner the largest share, that is, 40% by 2036. The growth of the segment can be attributed to the significant industrial demand and rapid technological development. The region has world-renowned oil & gas and aerospace sectors, which give significant importance to quality assurance and safety. There has been significant integration of automated inspection systems and AI-enabled analytics to enhance accuracy and lower the inspection times. Furthermore, the rising investment in infrastructure maintenance, mainly for aging pipelines, results in increased demand for NDT technologies.
The growth of the market in the U.S. is driven by the conduct of regular nondestructive inspections for aging infrastructure such as bridges and power plants. Government inspection mandates are reinforcing these trends and propelling the market growth. The regulatory bodies in the country, such as PHMSA and FAA, are enforcing stringent quality standards across the aerospace and energy sectors, which need NDT methods to ensure compliance. Other than this, there has been a rising investment in electric vehicle manufacturing, resulting in a requirement for quality assurance, driving the demand for modern inspection methods.
Electric Vehicle Manufacturing Investments by U.S. State (2025)
|
State |
EV Manufacturing Investment (USD Billion) |
|
Georgia |
26.4 |
|
Michigan |
22.2 |
|
North Carolina |
20.2 |
|
Tennessee |
17.5 |
|
Nevada |
16.5 |
Source: EDF
The growth of the market in Canada is driven by the presence of extreme weather conditions, mainly freeze-thaw cycles, which are speeding up the fatigue in the pipelines and other public infrastructure. Additionally,, the vast geography of the country and the remote presence of industrial assets are pushing the demand for ruggedized and portable NDT solutions. According to the Mining Association of Canada in 2022, there were more than 200 operating mines in the country, requiring extensive maintenance, further propelling the non-destructive testing market growth.
Asia Pacific Excluding Japan Market Analysis
The region represents the 2nd largest share, holding 28% of the market, driven by significant infrastructure expansion and rising investment in mobility. There is massive private and public infrastructure investment in highways and bridges, which is driving the routine structural integrity checks. Other than this, there is widespread expansion of AI-enabled NDT solutions for improving detection accuracy and lowering the inspection times. Regional governments are tightening the safety and quality standards, mandating routine NDT inspection to prevent the occurrence of any failures and ensure compliance.
The non-destructive testing (NDT) market in India is propelled by the expansion of the metro and high-speed rail projects. Also, the country is witnessing a push in the direction of domestic aerospace manufacturing, where NDT techniques play a pivotal role in composite inspection and lifecycle monitoring. Other than this, the country is witnessing a transition from fragmented contractors to certified NDT service providers rendering digital reporting, and this professionalization is enhancing the quality of service by increasing trust among large industrial clients. Furthermore, the steady rise in aircraft movement in the country is directly supporting the growth of the market, as rising aircraft movement results in higher fleet utilization with accelerated maintenance cycles.
Aircraft Movement Growth in India (’000)
|
Fiscal Year |
International Movements (’000) |
Domestic Movements (’000) |
|
FY17 |
365 |
1,502 |
|
FY18 |
438 |
1,887 |
|
FY19 |
453 |
2,153 |
|
FY20 |
433 |
2,155 |
|
FY21 |
134 |
1,082 |
|
FY22 |
212 |
1,545 |
|
FY23 |
365 |
2,143 |
|
FY24 |
425 |
2,252 |
|
FY25 |
465 |
2,422 |
Source: IBEF
Europe Market Insights
The Europe market is propelled by a combination of factors, such as a strong industrial base and rapid technological advancements. There are stringent safety norms and compliance standards across the key sectors. Europe has well established ecosystem for engineering and manufacturing, mainly in countries such as France and Germany. Also, the aging infrastructure and intricate transport network across the region need periodic assessment. The non-destructive testing (NDT) market is also benefiting from Industry 4.0-enabled solutions, which enhance inspection efficiency and lower downtime.
In Germany, the growth is driven by extensive rail transport infrastructure needs continuous inspection of axles, rolling stock components, etc. The country is focusing on operational safety, which is fueling the consistent demand for magnetic particle automated rail inspection NDT systems. According to the International Trade Administration in August 2024, the German railroad network has a route length of around 39,200 km. Also, country’s push in the direction of a hydrogen-based energy economy, which is generating inspection complexities requiring modern solutions. The rising demand for hydrogen infrastructure, such as high-pressure pipelines and storage tanks. According to the European Hydrogen Observatory, by 2030, the demand for hydrogen is projected to reach 95-130 Terawatt-hours in 2030.
The market growth in France is driven by the rising requirement for testing in the aerospace and nuclear energy sectors. According to the data published by the World Nuclear Association in January 2026, France derives more than 70% of its electricity from nuclear energy with 57 operable reactors, which instills the need for frequent assessment. The market growth is also driven by strict national safety regulations, which command standard inspection across pressure equipment. Moreover, the country’s speeding electric vehicle manufacturing and industrial digitalization strategies are propelling the adoption of digital NDT solutions.
Key Non-Destructive Testing Market Players:
- General Electric (U.S.)
- MISTRAS Group, Inc. (U.S.)
- Olympus Corporation (Japan)
- SGS S.A. (Switzerland)
- Bureau Veritas S.A. (France)
- Intertek Group plc (UK)
- Ashtead Technology Ltd. (UK)
- Nikon Metrology NV (Belgium)
- Magnaflux Corporation (U.S.)
- Eddyfi Technologies (Canada)
- Sonatest Ltd. (UK)
- Applus+ Laboratories (Spain)
- TÜV Rheinland AG (Germany)
- DEKRA SE (Germany)
- Comet Group (Switzerland)
- Previan Technologies, Inc. (Canada)
- NDT Solutions (U.S.)
- Company Overview
- Business Strategy
- Key Product Offerings
- Financial Performance
- Key Performance Indicators
- Risk Analysis
- Recent Development
- Regional Presence
- SWOT Analysis
- General Electric (GE), headquartered in the U.S., is a prominent participant in the global Non-Destructive Testing (NDT) market, with a strong legacy in industrial inspection and advanced sensing technologies. Through its inspection technologies business—now operating as Waygate Technologies (formerly GE Inspection Technologies)—the company provides a comprehensive portfolio of NDT solutions, including digital radiography, computed tomography (CT), ultrasonic testing, phased-array systems, and advanced inspection software.
- MISTRAS Group, Inc., headquartered in the United States, is a leading global provider of non-destructive testing (NDT), asset protection, and integrity management services. The company offers a broad portfolio of inspection solutions, including ultrasonic testing, radiographic testing, acoustic emission testing, eddy current testing, and advanced phased-array technologies, catering to safety-critical industries such as oil & gas, petrochemicals, power generation, aerospace, infrastructure, and manufacturing.
- Olympus Corporation, headquartered in Japan, is a key participant in the global non-destructive testing (NDT) market, recognized for its strong expertise in precision measurement and advanced inspection technologies. The company offers a comprehensive range of NDT solutions, including ultrasonic flaw detectors, phased-array ultrasonic testing systems, eddy current testing instruments, and advanced imaging software, which are widely used across industries such as aerospace, automotive, oil & gas, power generation, and industrial manufacturing.
- Bureau Veritas S.A., headquartered in France, is a leading global provider of testing, inspection, and certification services and plays a significant role in the non-destructive testing (NDT) market. The company delivers a wide range of NDT services, including ultrasonic testing, radiographic testing, magnetic particle inspection, and advanced inspection techniques, supporting industries such as oil & gas, power generation, marine, construction, and industrial manufacturing.
Below is the list of the key players operating in the global non-destructive testing market:
The prominent players are operating in intense competition and are significantly focused on digitalization and service optimization. Various trailblazing companies are investing in modern inspection technologies such as phased array ultrasonic testing and robotic inspection systems. In response to the strict safety regulations across industries such as aerospace and power generation, the market participants are giving importance to data-driven inspection solutions. Moreover, companies are pursuing collaborations with OEMs and technology providers to expand application capabilities.
Corporate Landscape of the Global Non-Destructive Testing (NDT) Market:
Recent Developments
- In November 2025, NDT Solutions (NDTS) announced the launch of OTIS, a next-generation Optical Topographic Inspection System designed to transform quality control in the aerospace industry. Developed in collaboration with Spirit AeroSystems, OTIS replaces traditional tactile gauges and manual recordkeeping with an intelligent optical inspection platform that enhances inspection precision, data capture, and workflow efficiency for complex aerospace components.
- Report ID: 8368
- Published Date: Jan 28, 2026
- Report Format: PDF, PPT
- Explore a preview of key market trends and insights
- Review sample data tables and segment breakdowns
- Experience the quality of our visual data representations
- Evaluate our report structure and research methodology
- Get a glimpse of competitive landscape analysis
- Understand how regional forecasts are presented
- Assess the depth of company profiling and benchmarking
- Preview how actionable insights can support your strategy
Explore real data and analysis
Frequently Asked Questions (FAQ)
Non-Destructive Testing Market Report Scope
Free Sample includes current and historical market size, growth trends, regional charts & tables, company profiles, segment-wise forecasts, and more.
Connect with our Expert


Copyright @ 2026 Research Nester. All Rights Reserved.
