Brittleness Tester Market Outlook:
Brittleness Tester Market size was valued at USD 14.83 billion in 2025 and is likely to cross USD 23.48 billion by 2035, registering more than 4.7% CAGR during the forecast period i.e., between 2026-2035. In the year 2026, the industry size of brittleness tester is assessed at USD 15.46 billion.

Growing product testing and production is anticipated to have a major impact on the market expansion. The brittle temperatures of rubbers, elastomers, and plastics are ascertained via brittleness testing. Consequently, during the projected period, the market will increase as a result of the rise of these sectors.
As stated in chained 2012 currency and assessed in 2022, manufacturing contributed USD 2.3 trillion, or 11.4% of the U.S. GDP, to the economy, according to statistics from the National Institute of Standards and Technology.
Key Brittleness Tester Market Insights Summary:
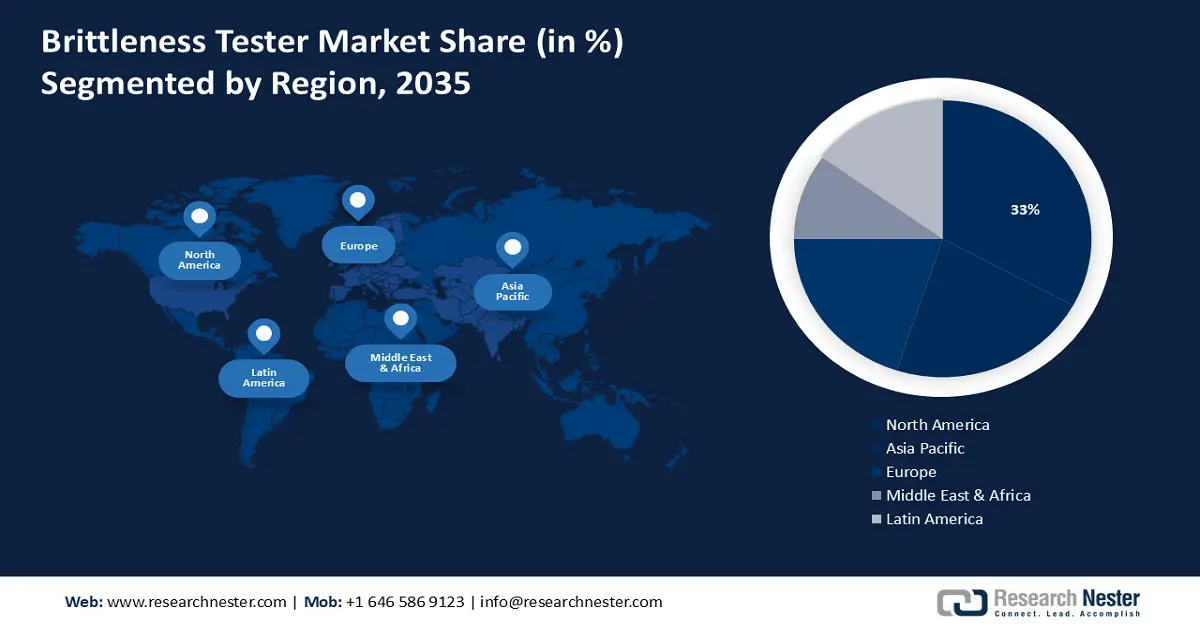
Regional Highlights:
- North America is forecasted to hold a 33% share by 2035 in the brittleness tester market, driven by the automation and integration of robotics in brittleness tester manufacturing.
- Asia Pacific market size is set to cross USD 15 Billion by 2035, impelled by the increasing development of application-specific seals.
Segment Insights:
- Automatic segment is projected to account for around 80% share by 2035 in the brittleness tester market, propelled by accuracy and lesser efforts from humans.
- Healthcare segment is anticipated to be the fastest-growing segment during 2026-2035, owing to the escalating need for enhanced product quality and safety in the pharmaceutical and medical device sectors.
Key Growth Trends:
- Growing demand in the chemical & pharmaceutical industry
- Escalating integration of automation and robotics
Major Challenges:
- High cost of tester
- Challenges posed by the COVID 19 pandemic
Key Players: Qualtech Products Industry Co., Ltd, Testing Machines, Inc., CCSi, Inc., Gotech Testing Machines Inc., Benz Co., Inc.
Global Brittleness Tester Market Forecast and Regional Outlook:
Market Size & Growth Projections:
- 2025 Market Size: USD 14.83 billion
- 2026 Market Size: USD 15.46 billion
- Projected Market Size: USD 23.48 billion by 2035
- Growth Forecasts: 4.7%
Key Regional Dynamics:
- Largest Region: North America (33% Share by 2035)
- Fastest Growing Region: Asia Pacific
- Dominating Countries: United States, Germany, Japan, China, United Kingdom
- Emerging Countries: India, South Korea, Brazil, Mexico, Australia
Last updated on : 1 December, 2025
Brittleness Tester Market - Growth Drivers and Challenges
Growth Drivers
- Growing demand in the chemical & pharmaceutical industry - The market is poised to grow significantly in the coming years, notably due to increased demand for liquid nitrogen. Moreover, substantial opportunities for expansion of the market in the future are expected to be created by increased demand for nitrogen as a biological sample preservation agent. In addition, the market is foreseen to be expanded by the growth of new establishments by the players.
Air Products, a prominent company in the field of industrial gases, has started up new oxygen and nitrogen production plants. In another instance, Air Products formally opened a USD 33 million liquid nitrogen facility at JBS Parkway on June 8, 2022. - Escalating integration of automation and robotics - The adoption of automation and robotics in manufacturing processes is raising the market expansion in the studied period. Brittleness testers can be automated to perform repetitive testing tasks efficiently and consistently, reducing human error and enhancing overall production throughput.
Challenges
- High cost of tester - The main obstacles to market growth in the forecast period are foreseen to be high costs of production and high-value transport.
- Challenges posed by the COVID-19 pandemic - As a result of the COVID-19 outbreak, the industry was immediately shut down, which hurt the market. Exports of raw materials have also been hampered by the lack of imports, and the expansion of the market in the forecast period has been hampered by reduced demand from end users.
Brittleness Tester Market Size and Forecast:
| Report Attribute | Details |
|---|---|
|
Base Year |
2025 |
|
Forecast Year |
2026-2035 |
|
CAGR |
4.7% |
|
Base Year Market Size (2025) |
USD 14.83 billion |
|
Forecast Year Market Size (2035) |
USD 23.48 billion |
|
Regional Scope |
|
Brittleness Tester Market Segmentation:
Type Segment Analysis
Automatic segment is estimated to account for around 80% brittleness tester market share by 2035. Accuracy and lesser efforts from humans can be attributed to the rise in this segment. More accurate and effective test results can be obtained by automatic brittleness testers. Automatic makes it easier for the brittleness test market to be stimulated by a variety of industry needs, e.g. in automotive, electronics, or construction sectors where material fragility is an essential factor that determines product quality and performance.
Application Segment Analysis
Based on application, the healthcare segment in brittleness tester market is anticipated to the fastest-growing segment in the upcoming period. The growth of this industry can be accounted for on the back of the escalating need for enhanced product quality and safety in the pharmaceutical and medical device sectors.
Brittleness testers assess the brittleness of pharmaceutical products like capsules, tablets, and other medical devices in the healthcare sector. In addition to this, the expanding usage of brittleness testers in novel materials in order to develop new drugs and medical devices is another factor impelling the market growth in the projected period.
Our in-depth analysis of the global market includes the following segments:
|
Type |
|
|
Testing Material |
|
|
Application |
|

Vishnu Nair
Head - Global Business DevelopmentCustomize this report to your requirements — connect with our consultant for personalized insights and options.
Brittleness Tester Market - Regional Analysis
North American Market Insights
North America industry is predicted to dominate majority revenue share of 33% by 2035. The market is observing an expansion owing to the automation and integration of robotics in brittleness tester manufacturing. This results in enhanced accuracy, efficiency, and consistency in testing. Furthermore, the adoption of advanced sensors and software allows real-time data collection and analysis resulting in enhanced quality control.
Given the availability of cheaper and more abundant feedstocks, which helps to gain a significant share in the United States, US chemical manufacturers have an advantage. In addition, the market will likely be strengthened by increased government investment. The demand for brittleness tests is likely to be driven by these factors and the market will take advantage of them.
The growth of this market can be ascribed to the growing need in various end-user industries in Canada.
APAC Market Insights
Asia Pacific brittleness tester market size is set to cross USD 15 Billion by 2035. The increasing development of application special seals, which increases the demand for brittle testers, can be attributed to the growth in India's market.
The demand for brittleness testing is evaluated to be driven by increased foreign direct investment in the power sector. From April 2000 to June 2021, the total inflow of foreign direct investment into India's power sector was USD 15.36 billion. In India, the sector contributed 3% of total foreign direct investment inflows. Additionally expanding government initiatives introduced by the government in the region to drive the expansion of the market.
The growing intention of domestic manufacturing and the expanding integration of international quality standards to drive market growth in China.
The brittleness testers are being utilized in an increasingly wide range of applications in Japan. Such as are used to test the brittleness of pharmaceuticals, food packaging, and electronic components.
One of the most significant factors driving the growth of the is growing awareness about product safety in South Korea.
Brittleness Tester Market Players:
- Ray-Ran Test Equipment Ltd
- Company Overview
- Business Strategy
- Key Product Offerings
- Financial Performance
- Key Performance Indicators
- Risk Analysis
- Recent Development
- Regional Presence
- SWOT Analysis
- Elastocon AB
- Qualtech Products Industry Co., Ltd
- Testing Machines, Inc.
- CCSi, Inc
- Gotech Testing Machines Inc
- Benz Co., Inc.
- Ueshima Seisakusho Co., Ltd
The brittleness tester market is highly competitive with companies leading the market growth resulting in enormous expansion across the globe. Details on the ranking of the top companies, key developments, such as recent developments, partnerships, mergers and acquisitions, new products, etc., the company's regional footprint, and the company's industry footprint as compared to the market are included in the competitive landscape section of this report.
Recent Developments
- Ueshima Seisakusho Co.'s Brittleness Tester TM2100 series determines the brittleness and the brittle 50% temperature of vulcanized rubber and plastics in a low-temperature environment. There are two types of cooling systems, the dried ice type and the refrigerator style.
- The RayRan Low Temperature Brittleness Test is designed to investigate the effects of low temperatures on plastic materials when subjected to impact loads that comply with ASTM standards. International standards D746 and ISO R974 for testing.
- Report ID: 6201
- Published Date: Dec 01, 2025
- Report Format: PDF, PPT
- Explore a preview of key market trends and insights
- Review sample data tables and segment breakdowns
- Experience the quality of our visual data representations
- Evaluate our report structure and research methodology
- Get a glimpse of competitive landscape analysis
- Understand how regional forecasts are presented
- Assess the depth of company profiling and benchmarking
- Preview how actionable insights can support your strategy
Explore real data and analysis
Frequently Asked Questions (FAQ)
Brittleness Tester Market Report Scope
Free Sample includes current and historical market size, growth trends, regional charts & tables, company profiles, segment-wise forecasts, and more.
Connect with our Expert


Copyright @ 2026 Research Nester. All Rights Reserved.
