Myelofibrosis Treatment Market Outlook:
Myelofibrosis Treatment Market size was over USD 834.5 million in 2025 and is estimated to reach USD 1,433.9 million by the end of 2035, expanding at a CAGR of 6.2% during the forecast timeline, i.e., 2026-2035. In 2026, the industry size of myelofibrosis treatment is assessed at USD 886.2 million.
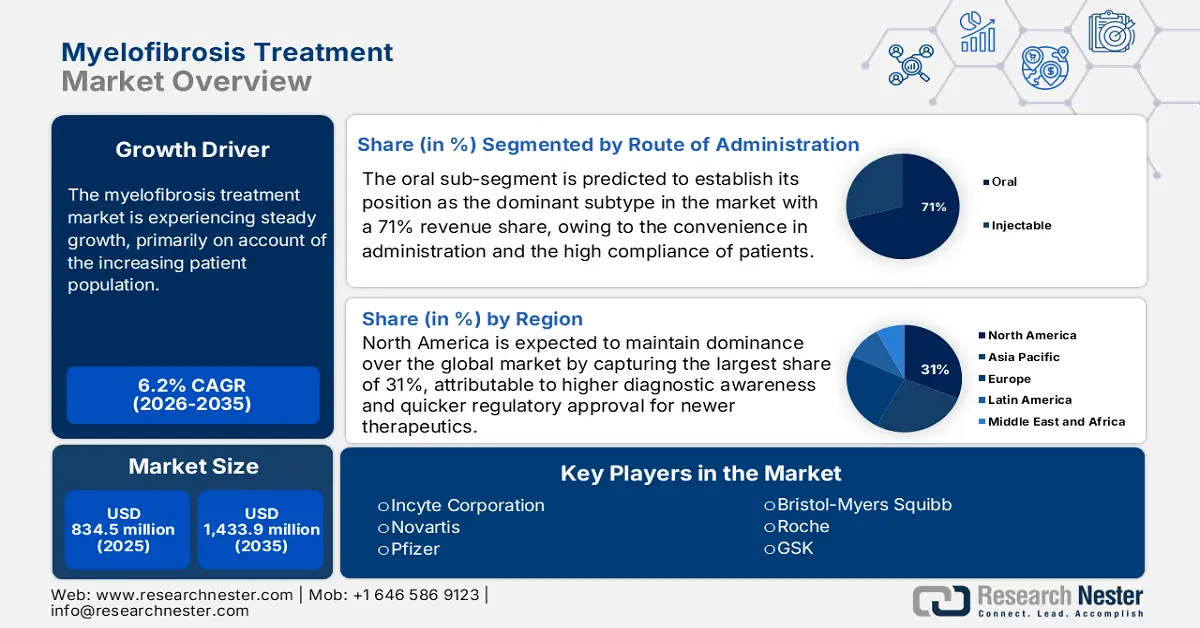
The myelofibrosis treatment market is experiencing steady growth, with an increasing number of patients. According to a report by the National Cancer Institute (NCI), published in May 2025, there were an estimated 18.1 million cancer survivors in the U.S. as of January 2022. The estimated number of cancer patients is expected to increase to 26 million by 2040. Additionally, the disease mainly affects individuals over 60 years of age, and hence, the rapid increase in the geriatric population worldwide is expanding the demographic for this sector. Furthermore, this epidemiological pattern very much contributes to the growing demand in the myelofibrosis treatment market.
There was a continuous inflationary trend in the key economic indicators, which highlighted the presence of price pressure imposed by payers in the myelofibrosis treatment market. As evidenced by the Bureau of Labor Statistics (BLS) in August 2025, the PPI for pharmaceutical preparations decreased by 1.0% YoY from August 2023 to August 2024. In other words, this price pressure has challenged drug manufacturers in the myelofibrosis treatment market to strike a balance between innovation and affordability, especially when higher-cost therapies such as JAK inhibitors are involved. So, the growth of the myelofibrosis treatment market depends more on value-based pricing and better reimbursement support to extend patient access.
Key Myelofibrosis Treatment Market Insights Summary:
Regional Highlights:
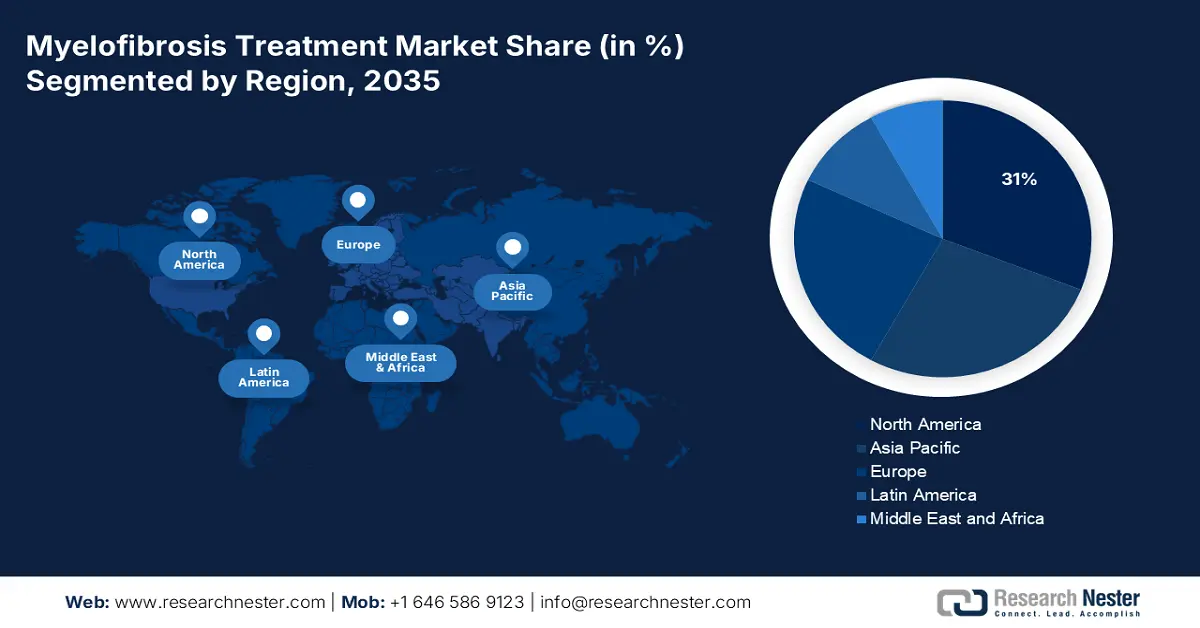
- The North America myelofibrosis treatment market is projected to capture a 31% share by 2035, owing to its advanced healthcare infrastructure, higher diagnostic awareness, and faster regulatory approvals for innovative therapeutics.
- The Europe region is anticipated to be the fastest-growing market during 2026-2035, spurred by increased disease awareness, regulatory progress, and wider access to new therapeutic modalities.
Segment Insights:
- The oral subsegment in the route of administration segment of the myelofibrosis treatment market is projected to account for a 71% share by 2035, propelled by the convenience of administration and high patient compliance.
- The branded drugs subsegment is anticipated to secure the dominant share by 2035, driven by patent protection and continuous innovation in novel therapies.
Key Growth Trends:
- Increasing prevalence and awareness of myelofibrosis
- Advancements in targeted therapies and drug approvals
Major Challenges:
- Strict prescribing restrictions
- High cost of treatment and limited accessibility
Key Players: Incyte Corporation (U.S.), Novartis (Switzerland), Bristol-Myers Squibb (U.S.), Pfizer (U.S.), GSK (UK), Roche (Switzerland), AstraZeneca (UK), Johnson & Johnson (U.S.), Sanofi (France), Merck KGaA (Germany), Dr. Reddy’s (India), Cipla (India), Celltrion (South Korea), Hetero Labs (India), CSL Behring (Australia), Hikma Pharmaceuticals (UK/Jordan), Pharmaniaga (Malaysia).
Global Myelofibrosis Treatment Market Forecast and Regional Outlook:
Market Size & Growth Projections:
- 2025 Market Size: USD 834.5 million
- 2026 Market Size: USD 886.2 million
- Projected Market Size: USD 1,433.9 million by 2035
- Growth Forecasts: 6.2% CAGR (2026-2035)
Key Regional Dynamics:
- Largest Region: North America (31% Share by 2035)
- Fastest Growing Region: Europe
- Dominating Countries: United States, Germany, United Kingdom, France, Japan
- Emerging Countries: China, India, South Korea, Brazil, Australia
Last updated on : 6 October, 2025
Myelofibrosis Treatment Market - Growth Drivers and Challenges
Growth Drivers
- Increasing prevalence and awareness of myelofibrosis: The rising prevalence of myelofibrosis globally is a significant driver for the growth of the myelofibrosis treatment market. Earlier detection and diagnosis middleware potentially see the market expansion due to superior diagnostic techniques and increased knowledge of myelofibrosis among healthcare providers. As per a report by NLM in May 2023, around 15% of the patients suffering from essential thrombocythemia (ET) or polycythemia vera (PV) would develop post-ET/PV myelofibrosis, ever so slightly increasing the patient pool needing specialized treatments. The increase in the patient pool calls for advanced therapeutic options, thus augmenting the need for newer treatments such as JAK inhibitors and other targeted therapies.
- Advancements in targeted therapies and drug approvals: Innovations in drug development, particularly the genesis of targeted therapies, have revolutionized the myelofibrosis treatment market. As per a report by NLM from October 2024, the disease more commonly affects men, with incidence rates ranging from 0.4 to 0.5 cases per 100,000, compared to 0.2 to 0.3 cases per 100,000 in women, generally targeting people around the median age of 65 years. Depending upon the risk scores, median survival could vary drastically from 2.3 to 11.3 years, accentuating the need for a suitably tailored efficacious treatment set.
- Increasing healthcare expenditure and infrastructure development: Rising healthcare expenditures and the advancement of medical infrastructure are the major factors driving the growth of the myelofibrosis treatment market. Governments and private stakeholders invest heavily in providing oncology care, including centers for hematologic cancers. Data from the Centers for Medicare & Medicaid Services (CMS) in June 2025 shows that prescription drug spending went up 11.4% to a whopping USD 449.7 billion in 2023, with even more momentum than the 7.8% growth it witnessed in 2022-contributions to cancer treatment and supportive care being the highest. A better allocation of funds allows for improved access to novel therapies and clinical trials for new therapies in myelofibrosis, hence growing the market in general.
Prognostic Risk Stratification Models Influencing Myelofibrosis Treatment Pathways and Market Dynamics (2022)
|
Variables (Weight) |
DIPSS |
DIPSS+ |
MIPSS-70 |
MIPSS-70+ v2.0 |
MYSEC-PM |
MTSS |
|
Clinical features |
Age >65 y (1) |
Age >65 y (1) |
Constitutional symptoms (1) |
Constitutional symptoms (2) |
Age (0.1 × y of age) |
Age ≥57 y (1) |
|
Complete blood count |
Hb <10 g/dL (2) |
Hb <10 g/dL (1) |
Hb <10 g/dL (1) |
Severe anemia* (2) |
Hb <11 g/dL (2) |
WBC >25×10⁹/L (1) |
|
Driver mutation status |
- |
- |
Absence of CALR type 1/like (1) |
Absence of CALR type 1/like (2) |
Absence of CALR (2) |
Absence of CALR/MPL (2) |
|
Additional myeloid-gene mutations |
- |
- |
1 HMR (1) |
1 HMR incl. U2AF1Q157 (2) |
- |
ASXL1 (1) |
|
Cytogenetics |
- |
Unfavorable‡ (1) |
- |
Unfavorable§ (3) |
- |
- |
|
Bone marrow morphology |
- |
- |
BMF grade ≥2 (1) |
- |
- |
- |
|
Risk category (score), median survival |
Low (0), NR |
Low (0), 15.4 y |
Low (0-1), NR |
Very low (0), NR |
Low (<11), NR |
Source: NLM
Challenges
- Strict prescribing restrictions: The reimbursement gaps imposed by limitations in government policies are still a major hurdle in the myelofibrosis treatment market. This can be evidenced by Medicare providing coverage for only patients with first failure in chemotherapy trials, according to the guidelines of the Centers for Medicare & Medicaid Services (CMS). This ultimately creates treatment delays and causes loss of patient trust. In addition to this, the European Union (EU) restricts ruxolitinib use to only high-risk myelofibrosis cases, limiting patient access to potentially beneficial therapies, as per the EMA.
- High cost of treatment and limited accessibility: Targeted drugs such as JAK inhibitors have stressed the myelofibrosis treatment market with their exorbitant prices. They may have never been an issue in the past with just a few treatment options under development. Better out-of-pocket and reimbursement options, but low-paying regions cannot afford these drugs. High costs discourage patients from initiating treatment or may cause them to refuse to continue treatments, thereby deteriorating the outcomes. The providers of health care must find it challenging to counterbalance innovation while maintaining affordability, as delays they put in directly related to market penetration. Tackling these economic barriers will become paramount in ensuring that treatment truly reaches the homes of many.
Myelofibrosis Treatment Market Size and Forecast:
| Report Attribute | Details |
|---|---|
|
Base Year |
2025 |
|
Forecast Year |
2026-2035 |
|
CAGR |
6.2% |
|
Base Year Market Size (2025) |
USD 834.5 million |
|
Forecast Year Market Size (2035) |
USD 1,433.9 million |
|
Regional Scope |
|
Myelofibrosis Treatment Market Segmentation:
Route of Administration Segment Analysis
The oral subsegment in the route of administration segment is expected to hold the highest market share of 71% within the forecast period due to convenience in administration and the high compliance of patients. Oral medication allows patients to proceed with their treatment at home, limiting frequent visits to the hospital while improving their quality of life. However, as per a report by NLM May 2025, the problem of adherence still exists, with some studies showing that anywhere from 4% to 31% of patients fail to fill their first prescription, while 18% to 34% fail to fill their second, although clear-cut numbers do not exist. Despite all these challenges, other than injection, oral treatment like JAK inhibitors remains the most preferred type because of their non-invasive nature and ease of administration.
Drug Type Segment Analysis
The branded drugs subsegment is expected to hold the highest market share in the drug type segment within the forecast period due to patent protection and constant innovation in novel therapies for myelofibrosis. Most of these drugs are perceived to have an edge in terms of both efficacy and safety when compared to generic drugs, thus swaying their preference among physicians and patients. Furthermore, as per a report by NLM May 2024, while in the past decade, the average net price for brand-name drugs doubled from USD 167 to USD 370, much of this increase can be credited to specialty drug price growth, which registered an annual average growth of 13.2% versus 2.6% for nonspecialty drugs. Such a pricing trend, coupled with limited generic competition, sustains the dominant revenue share of branded drugs.
End user Segment Analysis
The hospital subsegment is expected to hold the highest market share in the end user segment within the forecast period due to the high volumes of complex myelofibrosis treatments performed in hospital settings. Hospitals are well-suited as complete care centers since they can diagnose patients while offering advanced therapies such as stem cell transplantation and monitoring. As the Centers for Medicare & Medicaid Services (CMS) reported in June 2025, hospital expenditures grew 10.4% to USD 1,519.7 billion in 2023, significantly faster than the 3.2% growth recorded in 2022. This shows the increased investment in healthcare infrastructure and services. The presence of specialized oncologists and advanced facilities also supports hospital dominance in this market.
Our in-depth analysis of the global myelofibrosis treatment includes the following segments:
|
Segment |
Sub-segments |
|
Treatment Type |
|
|
Drug Type |
|
|
Route of Administration |
|
|
Patient Type |
|
|
End user |
|
|
Distribution Channel |
|

Vishnu Nair
Head - Global Business DevelopmentCustomize this report to your requirements — connect with our consultant for personalized insights and options.
Myelofibrosis Treatment Market - Regional Analysis
North America Market Insights
The myelofibrosis treatment market in North America is projected to hold the highest market share of 31% within the forecast period, owing to its well-established healthcare infrastructure, higher diagnostic awareness, and quicker regulatory approval for newer therapeutics. For example, as per a report by NLM in March 2024, there were an estimated 3,600 new cases of primary bone cancers diagnosed in the U.S. alone in the past 5 years, with deaths as many as 1720, or 0.3% of all cancer deaths. This disease commonly comes with co-morbidities such as anemia and splenomegaly that increase the multifactorial nature of treatment and cost.
The myelofibrosis treatment market in the U.S. is growing due to its position as a leading national healthcare spender, providing high per capita access to novel therapies, and has a regulatory environment that increasingly favors approvals of targeted hematologic agents. According to a report by NLM in March 2024, the overall 5-year survival rate of 66% in the U.S. for patients with bone cancers signals strong pipeline activity and future therapeutic adoption possibilities. Due in part to somewhat mature reimbursement ecosystems and high willingness to pay for breakthrough therapies, manufacturers can introduce truly novel modalities such as JAK inhibitors, next-gen targeted agents, and combination therapeutics much faster in the U.S. markets.
The myelofibrosis treatment market in Canada is growing, with recent developments setting the hematologic oncology field. According to a report by Statistics Canada in January 2025, there were 861,000 Canada-based population aged 85 or older, representing 2.3% of the population. Since incidences of myelofibrosis and its related myeloproliferative neoplasms tend to rise with age, this aging demographic experiences a slow growth in the treated population. In addition, the report also discussed how the proportion aged 65+ had stepped up to 18.9%, keeping with an aging trend. Approval pathways through Health Canada have started to open new therapeutic possibilities.
Europe Market Insights
The myelofibrosis treatment market in Europe is expected to hold the fastest-growing market within the forecast period, driven by increased disease awareness, regulatory advancements, and increasing access to newer modes of therapy. According to a clinical study by the NLM report in March 2022, 26.8% of patients developed iron deficiency, similar between genders but with an age-dependent variation: 35.6% in those above 80 years of age, 29.3% in those between 75 and 79 years, and 23.2% in those between 70 and 74 years. The European Medicines Agency approved momelotinib for myelofibrosis patients with moderate or severe anemia. This not only enriches the therapeutic landscape but also stands as testimony toward fulfilling these needs across hematologic oncology in the region.
The myelofibrosis treatment market in the UK is growing due to the increasing prevalence of the disease and the availability of newer therapies. A real-world study conducted by NLM in February 2025 reported anemia was reported in 6.0% of the population of England, with an estimated prevalence rate of 4.1% in females and 3.1% in males. This indicates a need for the treatment of myelofibrosis-related anemia. This positive outlook is expected to improve adoption rates and further contribute to the enlargement of the market. With the well-established healthcare infrastructure and highly supportive regulatory environment in the UK, timely introduction and reimbursement of innovative therapies can be managed, setting a positive trajectory for further growth in the market.
The myelofibrosis treatment market in Germany is growing due to increasing disease incidence, multiple treatment options, and the strong healthcare system. As per an analysis report by NLM in August 2023, the estimated incidence of myelofibrosis is between 9.9 and 12.4 per 100,000 people, with the new cases in that year estimated to range between 1.2 and 1.8 per 100,000 people. This highlights the importance of the disease in the population and necessitates strategies for its treatment. Inclusion of the newer therapies, such as momelotinib, and extensive health care coverage ensure that all persons have a fair chance to get the best treatment and allow for the expansion of the market.
Analysis of Current Healthcare Expenditure in Europe, 2022 (in %)
|
Country |
Government Schemes |
Compulsory Schemes & Saving Accounts |
Other Financing Agents |
Curative & Rehabilitative Care |
Medical Goods (Non-Specified) |
Other Functions |
Hospitals |
Ambulatory Providers |
Retailers & Medical Goods Providers |
Other Providers |
|
Belgium |
21.0 |
54.1 |
24.9 |
54.2 |
12.8 |
33.0 |
33.0 |
39.0 |
30.0 |
20.4 |
|
Bulgaria |
15.9 |
47.6 |
36.5 |
51.5 |
33.0 |
15.5 |
15.5 |
36.7 |
15.0 |
15.8 |
|
Czechia |
13.5 |
71.4 |
15.1 |
58.3 |
16.1 |
25.6 |
25.6 |
46.5 |
22.4 |
19.2 |
|
Denmark |
84.6 |
0.0 |
15.4 |
59.4 |
10.4 |
30.1 |
30.1 |
44.9 |
26.0 |
18.6 |
|
Germany |
11.7 |
75.0 |
13.3 |
45.9 |
17.8 |
36.3 |
36.3 |
26.9 |
30.8 |
24.7 |
|
France |
4.3 |
80.4 |
15.3 |
51.7 |
19.1 |
29.2 |
29.2 |
38.9 |
22.4 |
22.0 |
|
Italy |
74.3 |
0.2 |
25.6 |
53.4 |
20.2 |
26.5 |
26.5 |
43.5 |
24.2 |
15.1 |
Source: Eurostat
Asia Pacific Market Insights
The myelofibrosis treatment market in the Asia Pacific region is experiencing steady growth as a result of enhanced awareness, better health care infrastructure, and the availability of newer drugs. According to the OECD, as of November 2025, household out-of-pocket expenditure as a proportion of total health spending was 49% in low and lower-middle-income Asian-Pacific nations, according to recent estimates. Such a high economic burden has the potential to restrict access to costly treatments such as JAK inhibitors or recently approved medications in the management of myelofibrosis. Thus, whereas urban and more affluent sections might be spoiled with therapeutic innovations, the majority of society can be underserved.
The myelofibrosis treatment market in China is expanding due to better therapies and greater patient awareness. According to the report by NLM in June 2023, mainland China had contributed to around 37% of total incident acute lymphoblastic leukemia (ALL) cases worldwide and to around 25% of all deaths worldwide. The higher incidence of hematologic malignancies illustrates the large unmet needs in cancer care and the pressing necessity for early diagnosis and access to directed therapy. Although myelofibrosis is not as common as all, the institutional and clinical capabilities that are available for treating high-incidence blood cancers should be adequate for treating the expansion of diagnostic and treatment facilities for uncommon diseases such as myelofibrosis.
The myelofibrosis treatment market in India is growing due to rising awareness levels and newer drug options. As per a report by NLM in June 2024, Leukemia holds the highest order in terms of childhood cancers, constituting 28% of all cases. This explains the likely efficacy of luspatercept to combat anemia brought about by myelofibrosis in Indian patients. The growing prevalence of hematology disorders has attracted more clinical focus to early diagnosis and high-tech therapy interventions. Additionally, private and public healthcare schemes are further intensifying metropolitan access to specialist care, supporting market growth.
Key Myelofibrosis Treatment Market Players:
- Incyte Corporation (U.S.)
- Company Overview
- Business Strategy
- Key Product Offerings
- Financial Performance
- Key Performance Indicators
- Risk Analysis
- Recent Development
- Regional Presence
- SWOT Analysis
- Novartis (Switzerland)
- Bristol-Myers Squibb (U.S.)
- Pfizer (U.S.)
- GSK (UK)
- Roche (Switzerland)
- AstraZeneca (UK)
- Johnson & Johnson (U.S.)
- Sanofi (France)
- Merck KGaA (Germany)
- Dr. Reddy’s (India)
- Cipla (India)
- Celltrion (South Korea)
- Hetero Labs (India)
- CSL Behring (Australia)
- Hikma Pharmaceuticals (UK/Jordan)
- Pharmaniaga (Malaysia)
The commercial dynamics of the myelofibrosis treatment market are intensified with the competitive accomplishments of key players. The sector is primarily controlled by the collective dominance of Incyte, Novartis, and Bristol-Myers Squibb, accounting for more than half of global revenue. These leaders employ diverse strategies, such as regional expansion and product innovation, to conquer the wave of globalization of the merchandise. On the other hand, Takeda and Dr. Reddy are pioneering through localization and biosimilar emergence, signaling a shift in preference for market operations.
Here is a list of key players operating in the global market:
Recent Developments
- In July 2025, Sumitomo Pharma America, Inc. announced that EMA had granted the Orphan Drug Designation to nuvisertib (TP-3654), which is an investigational, highly selective inhibitor of PIM1 kinase.
- In June 2024, GSK’s drug Omjjara got approved in Japan to treat myelofibrosis, which is a rare blood cancer. It can be used for both new patients and those who have been treated before. With Omjjara’s approval, patients in Japan now have a new treatment option that can help with anemia and other symptoms of myelofibrosis.
- Report ID: 7988
- Published Date: Oct 06, 2025
- Report Format: PDF, PPT
- Explore a preview of key market trends and insights
- Review sample data tables and segment breakdowns
- Experience the quality of our visual data representations
- Evaluate our report structure and research methodology
- Get a glimpse of competitive landscape analysis
- Understand how regional forecasts are presented
- Assess the depth of company profiling and benchmarking
- Preview how actionable insights can support your strategy
Explore real data and analysis
Frequently Asked Questions (FAQ)
Myelofibrosis Treatment Market Report Scope
Free Sample includes current and historical market size, growth trends, regional charts & tables, company profiles, segment-wise forecasts, and more.
Connect with our Expert


Copyright @ 2026 Research Nester. All Rights Reserved.
