Industrial Nitrogen Market Outlook:
Industrial Nitrogen Market size was USD 31.19 billion in 2025 and is projected to reach USD 58.52 billion by the end of 2035, expanding at a CAGR of 6.5% during the forecast period, i.e., 2026-2035. In 2026, the industry size of industrial nitrogen is assessed at USD 33.23 billion.
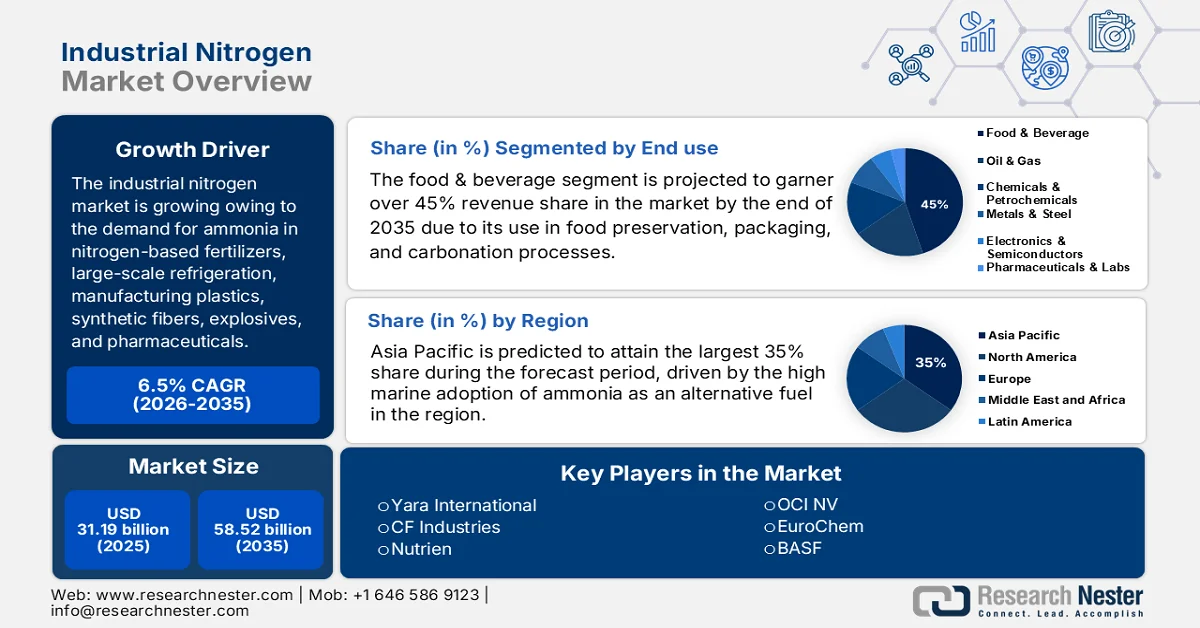
The industrial nitrogen market high demand for ammonia in nitrogen-based fertilizers, large-scale refrigeration, manufacturing plastics, synthetic fibers, explosives, pharmaceuticals, and as a cleaning agent is the predominant driver for the industrial nitrogen market, primarily used for the industrial production of ammonia. In the U.S., 18 companies produced ammonia at 37 plants, while 2 other facilities remained idle in 2024. Approximately 55% of the overall ammonia production capacity was concentrated in Oklahoma, Louisiana, and Texas owing to their prominent large reserves of natural gas. The U.S. plants in 2024 operated at 80% of their rated capacity.
Estimated World Ammonia Production & Reserves*
|
Country/Region |
2023 |
2024 |
|
United States |
13,800 |
14,000 |
|
Algeria |
2,000 |
2,000 |
|
Australia |
1,300 |
1,300 |
|
Canada |
3,600 |
3,600 |
|
China |
47,000 |
47,000 |
|
Egypt |
4,500 |
5,000 |
|
Germany |
1,720 |
1,700 |
|
India |
15,300 |
15,000 |
|
Indonesia |
5,800 |
6,000 |
|
Iran |
4,200 |
4,200 |
|
Malaysia |
1,400 |
1,400 |
|
Netherlands |
2,000 |
2,000 |
|
Nigeria |
1,700 |
1,700 |
|
Oman |
2,000 |
2,000 |
|
Pakistan |
3,500 |
3,500 |
|
Poland |
1,560 |
1,600 |
|
Qatar |
3,050 |
3,100 |
|
Russia |
14,000 |
14,000 |
|
Saudi Arabia |
5,400 |
5,400 |
|
Trinidad and Tobago |
3,220 |
3,200 |
|
Uzbekistan |
1,300 |
1,300 |
|
Vietnam |
1,440 |
1,400 |
|
Other countries |
12,300 |
13,000 |
|
World total (rounded) |
152,000 |
150,000 |
*Available atmospheric nitrogen and sources of natural gas for the production of ammonia were considered
Source: USGS
Furthermore, the U.S. is among the top ammonia makers and consumers on the global stage. Ammonium sulfate, ammonium phosphates, nitric acid, ammonium nitrate, and urea were, in ascending order of produced quantity. Over 88% of domestic ammonia generated was intended for fertilizer usage, comprising anhydrous ammonia, urea, ammonium phosphates, ammonium nitrates, and other nitrogen compounds. As per the United States Geology Survey (USGS) 2025 report, the worldwide annual capacity is estimated to grow at a 7% rate by 2028. This capacity addition is predicted in areas with low-cost natural gas availability, including in the Asia Pacific, North America, and Eastern Europe.
U.S. Ammonia Domestic Production & Usage (Data in thousand metric tons, nitrogen content)
|
Indicator |
2020 |
2021 |
2022 |
2023 |
2024 |
|
Production |
14,000 |
12,700 |
13,800 |
13,800 |
14,000 |
|
Imports for consumption |
1,990 |
2,080 |
1,930 |
1,720 |
1,800 |
|
Exports |
369 |
231 |
719 |
890 |
880 |
|
Consumption, apparent |
15,700 |
14,600 |
14,800 |
14,700 |
15,000 |
|
Stocks, producer, year-end |
310 |
270 |
440 |
350 |
440 |
|
Average price (FOB Gulf Coast) (USD per short ton) |
213 |
578 |
1,070 |
470 |
440 |
|
Plant employment (number) |
1,600 |
1,600 |
1,600 |
1,600 |
1,600 |
|
Net import reliance (% of apparent consumption) |
11% |
13% |
7% |
6% |
6% |
Source: USGS
The industrial nitrogen market key feedstock for nitrogen generation, natural gas, and its gradual pricing evolution have directly impacted the nitrogen supply chain and industrial nitrogen market proliferation. The USGS 2024 data shows that the Henry Hub spot price for natural gas ranged between USD 1.25 and USD 3.52 per million British thermal units (Btu), with an approximate average of USD 2.10 per million Btu. In 2024, natural gas cost was lower than that in 2023. This was a result of more than the average storage levels, specifically during the warmer winter weather. Furthermore, at the beginning of 2024, the Gulf Coast average ammonia casts were USD 478 per short ton, later slumped in late May to USD 364 per short ton, and surged in late September to USD 510 per short ton. The average 2024 ammonia cost was USD 440 per short ton. As per the EIA, the U.S. demand for liquefied natural gas exports in 2025 swelled by 3 billion cubic feet per day (Bcf/d). Relatively lower LNG costs during summer were owing to record high generation (4.5 Bcf/d), and the spot prices showcased a steady rise toward the end of 2025 due to November-December polar vortex, briefly pushing costs over USD 5.00/MMBtu.
Henry Hub Natural Gas Spot Price (Dollars per Million Btu)
|
Year |
Jan |
Feb |
Mar |
Apr |
May |
Jun |
Jul |
Aug |
Sep |
Oct |
Nov |
Dec |
|
1997 |
3.45 |
2.15 |
1.89 |
2.03 |
2.25 |
2.20 |
2.19 |
2.49 |
2.88 |
3.07 |
3.01 |
2.35 |
|
2000 |
2.42 |
2.66 |
2.79 |
3.04 |
3.59 |
4.29 |
3.99 |
4.43 |
5.06 |
5.02 |
5.52 |
8.90 |
|
2010 |
5.83 |
5.32 |
4.29 |
4.03 |
4.14 |
4.80 |
4.63 |
4.32 |
3.89 |
3.43 |
3.71 |
4.25 |
|
2020 |
2.02 |
1.91 |
1.79 |
1.74 |
1.75 |
1.63 |
1.76 |
2.30 |
1.92 |
2.39 |
2.61 |
2.58 |
|
2021 |
2.71 |
5.35 |
2.62 |
2.66 |
2.91 |
3.26 |
3.84 |
4.07 |
5.16 |
5.51 |
5.05 |
3.76 |
|
2022 |
4.38 |
4.69 |
4.90 |
6.60 |
8.14 |
7.70 |
7.28 |
8.81 |
7.88 |
5.66 |
5.45 |
5.53 |
|
2023 |
3.27 |
2.38 |
2.31 |
2.16 |
2.15 |
2.18 |
2.55 |
2.58 |
2.64 |
2.98 |
2.71 |
2.52 |
|
2024 |
3.18 |
1.72 |
1.49 |
1.60 |
2.12 |
2.54 |
2.07 |
1.99 |
2.28 |
2.20 |
2.12 |
3.01 |
|
2025 |
4.13 |
4.19 |
4.12 |
3.42 |
3.12 |
3.02 |
3.20 |
2.91 |
2.97 |
3.19 |
3.79 |
4.26 |
|
2026 |
7.72 |
Source: EIA
Key Industrial Nitrogen Market Insights Summary:
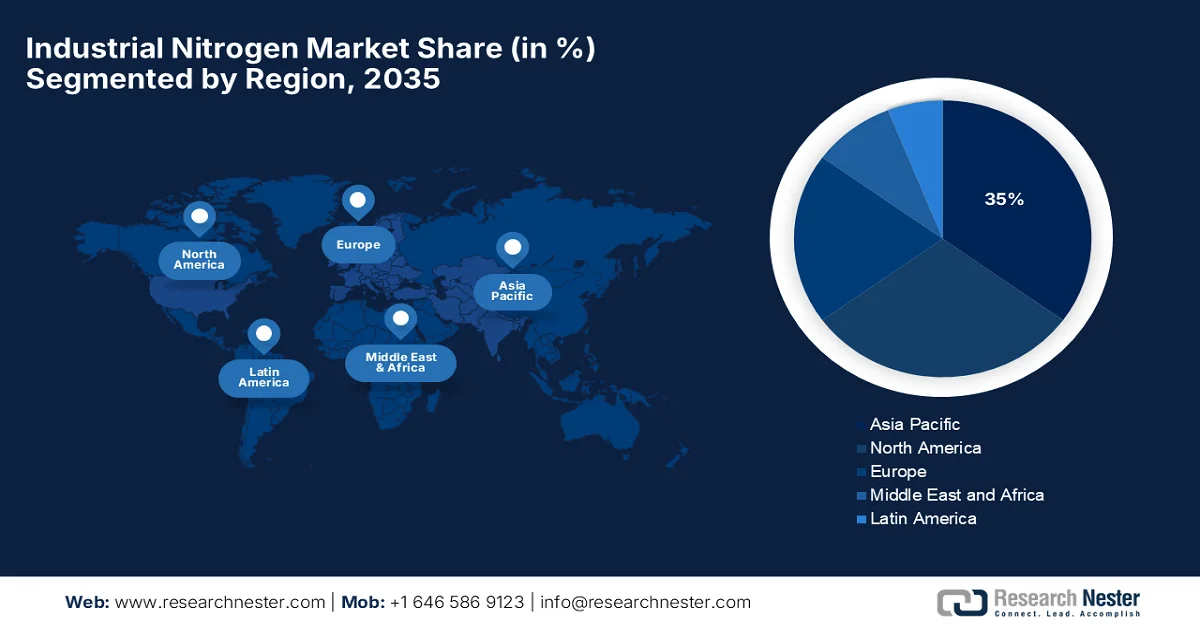
Regional Highlights:
- Asia Pacific in the industrial nitrogen market is projected to hold around 35% share by 2035, attributed to the high concentration of marine cargo shipments and expanding trade activities across rapidly developing economies.
- North America is anticipated to capture a notable share by 2035, supported by the strengthening chemical sector and rising agricultural chemical production across the region.
Segment Insights:
- The food & beverage segment in the industrial nitrogen market is anticipated to account for over 45% revenue share by 2035, propelled by increasing demand for nitrogen-based packaging to extend shelf life and prevent oxidation in food products.
- The cylinder delivery type segment is expected to dominate during the forecast period 2026-2035, impelled by rising demand for high-purity nitrogen in low to moderate volume applications across chemicals and advanced materials industries.
Key Growth Trends:
- High demand for nitrogen in fertilizer production
- Ammonia adoption as a maritime fuel for international shipping
Major Challenges:
- Price Volatility
Key Players: Yara International (Oslo, Norway), CF Industries (Deerfield, IL, U.S.), Nutrien (Saskatoon, Canada), OCI NV (Amsterdam, Netherlands), EuroChem (Zug, Switzerland), BASF (Ludwigshafen, Germany), Fertiglobe (Abu Dhabi, UAE), SABIC (Riyadh, Saudi Arabia), Ma'aden (Riyadh, Saudi Arabia), ICL Group (Israel Chemicals) (Tel Aviv, Israel), Sinofert Holdings (Beijing, China), China BlueChemical (Tianjin, China), Acron Group (Moscow, Russia), Koch Industries / Koch Fertilizers (Wichita, KS, U.S.), IFFCO (Indian Farmers Fertiliser Cooperative) (New Delhi, India), Coromandel International (Chennai, India), Chambal Fertilisers (Gurugram, India), Rashtriya Chemicals & Fertilizers (Mumbai, India), ICL Fertilizers (subsidiary of ICL Group) (Tel Aviv, Israel), Linde plc (Dublin, Ireland).
Global Industrial Nitrogen Market Forecast and Regional Outlook:
Market Size & Growth Projections:
- 2025 Market Size: USD 31.19 billion
- 2026 Market Size: USD 33.23 billion
- Projected Market Size: USD 58.52 billion by 2035
- Growth Forecasts: 6.5% CAGR (2026-2035)
Key Regional Dynamics:
- Largest Region: Asia Pacific (35% Share by 2035)
- Fastest Growing Region: Europe
- Dominating Countries: United States, China, India, Germany, Japan
- Emerging Countries: South Korea, Brazil, Mexico, Indonesia, Vietnam
Last updated on : 24 March, 2026
Industrial Nitrogen Market - Growth Drivers and Challenges
Growth Drivers
- High demand for nitrogen in fertilizer production: The industrial nitrogen market worldwide ammonia generated expanded to 189.8 Mt, by 2% in 2023-2024, and the urea output was at a record high of 199.7 Mt. Ammonia capacity growth stood at roughly 4% between 2023 and 2025, and 200.7 Mt N in volume terms. Nitrogen capacity expansion was concentrated in low-cost countries, primarily the U.S., wherein tax incentives significantly enhanced the investments in blue ammonia, and Russia, where many constructions project utilize natural gas. According to the International Fertilizer Association (IFA), about 1.3 Mt N of green ammonia was onstream in 2025, and the volume prospective under construction is projected to reach 5.3 Mt N by 2028, considering green ammonia’s potential as an eco-friendly nitrogen, along with adjacent energy industrial nitrogen market positioning as a hydrogen carrier. The noteworthy drivers responsible for this nitrogen growth trajectory include low-cost project developments in Iran, along with the U.S. and Russia, green ammonia capacity proliferation in China, and import-displacement facilities in India.
Global N Consumption, Mt N
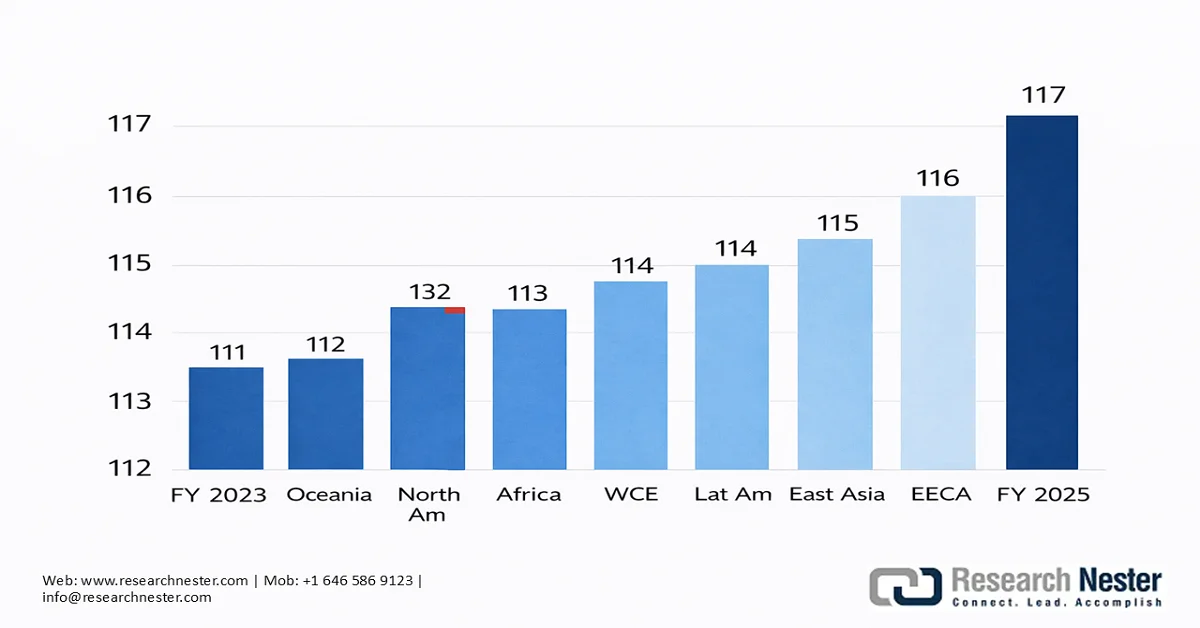
Source: IFA
The overall industrial nitrogen market growth in agricultural activities has fueled the use of nitrogen-based fertilizers. In the U.S., large-scale corn cultivation has predominantly maintained the continued demand for ammonia or nitrogen fertilizers. The U.S. Department of Agriculture stated that the states’ corn cultivators planted 37.0 million hectares between July 2023 and Jun 2024. In China, the food security objectives were reinforced by the government post the COVID-19 crisis in response to stagnation in crop output, thereby boosting nitrogen usage. In addition, the government established policies to avert domestic fertilizer price surges by curbing urea and exports of urea, monoammonium phosphate (MAP), and diammonium phosphate (DAP) since late 2021. Nitrogen fertilizer adoption in China increased in FY 2024 after years of weakening domestic consumption.
Asia Pacific and Eastern Europe and Central Asia (EECA) account for the largest share of nitrogen fertilizers, with the top five contributing players comprising India (roughly 1 Mt N), Russia (approximately 0.5 Mt N), Indonesia, China, and Ukraine, denoting over 50% of worldwide growth. In the abovementioned countries, most agriculturalists pay prices lower than the international rate due to supportive government policies. Similarly, in Indonesia, the government is pushing maize cultivation and provides a subsidized three-component mixture of nitrogen (N), phosphorus (P), and potassium (K) or NPK, and urea fertilizers to smallholder farmers. In 2024, the quantity of subsidized manures doubled from 4.7 Mt to 9.55 Mt, summing up to two-thirds of the domestic consumption of fertilizers.
- Ammonia adoption as a maritime fuel for international shipping: Approximately 95% of freight transport operations are concentrated at sea, consuming roughly 10% of the cumulative transport energy and contributing to 2.6% of worldwide greenhouse gas (GHG) emissions. The International Maritime Organization’s (IMO) Initial GHG Strategy aims to cut emissions by 50% of the 2008 level by 2050. More shipping companies are now committed to better align themselves with GHG targets. For instance, Maersk’s ambitions to achieve net zero by 2050 are set to materialize by integrating ammonia as a shipping fuel. Considering its existing fleet of 750 container ships, Maersk is anticipated to require 20 Mt of ammonia in solidarity, annually. Moreover, marine vessels have a lifetime of about 25 years, inferring that funding for decarbonization must be functional by 2030, in order to meet 2050 targets.
According to IRENA, a consortium of companies in this arena has expressed interest in adopting ammonia as an international maritime fuel source. The IRENA 2022 report suggests that industrial nitrogen market as a marine fuel is projected to hold a demand 1 000 Mt of by 2050. In a 1.5°C sustainability scenario, this demand would reach 197 Mt, comprising 183 Mt for international shipping and the remaining 15 Mt for domestic shipping.
List of Selected Consortia for Ammonia Demonstrations in the Maritime Sector
|
Project |
Duration |
Aim |
|
MAN two-stroke ammonia engine (Denmark) |
2019-2024 |
USD 5 million project led by MAN Engines to develop the first ammonia-fuelled two-stroke engine by 2022, and commercialized in 2024 |
|
Getting to Zero Coalition (Global) |
2019 - |
Global coalition investigating pathways to decarbonize international shipping. Headed by Friends of Ocean Action, Global Maritime Forum, and World Economic Forum |
|
Wärtsilä four-stroke ammonia engine (Norway) |
2020-2023 |
Project led by Wärtsilä to test an ammonia-fuelled four-stroke engine at full scale and in the long term, supported by a USD 2 million grant from the Norwegian Research Council |
|
ShipFC Ammonia project (Europe) |
2020-2024 |
A 14-member consortium of European industrial companies and research organisations, coordinated by NCE Maritime CleanTech. The Viking Energy ship retrofitted with a 2 MW ammonia-fuelled solid oxide fuel cell. The total project budget is around USD 28 million |
|
Zero Emissions from Ships Using Ammonia Fuel (Japan) |
2020 - |
NYK Line, Japan Marine United Corporation, IHI Power Systems, and Nippon Kaiji Kyokai (ClassNK) signed a joint R&D agreement for the commercialization of ammonia-fueled ships, including a gas carrier, a barge for offshore bunkering, and a tugboat |
|
Mærsk Mc-Kinney Møller Center for Zero Carbon Shipping (Denmark) |
2020 - |
This research institute intends to develop new fuel types and technologies to decarbonize the maritime sector |
Source: IRENA
Current And Projected Ammonia Production by Source & Demand, by Sector
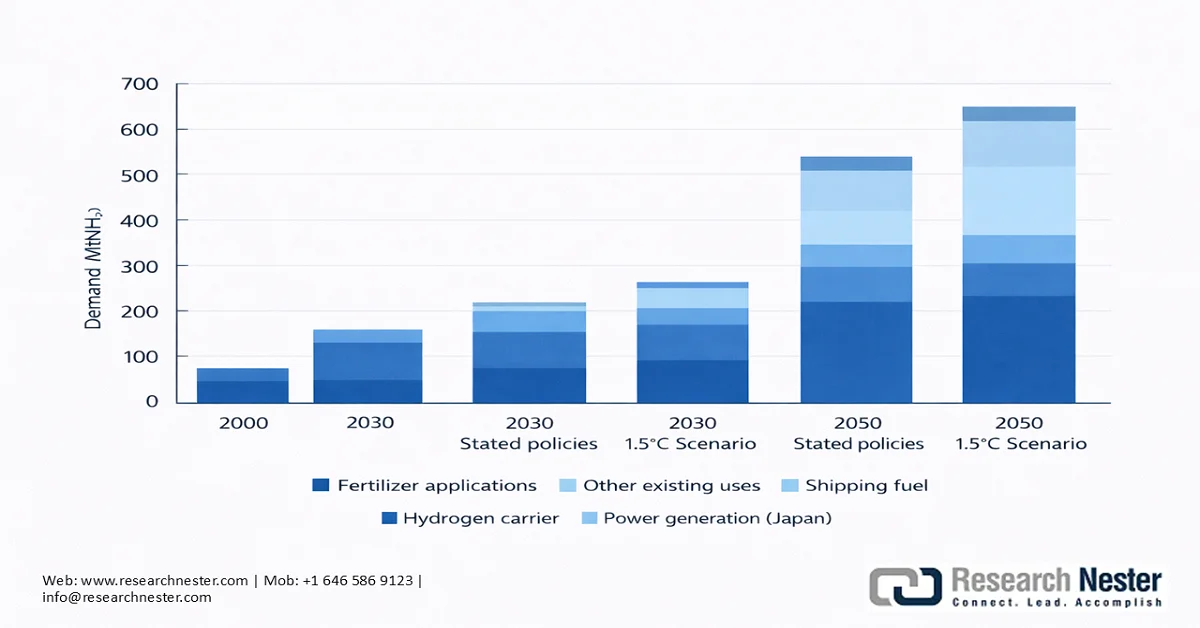
Source: IRENA
Ammonia Demand Estimates for Use as Maritime Fuel by 2050 from Various Sources
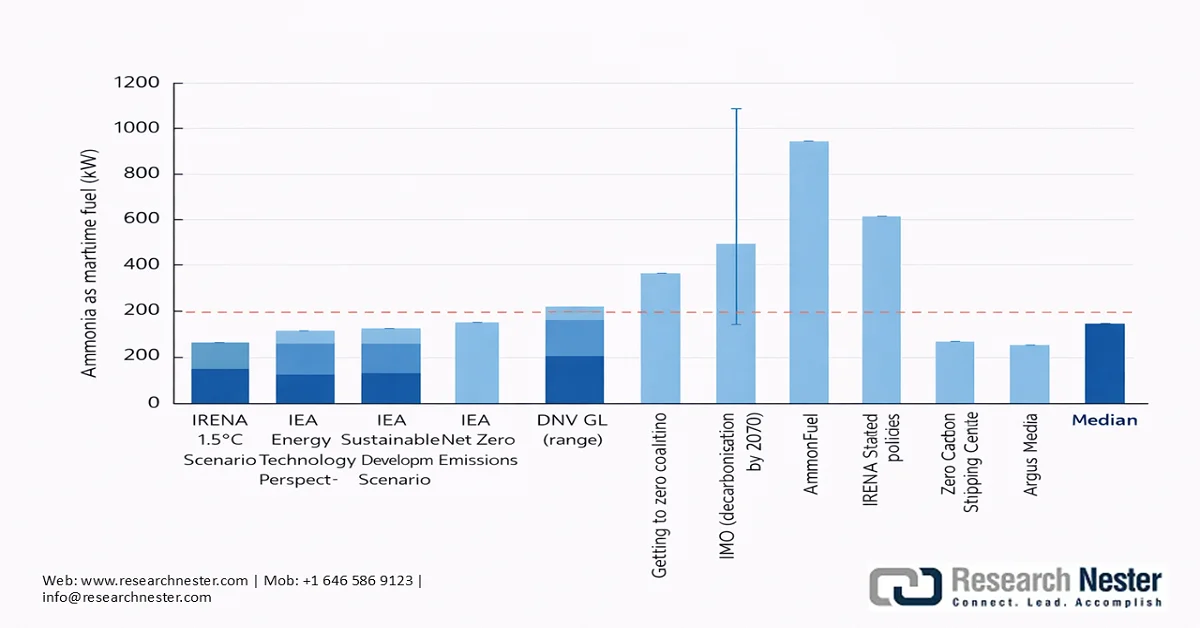
Source: IRENA
Challenges
- Price Volatility: Industrial nitrogen market prices are subject to geopolitical and environmental factors. For example, the Russia-Ukraine conflict led to an uptick in fertilizer costs as Russia accounted for 13% of the total fertilizer trade in 2020, comprising three major types: phosphate, nitrogen, and potash. This disruption was propelled by the tariffs imposed on Russia at the start of 2022. However, fertilizer costs rebounded to the 2021 levels in 2023. Similar such developments have the potential to adversely impact the crop yield in low to middle-income nations.
Industrial Nitrogen Market Size and Forecast:
| Report Attribute | Details |
|---|---|
|
Base Year |
2025 |
|
Forecast Year |
2026-2035 |
|
CAGR |
6.5% |
|
Base Year Market Size (2025) |
USD 31.19 billion |
|
Forecast Year Market Size (2035) |
USD 58.52 billion |
|
Regional Scope |
|
Industrial Nitrogen Market Segmentation:
End use Segment Analysis
The food & beverage segment is projected to garner over 45% industrial nitrogen market revenue share by the end of 2035. A World Health Organization (WHO) Expert Committee – the Joint Food and Agriculture Organization on Food Additives (JECFA) has assessed the utility and safety of food-grade nitrogen and rendered it safe when the Good Manufacturing Practice is well followed by manufacturers. Packaged food air contains 78% nitrogen and 21% oxygen, with a subjective amount of moisture. On exposure to atmospheric air, unsaturated fatty acids result in rancid off-flavors. Consequently, nitrogen has presented itself as a potent way of preserving desirable food quality and prolonging the shelf life. The industrial nitrogen market has been widely used as a packaging gas, particularly to prevent oxidation in vegetables, snacks, candies, breakfast cereals, bakery items, dried fruits, and processed meat.
Delivery Model Segment Analysis
The cylinder delivery type is projected to dominate the delivery mode segment during the forecast period in the industrial nitrogen market, especially suited for end users with low to moderate volume needs in applications like purging, inerting, pressure testing, modified atmosphere packaging, and laboratory work, where reliability and purity are more important than volume. This segment has witnessed noteworthy demand from the chemicals (including the petrochemicals vertical) and advanced materials that mandate the use of high-purity industrial nitrogen market.
Our in-depth analysis of the industrial nitrogen market includes the following segments:
|
Segment |
Subsegments |
|
End use |
|
|
Delivery Model |
|
|
Product |
|
|
Production Technology |
|

Vishnu Nair
Head - Global Business DevelopmentCustomize this report to your requirements — connect with our consultant for personalized insights and options.
Industrial Nitrogen Market - Regional Analysis
APAC Market Insights
Asia Pacific in the industrial nitrogen market is projected to hold the largest 35% share during the assessment period, owing to the high concentration of marine cargo shipments in the region. In 2021, the Asia Pacific emerged as the world’s top hub for loading and discharging cargoes, with a contribution of 64% in imports and 42% in exports, as stated by the UN Conference on Trade and Development (UNCTAD) in 2022. APAC has some of the fastest-developing countries in the world that indicates strong global ties in trade and marine freight. In developing nations, growth was 6.8%, wherein East Asia grew by 6.5% and South Asia by 6.8%. Particularly, India’s growth was 8.2%, and China’s was 8.1%, despite the prevalence of COVID-19 in Q2 of 2021. However, Japan’s recovery was slower, with its GDP increasing by 1.7% in 2021. The outbound containerized trade swelled due to consumer demand. Containerized trade performed well in 2021, boosted by pandemic-led demand and restocking of consumer goods, particularly from East Asia. Volume in trade, which in 2020 had declined by 1.3%, exceeded 165 million 20-foot equivalent units (TEU), thereby rebounding in 2021.
In 2021, China, Japan, the Republic of Korea, and Vietnam were among the top container exporters in the world, wherein China alone captured 30% of the containerized export share. Although liquified natural gas (LNG) continues to be a popular alternative fuel, more and more ships are using ammonia. Fleet owners are now turning to dual-fuel (adaptable) vessels. The UNCTAD report also elaborates that as of March 2022, approximately 40% the orderbook was of ships compatible with ammonia and other alternative fuels, and as of June 2022, the main countries ordering ammonia fuel-capable vessels were the Republic of Korea (70%), China (26%), and Japan (17%).
Asia Pacific Nitrogen Supply, Demand, & Balance 2016-2022 (thousand tons N)
|
Metric |
2016 |
2017 |
2018 |
2019 |
2020 |
2021 |
2022 |
|
Ammonia - Capacity |
102,152 |
103,416 |
104,113 |
105,472 |
102,972 |
103,346 |
104,755 |
|
Ammonia - Supply Capability |
88,229 |
87,675 |
88,138 |
89,968 |
87,751 |
87,913 |
88,947 |
|
Nitrogen - Other Uses |
18,913 |
19,404 |
19,687 |
20,038 |
20,384 |
20,719 |
21,054 |
|
Nitrogen - Available for Fertilizers |
69,316 |
68,271 |
68,451 |
69,930 |
67,367 |
67,194 |
67,893 |
|
Nitrogen - Fertilizer Demand |
59,244 |
58,778 |
59,213 |
59,995 |
60,708 |
61,364 |
61,976 |
|
Nitrogen - Potential Balance |
10,072 |
9,493 |
9,238 |
9,935 |
6,659 |
5,830 |
5,917 |
Source: FAO
The China industrial nitrogen market dominates the Asia Pacific industrial nitrogen regional segment. China’s use of synthetic ammonia has hit an upward trajectory over the past years, primarily as a result of a staggering demand for nitrogen fertilizers like urea in the country’s thriving agriculture sector. This has propelled the expansion of domestic synthetic ammonia manufacturing. From the macro industrial policy perspective, the industrial nitrogen market fertilizers production from natural gas and oil as feedstocks, the copper washing for ammonia synthesis, and the fixed inter-layer gasification method to synthesize ammonia are classified as restricted. In some provinces, including Shandong, Jiangxi, Inner Mongolia, and Henan were issued restrictions on nitrogen fertilizer or synthetic ammonia production capacity. Amid the stringencies, green ammonia has become the new preference in China. In terms of exports, China was evaluated as the second-largest supplier of nitrogenous fertilizers, worth USD 3.33 billion in 2024.
India industrial nitrogen market is expanding rapidly and is estimated to boom as a prominent player by the end of 2035, owing to supportive government initiatives to boost in-house production capacity and adoption via subsidy programs. In February 2024, the government introduced a subsidy scheme policy for renewable ammonia (nitrogen) generation as part of the Strategic Interventions for Green Hydrogen Transition Program (SIGHT). A cumulative annual demand of 550,000 tons was set round of subsidies and is set to be executed between 2027 and 2030, as published by the Ammonia Energy Association. The subsidy amounts are USD 106 per ton during the initial year and USD 85 per ton over the second and third years.
South Asia Nitrogen Supply, Demand, & Balance 2016-2022 (Thousand Tons N)
|
Metric |
2016 |
2017 |
2018 |
2019 |
2020 |
2021 |
2022 |
|
Ammonia - Capacity |
17,493 |
18,102 |
18,102 |
19,311 |
19,311 |
19,908 |
21,102 |
|
Ammonia - Supply Capability |
15,625 |
15,823 |
16,173 |
17,173 |
17,292 |
17,770 |
18,666 |
|
Nitrogen - Other Uses |
1,751 |
1,762 |
1,776 |
1,790 |
1,805 |
1,820 |
1,835 |
|
Nitrogen - Available for Fertilizers |
13,874 |
14,061 |
14,397 |
15,383 |
15,487 |
15,950 |
16,831 |
|
Nitrogen - Fertilizer Demand |
21,497 |
22,082 |
22,350 |
22,866 |
23,348 |
23,821 |
24,258 |
|
Nitrogen - Potential Balance |
-7,623 |
-8,021 |
-7,953 |
-7,483 |
-7,861 |
-7,871 |
-7,427 |
Source: FAO
North America Market Insights
The North America industrial nitrogen market is anticipated to account for a noteworthy share owing to the strong positioning of the chemical vertical in the region, especially with the upsurge in agricultural chemicals in the U.S. According to the American Chemical Council, agricultural chemicals output rose by more than 1.2% in 2025, offsetting a slight slump in the earlier years. This recovery is likely to amount to a 11% growth in agricultural chemicals by 2027. Moreover, nitrogenous fertilizer producer pricing has remained relatively stable since June 2023 and is showing an upward course starting August 2025, wherein PPI reached 487.179 as compared to 376.106 (nits: Index Dec 1979=100) in June 2023.
The industrial nitrogen market in the U.S. is driven by the diversification of fuel choices for marine vessels. In 2021, the U.S. was the leading container exporter and can be attributed to increasing activities on the Transpacifc (which grew from 17.0 million 20-foot equivalent units in 2009 to 32.7 million 20-foot equivalent units in 2022) and Transatlantic (from 4.7 million 20-foot equivalent units in 2009 reached 8.9 million 20-foot equivalent units in 2022) routes, thus, propelling the U.S. maritime vessel demand and subsequent opportunities for alternative, green fuel sources such as liquid nitrogen and ammonia. Furthermore, the country was also among the largest exporters of nitrogen in 2024 and did USD 34.4 million worth of outbound trade, says the OEC.
Europe Market Insights
Europe industrial nitrogen market growth is factored predominantly by the robust agri-foods industry. Europe’s position is prevalent with its record-level agri-food exports of EUR 235.4 billion in 2024, marking a 3% growth since the 2022-2023 peak of over EUR 6.6 billion. The U.S. remains the main destination and primarily exports cereals, wine, and dairy products. The export value of cocoa, olives, and olive oil surged due to high prices. The agri-food imports spiked to EUR 171.8 billion in 2024, denoting a 8% than 2023 (EUR 12.4 billion), topping the 2022 record. This was primarily driven by a steep increase in the price of imports of cocoa, coffee, and fruits and nuts. Imports from Côte d’Ivoire, Nigeria, and Ukraine surged; on the other hand, they declined from Australia and Russia. The increase in imports resulted in a slump in trade, valuing EUR 5.8 billion (-8%) compared to the 2023 level.
Key Industrial Nitrogen Market Players:
- Yara International (Oslo, Norway)
- CF Industries (Deerfield, IL, U.S.)
- Nutrien (Saskatoon, Canada)
- OCI NV (Amsterdam, Netherlands)
- EuroChem (Zug, Switzerland)
- BASF (Ludwigshafen, Germany)
- Fertiglobe (Abu Dhabi, UAE)
- SABIC (Riyadh, Saudi Arabia)
- Ma'aden (Riyadh, Saudi Arabia)
- ICL Group (Israel Chemicals) (Tel Aviv, Israel)
- Sinofert Holdings (Beijing, China)
- China BlueChemical (Tianjin, China)
- Acron Group (Moscow, Russia)
- Koch Industries / Koch Fertilizers (Wichita, KS, U.S.)
- IFFCO (Indian Farmers Fertiliser Cooperative) (New Delhi, India)
- Coromandel International (Chennai, India)
- Chambal Fertilisers (Gurugram, India)
- Rashtriya Chemicals & Fertilizers (Mumbai, India)
- ICL Fertilizers (subsidiary of ICL Group) (Tel Aviv, Israel)
- Linde plc (Dublin, Ireland)
- Company Overview
- Business Strategy
- Key Product Offerings
- Financial Performance
- Key Performance Indicators
- Risk Analysis
- Recent Development
- Regional Presence
- SWOT Analysis
- CF Industries is among industrial nitrogen market, the largest producers of nitrogen products worldwide and has a particularly strong presence in North America. The company operates several large manufacturing facilities that produce ammonia and related nitrogen products for both domestic industrial nitrogen markets and export. The company has begun investing in lower-emission production technologies, including low-carbon ammonia.
- Yara International is considered one of the leading companies in the global industrial nitrogen market. The company operates an extensive network of production and distribution facilities across Europe, the Americas, Africa, and Asia. Yara manufactures ammonia, urea, and other nitrogen-based products that are widely used in agriculture and industrial processes.
- EuroChem Group is a major global industrial nitrogen market fertilizer producer with substantial nitrogen production capacity. The company operates integrated production facilities and has access to important raw materials required for nitrogen manufacturing. This integrated structure helps support consistent production and supply.
Here is a list of key players operating in the global industrial nitrogen market:
The worldwide industrial nitrogen market has the presence of a large number of established players, building strong tie-ups with businesses to gain a noteworthy share in nitrogen production and distribution. With the advent of sustainability adoption to reduce GHG emissions, green ammonia has gained impetus in terms of high industrial nitrogen market penetration. The industry players are continuing to evolve their strategies, aligning with changing end use demand and requirements, while largely benefitting from supportive government policies and subsidy plans.
Competitive Landscape of the Industrial Nitrogen Market:
Recent Developments
- In February 2026, ADNOC acquired Fertiglobe’s majority stake. ADNOC now holds 86.2% shares, while the remaining 13.8% is being traded on the Abu Dhabi Securities Exchange. This strategic move has allowed ADNOC to strengthen its position as a prominent seaborne urea and ammonia exporter and emerge as a global low-carbon ammonia pioneer.
- In January 2026, Trafigura, CF Industries, and TFG Marine entered into an agreement or MoU to propagate the use of low-carbon ammonia as a marine fuel and, in turn, support the ongoing efforts to reduce global shipping emissions. The partnership aims at focusing on the U.S., Northwest Europe, and the Gulf Coast initially.
- Report ID: 8462
- Published Date: Mar 24, 2026
- Report Format: PDF, PPT
- Explore a preview of key market trends and insights
- Review sample data tables and segment breakdowns
- Experience the quality of our visual data representations
- Evaluate our report structure and research methodology
- Get a glimpse of competitive landscape analysis
- Understand how regional forecasts are presented
- Assess the depth of company profiling and benchmarking
- Preview how actionable insights can support your strategy
Explore real data and analysis
Frequently Asked Questions (FAQ)
Industrial Nitrogen Market Report Scope
Free Sample includes current and historical market size, growth trends, regional charts & tables, company profiles, segment-wise forecasts, and more.
Connect with our Expert


Copyright @ 2026 Research Nester. All Rights Reserved.
