Hydraulic Turbine Market Outlook:
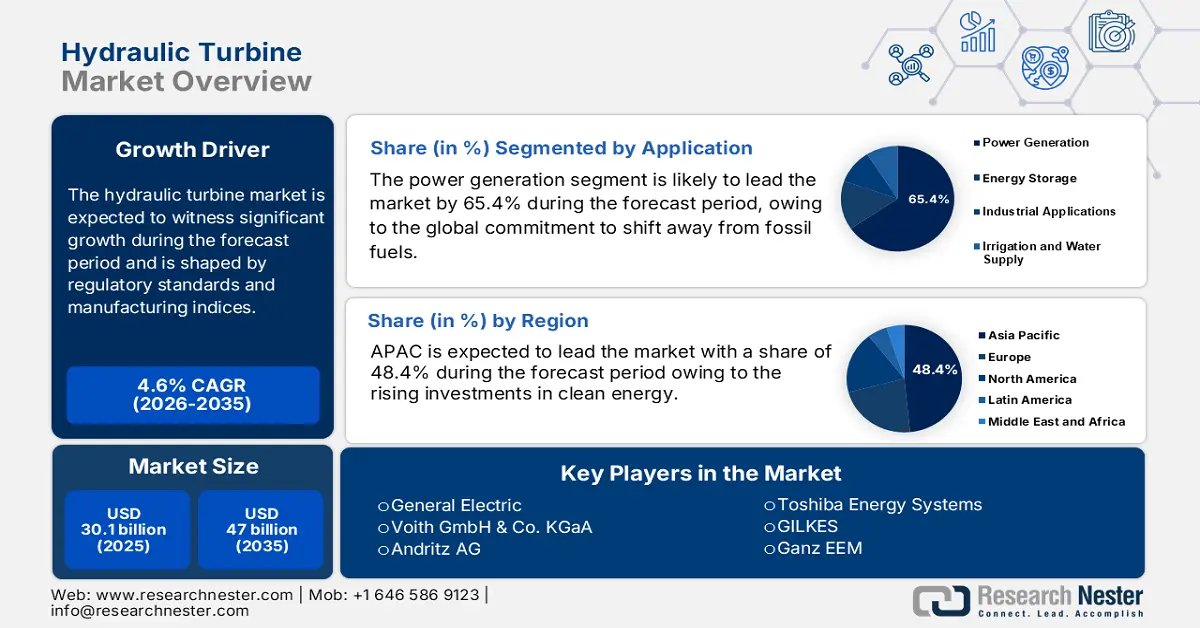
Hydraulic Turbine Market size was valued at USD 30.1 billion in 2025 and is projected to reach USD 47 billion by the end of 2035, rising at a CAGR of 4.6% during the forecast period, i.e., 2026-2035. In 2026, the industry size of hydraulic turbine is estimated at USD 31.4 billion.
The hydraulic turbine market is experiencing steady industrial demand, with pricing trends and performance benchmarks shaped by regulatory standards and manufacturing indices. According to the FRED data in August 2025, the Producer Price Index (PPI) for the production of turbine and turbine generator set units was 274.952, continuing a steady rise compared to previous years. This index, benchmarked to initial times, indicates a long-term escalation in production costs, which can be attributed to material inputs, labor, and compliance with evolving efficiency and safety standards.
From a technical operations view, guidance from the United Nations Industrial Development Organization (UNIDO) emphasizes the importance of standardized testing and commissioning protocols. These guidelines are pivotal for utilities and infrastructure developers looking to adopt international best practices with reduced lifecycle costs. The focus on cavitation and iso-cavitation curve analysis, specifically, highlights the necessity of precision engineering in turbine design and maintenance planning. As global energy portfolios diversify due to technical advancements, this guarantees that the hydraulic turbines continue to be a valid and effective part of the renewable generation assets.
Key Hydraulic Turbine Market Insights Summary:
Regional Insights:
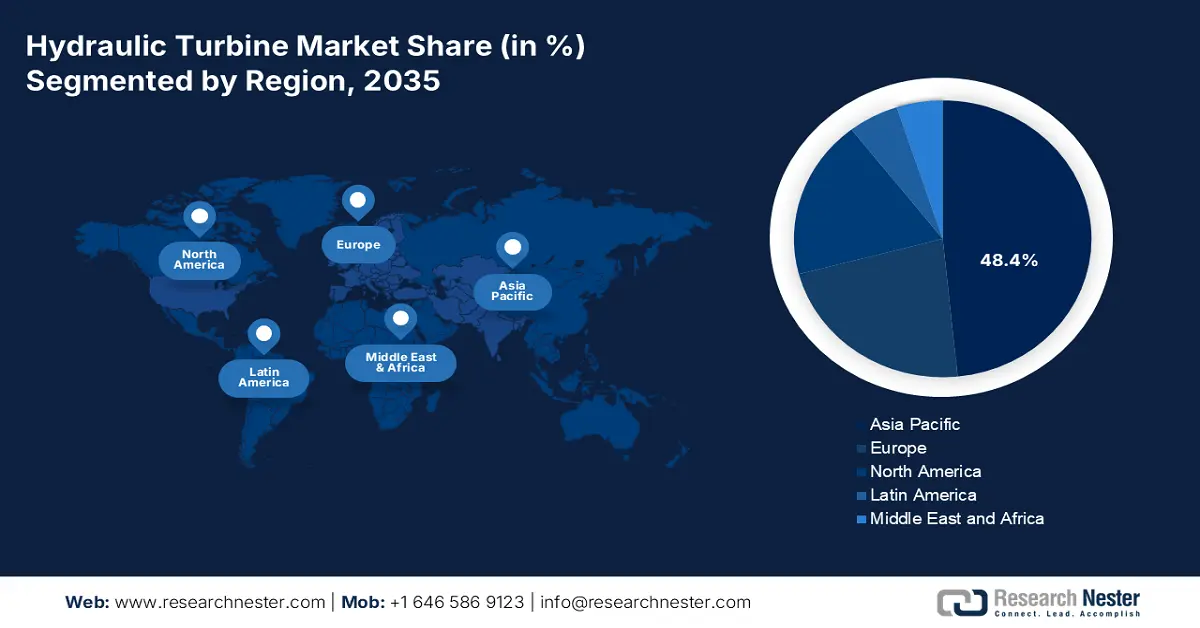
- The Asia Pacific region is anticipated to command a 48.4% share of the hydraulic turbine market by 2035, sustained by extensive clean-energy investments and rapid hydro project development across major economies such as China and India.
- Europe is expected to expand its presence in the market by 2035 through refurbishment initiatives and digital modernization of aging hydropower assets, impelled by stringent EU Green Deal and REPowerEU policy mandates.
Segment Insights:
- The power generation segment is projected to secure a 65.4% share of the hydraulic turbine market by 2035, propelled by the global transition away from fossil fuels and the essential role of large hydropower in delivering long-duration grid stability.
- Large hydropower installations are set to retain a significant share from 2026 to 2035, supported by their capacity to provide inertia and energy storage for grids increasingly dependent on variable renewables.
Key Growth Trends:
- Demand for Grid-Scale Energy Storage
- Government Financial Incentives and Direct Spending
Major Challenges:
- Technical complexity and shortage of skilled labor
- High capital expenditure and financing hurdles
Key Players: Voith GmbH & Co. KGaA (Germany), Andritz AG (Austria), Toshiba Energy Systems & Solutions Corporation (Japan), Dongfang Electric Corporation Limited (China), Harbin Electric Machinery Company Limited (China), China Three Gorges Corporation (China), VELJAN Hydrair Private Limited (India), GILKES (Gilbert Gilkes & Gordon Ltd) (UK), Kirloskar Brothers Limited (India), Litostroj Power d.o.o. (Slovenia), MFV Turbines (India), Ganz EEM (Hungary), Doosan Škoda Power (Czech Republic), WWS Wasserkraft GmbH (Germany), Cornell Pump Company (U.S.), Gugler Water Turbines GmbH (Austria), Siemens Energy (Germany), Hyosung Heavy Industries (South Korea), Maple Energy Pvt. Ltd. (India).
Global Hydraulic Turbine Market Forecast and Regional Outlook:
Market Size & Growth Projections:
- 2025 Market Size: USD 30.1 billion
- 2026 Market Size: USD 31.4 billion
- Projected Market Size: USD 47 billion by 2035
- Growth Forecasts: 4.6% CAGR (2026-2035)
Key Regional Dynamics:
- Largest Region: Asia Pacific (48.4% Share by 2035)
- Fastest Growing Region: Asia Pacific
- Dominating Countries: China, United States, India, Canada, Brazil
- Emerging Countries: Vietnam, Indonesia, Turkey, Colombia, Nepal
Last updated on : 29 October, 2025
Hydraulic Turbine Market - Growth Drivers and Challenges
Growth Drivers
- Demand for Grid-Scale Energy Storage: The growth of intermittent renewables necessitates large-scale, long-duration storage. As Pumped Storage Hydropower (PSH) is the major dominating solution, the demand for reversible pump-turbines is rising. The International Energy Agency (IEA) report in 2025 states that PSH accounts for more than 90% of the total energy storage capacity of the world. Besides, governments, including China's in its 14th Five-Year Plan, are explicitly funding new PSH projects, representing a major growth vector for turbine manufacturers.
- Government Financial Incentives and Direct Spending: Direct government funding is a critical driver fueling the hydraulic turbine market. Besides the U.S. Infrastructure Law, Canada's Smart Renewables and Electrification Pathways Program is also offering substantial financial support to the renewable energy sector, in particular, to the modernization of hydropower facilities. As a result of these initiatives, the developers' risks are reduced as their projects are funded, and the purchases of new turbine equipment make projects financially viable and accelerating the market demand.
- Modernization and refurbishment of aging fleet: A significant portion of the global hydropower fleet is over 40 years old, based on the IEA data in 2025. The drive to enhance the efficiency, power output, and environmental compatibility is creating a strong market for turbine replacements and upgrades. According to the European Commission's energy system integration strategy, upgrading the existing network is not only a very economical way to increase renewable capacity but also the primary reason behind the rising demand for advanced turbine technologies from suppliers such as Voith and Andritz.
Producer Price Index for Turbine and Turbine Generator Set Units Manufacturing
|
Year (December) |
Units |
|
2020 |
230.900 |
|
2021 |
237.669 |
|
2022 |
246.518 |
|
2023 |
261.567 |
|
2024 |
270.686 |
Source: FRED August 2025
Challenges
- Technical complexity and shortage of skilled labor: The design and installation of advanced hydraulic turbines entail the need for highly specialized engineering as well as skilled local labor, which might not be available. Consequently, there might be a need for an expensive team. The National Institute for Occupational Safety and Health of the U.S. CDC points out that the construction of hydroelectric power involves a variety of complex safety risks thus, a well-trained workforce is required. The shortage of such a workforce constitutes a barrier to rapid market entry and project execution.
- High capital expenditure and financing hurdles: The immense upfront cost of hydropower projects, including turbines, poses a significant barrier. As a result, governments and developers carry out very strict ROI analyses and end up considering large dams as financially non-viable. According to the World Bank, large hydropower is a capital-intensive sector that requires a huge investment; therefore, most investors are choosing cheaper and quicker renewables projects. This limits hydraulic turbine market opportunities for turbine manufacturers to only the largest, state-backed projects.
Hydraulic Turbine Market Size and Forecast:
| Report Attribute | Details |
|---|---|
|
Base Year |
2025 |
|
Forecast Year |
2026-2035 |
|
CAGR |
4.6% |
|
Base Year Market Size (2025) |
USD 30.1 billion |
|
Forecast Year Market Size (2035) |
USD 47 billion |
|
Regional Scope |
|
Hydraulic Turbine Market Segmentation:
Application Segment Analysis
Power generation is dominating the segment and is projected to hold the hydraulic turbine market share value of 65.4% by 2035. The segment is propelled by the global commitment to shift away from fossil fuels. As demonstrated by international legislation, hydropower is a fundamental component of national renewable energy portfolios and a significant component of climate mitigation plans. Further, investments from the new projects in regions such as Africa and Asia, and the modernization of aging plants in Europe and North America, to increase efficiency and capacity, solidifying its dominant share.
Capacity Segment Analysis
Large hydropower installations are at the forefront and are expected to maintain a significant share from 2026 to 2035. The segment is driven by the vital function of delivering grid stability, inertia, and energy storage for a long duration, in particular, when paired with variable renewables such as wind and solar. According to PIB data in June 2025, the total power capacity installed in India reached 476 GW as of June 2025, highlighting the increasing role of large hydropower in the supply of baseload power and grid stability.
Type Segment Analysis
The Francis turbine sub-segment is fueling the segment and is driven by its unparalleled versatility and high efficiency in a wide range of heads and flows. This makes them a default choice for most large-scale hydropower dams globally. As per the U.S. DOE data in December 2024, the Francis turbine is a modern hydropower turbine and is mostly used for medium- to high-head situations of 130 feet to 2,000 feet situations; they are also used in lower heads as well. Governments and developers prioritize this technology for its proven track record and ability to deliver massive amounts of clean, baseload power, which is critical for meeting climate goals.
Our in-depth analysis of the hydraulic turbine market includes the following segments:
|
Segment |
Subsegments |
|
Type |
|
|
Capacity |
|
|
Application |
|
|
Component |
|

Vishnu Nair
Head - Global Business DevelopmentCustomize this report to your requirements — connect with our consultant for personalized insights and options.
Hydraulic Turbine Market - Regional Analysis
APAC Market Insights
The Asia Pacific is the dominating region in the hydraulic turbine market, and is expected to hold a market share of 48.4% by 2035. This region is propelled by the extensive investments in clean energy to meet the rapidly increasing demand for electricity and the ambitious climate goals. The key driver is the development of hydro projects on a large scale, mainly in China and India, as they are essential for base load power and flood control. The rise in pumped storage hydropower projects to stabilize grids that are increasingly reliant on intermittent solar and wind power is the key trend driving the market growth.
China is leading the hydraulic turbine market in the Asia Pacific region during the forecast period 2026 to 2035. As per the Berkeley University of California report in July 2025, the country is driven by its 14th Five-Year Plan, targeting 62 GW of new pumped storage by 2025. Furthermore, Suneco Hydro, a prominent hydro turbine generator manufacturer in China, exports 86% of its products to Europe, North America, South Africa, Thailand, and more. This solidifies China's global market dominance, with a primary focus on large-scale power generation and grid stability to support the nation's immense renewable energy and decarbonization goals.
China’s Pumped Hydropower Storage Installed Capacity From 2015 to 2022
|
Year |
Installed Capacity (GW) |
|
2015 |
22.8 |
|
2016 |
26.7 |
|
2017 |
28.6 |
|
2018 |
30.0 |
|
2019 |
30.3 |
|
2020 |
31.5 |
|
2021 |
39.0 |
|
2022 |
45.7 |
Source: Berkeley University of California July 2025
The hydraulic turbine market in India is growing at a fast pace, mainly due to the highly publicized National Mission on Hydro Power and the substantial project allocations like the 2,880 MW Dibang Project. As per the PIB report in March 2024, India is expected to generate 11,000 million units of hydro power annually. The potential of the country is being released by the changes in the hydro tariffs and the promotion of foreign investments along with other government measures. The focus is mainly on both large-scale projects for baseload power and small-hydro systems to electrify remote regions, positioning India as the fastest-growing major market in the APAC region.
Europe Market Insights
The hydraulic turbine market in Europe is influenced by the refurbishment and modernization of its aging fleet. The digitization of hydropower plants is the most significant trend, where IoT and AI are integrated for predictive maintenance and grid balancing services to support intermittent renewables such as wind and solar. Strict EU Green Deal targets for renewable energy and the REPowerEU plan's focus on energy independence are the main policy drivers. Growth is concentrated in upgrading existing facilities for higher efficiency and flexibility, alongside developing new, small-scale hydropower and modern pumped-storage projects.
The UK hydraulic turbine market is largely focused on small hydropower and new pumped storage projects that aim to stabilize the national grid. As per the Net Zero Go data, which is managed by Energy Systems Catapult in 2025, the fund of £1 billion is announced to surge the commercialization of low-carbon technologies, systems, and business models in power, buildings, and industry. This, in turn, is the main enabler and accelerator of advanced hydropower and pumped storage projects development nationwide.
The hydraulic turbine market in Germany holds the highest revenue share by 2035 in the Europe market. The dominance is driven by the Energiewende policy that prioritizes the phase out of nuclear and fossil fuels, hence creating a demand for flexible, reliable, and clean power sources to stabilize the grid along with volatile wind and solar output. The federal Environment Ministry allocates significant funds via the Renewable Energies research program that supports the hydraulic market indirectly.
Hydro Power Generation in Europe from 2014 to 2024
|
Year |
Power Generated (TWh) |
|
2014 |
600 |
|
2015 |
599 |
|
2016 |
595 |
|
2017 |
600 |
|
2018 |
643 |
|
2019 |
653 |
|
2020 |
676 |
|
2021 |
659 |
|
2022 |
569 |
|
2023 |
637 |
|
2024 |
680 |
Source: International Hydropower Association 2022
North America Market Insights
The major factor behind the growth of the North America hydraulic turbine market is the modernization and refurbishment of the region's old hydropower fleet. The main trend is the use of digital controls and IoT sensors to enhance efficiency and grid stability, thus supporting variable renewables like wind and solar. The main drivers of the market include incentives by the government for carbon-free power and the need for reliable, long-duration storage. The U.S. leads with huge investment, while Canada is untapped with vast hydro potential.
The U.S. hydraulic turbine market is driven by the modernization and powering up of its existing fleet that represents a significant part of the nation’s non-federal hydropower capacity. The major trend is the deployment of enhanced pumped storage hydropower to improve the grid reliability and integrate variable renewable resources. As per the ICT news data in 2025, the U.S. has 450 hydroelectric stations accounting for more than 16 gigawatts. The country is now witnessing a major shift in the hydropower facility.
Canada’s market is characterized by massive investments in both large-scale projects for the export of clean electricity and small-scale systems for the electrification of remote communities. The key trend is the use of the country's vast hydro infrastructure to create hybrid systems that includes solar and wind to produce more resilient microgrids. For example, Norcan Hydraulic Turbine Inc. replaced a 1,295 mm (51 in.), 2,584 kW Francis runner in eastern Canada along with the essential components such as brushes, pins, wicket gates, guide bearing, and main shaft. This highlights the nation's commitment to modernizing its hydro infrastructure to generate power that is both reliable and sustainable.
Key Hydraulic Turbine Market Players:
- General Electric (U.S.)
- Company Overview
- Business Strategy
- Key Product Offerings
- Financial Performance
- Key Performance Indicators
- Risk Analysis
- Recent Development
- Regional Presence
- SWOT Analysis
- Voith GmbH & Co. KGaA (Germany)
- Andritz AG (Austria)
- Toshiba Energy Systems & Solutions Corporation (Japan)
- Dongfang Electric Corporation Limited (China)
- Harbin Electric Machinery Company Limited (China)
- China Three Gorges Corporation (China)
- VELJAN Hydrair Private Limited (India)
- GILKES (Gilbert Gilkes & Gordon Ltd) (UK)
- Kirloskar Brothers Limited (India)
- Litostroj Power d.o.o. (Slovenia)
- MFV Turbines (India)
- Ganz EEM (Hungary)
- Doosan Škoda Power (Czech Republic)
- WWS Wasserkraft GmbH (Germany)
- Cornell Pump Company (U.S.)
- Gugler Water Turbines GmbH (Austria)
- Siemens Energy (Germany)
- Hyosung Heavy Industries (South Korea)
- Maple Energy Pvt. Ltd. (India)
- GE is one of the major contributors to the hydraulic turbine market and is leading largely due to its broad range of Kaplan, Francis, and Pelton turbines. The firm is blending its power generation expertise with advanced digital solutions. This focus on digital hydro enables predictive analytics and real-time performance optimization, aiding plant operators to maximize efficiency and extend asset life.
- Voith is a premier technology partner in the hydraulic turbine market and provides an end-to-end solution, from individual components to complete turnkey plants. Its strategic initiative is highly focused on innovation in sustainability and efficiency, with a specific emphasis on advancing pumped storage technology for grid stability. In 2024, the R&D in Voith was more than € 200 million, to explore new opportunities and expand business.
- Andritz AG is a giant player in the hydraulic turbine market and offers a full range of turbines and generators via its ANDRITZ Hydro division. The company’s key strategy is to excel in engineering and execute large-scale complex projects and lead the market in the modernization and refurbishment of aging hydropower plants. The company has generated a revenue of EUR 8,313.7 million in 2024. This ensures long-term customer partnerships.
- Toshiba is a major player in the hydraulic turbine market, as it is specializing in high-quality, large-capacity Francis and pump turbines. Its outstanding technological contributions to large-scale pumped storage projects, which are essential for grid balancing, are the basis of the company's strategy. By focusing on reliability, Toshiba has secured a strong presence in key markets across the U.S. and APAC, positioning itself as a trusted partner for the demanding hydropower applications.
- Dongfang Electric Corporation Limited in China and is expanding in the global hydraulic turbine market. It uses its immense domestic manufacturing scale and cost effectiveness to compete for large international contracts. The ultimate strategy of the company involves delivering a full spectrum of hydroelectric equipment, from turbines to generators.
Here is a list of key players operating in the global market:
These countries are dominating the hydraulic turbine market. The market is driven by the major companies from Europe, China, and North America. The competitive market is defined by innovations in technology, further with top players witnessing strategic initiatives such as mergers and acquisitions to expand their footprint and product portfolios. For instance, in March 2024, Mesa Associates, Inc. acquired NuSTREEM to strengthen and expand its hydropower business. These initiative drives market growth and expansion.
Corporate Landscape of the Hydraulic Turbine Market:
Recent Developments
- In September 2025, Voith completes its second turbine upgrade at New Zealand’s Roxburgh hydropower station. The second unit is commissioned to enhance the timeline and address all performance guarantees.
- In June 2025, GE Vernova Inc. announced that it has commissioned the first of four 250-megawatt variable speed units at THDC India Limited’s Tehri Pumped Storage Hydropower Plant, which is a part of the Tehri Hydropower Complex.
- In October 2024, Wikov has officially announced the acquisition of Litostroj, which is the world's leading manufacturer of turbines for hydroelectric power plants.
- Report ID: 8196
- Published Date: Oct 29, 2025
- Report Format: PDF, PPT
- Explore a preview of key market trends and insights
- Review sample data tables and segment breakdowns
- Experience the quality of our visual data representations
- Evaluate our report structure and research methodology
- Get a glimpse of competitive landscape analysis
- Understand how regional forecasts are presented
- Assess the depth of company profiling and benchmarking
- Preview how actionable insights can support your strategy
Explore real data and analysis
Frequently Asked Questions (FAQ)
Hydraulic Turbine Market Report Scope
Free Sample includes current and historical market size, growth trends, regional charts & tables, company profiles, segment-wise forecasts, and more.
Connect with our Expert


Copyright @ 2026 Research Nester. All Rights Reserved.
