Green Polymer Additive Market Outlook:
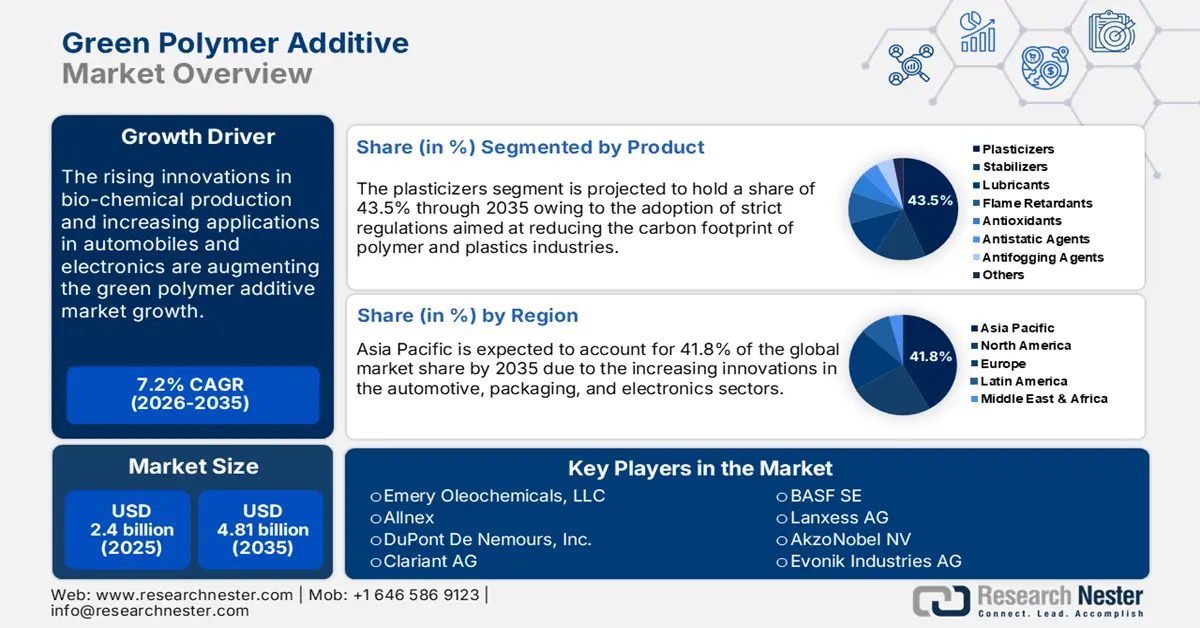
Green Polymer Additive Market size was valued at USD 2.4 billion in 2025 and is expected to reach USD 4.81 billion by 2035, registering around 7.2% CAGR during the forecast period i.e., between 2026-2035. In the year 2026, the industry size of green polymer additive is evaluated at USD 2.56 billion.
The regulatory push towards the adoption of bio-based alternatives is creating an opportunistic green polymer additive market. European Union’s circular economy action plan and the Paris Agreement are the top drivers contributing to the increasing consumption of green polymer additives. Furthermore, the increasing concerns about the growing plastic waste globally are driving the attention of manufacturers and customers to invest in bio-based or greener alternatives. For instance, in June 2022, the Organization for Economic Cooperation and Development (OECD) estimated that plastic waste worldwide is expected to triple by 2060. The improper waste management and recyclability moves are creating environmental concerns and plastic pollution growth. This is further directly promoting the demand for organic chemicals.
|
Natural Polymer |
|||
|
Country |
Export Value in USD Million |
Country |
Import Value in USD Million |
|
China |
1230 |
U.S. |
518 |
|
Sweden |
500 |
Germany |
218 |
|
U.S. |
347 |
Japan |
207 |
|
France |
305 |
Netherlands |
203 |
|
Italy |
195 |
France |
154 |
Source: OEC
The Observatory of Economic Complexity (OEC) analysis reveals that natural polymers are one of the top-traded products across the world. In 2022, global trade of natural polymer totaled USD 3.91 billion, expanding at a CAGR of 23.6%. The product complexity index of natural polymer stood at 234th. The highest export value growth was concentrated in China amounting to USD 486.0 million and the top import value growth was led by the Netherlands (USD 86.6 million). The market concentration calculated by Shannon Entropy was 3.81, representing the export dominance of 14 countries.
Key Green Polymer Additive Market Insights Summary:
Regional Highlights:
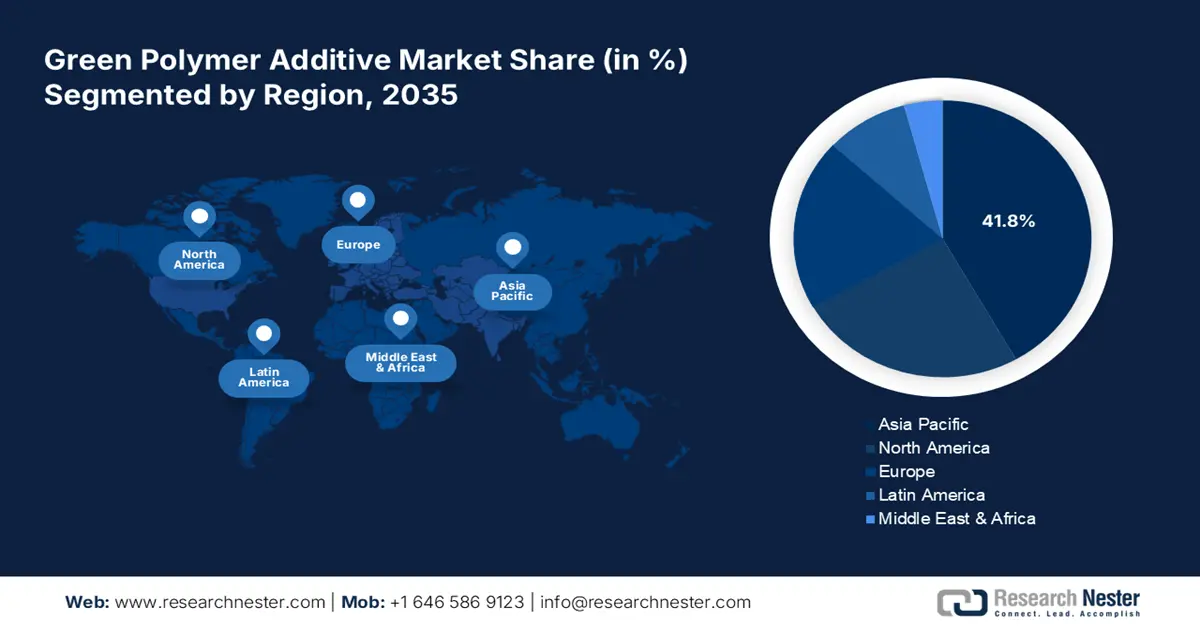
- By 2035, the Asia Pacific region is anticipated to secure nearly 41.8% share of the green polymer additive market, supported by rising manufacturing activities and sustainability-led industrial advancements.
- The North America region is expected to witness the fastest CAGR through 2026–2035, fueled by stringent GHG norms and accelerating adoption of green chemistry innovations.
Segment Insights:
- The plasticizers segment is projected to command over 43.5% share by 2035 in the green polymer additive market, propelled by the transition toward bio-based alternatives in sustainable manufacturing practices.
- By 2035, the packaging segment is estimated to hold around 44.2% share, supported by surging adoption of biodegradable and recyclable materials across major end-use sectors.
Key Growth Trends:
- Lucrative opportunities lie in the automotive and electronics sectors
- Green chemicals are gaining traction
Major Challenges:
- Price volatility challenges revenue growth and market entry
- Traditional polymer additives are a big rival
Key Players: Emery Oleochemicals LLC, Allnex, DuPont De Nemours Inc., Clariant AG, Dow Inc., BASF SE, Lanxess AG, AkzoNobel NV, Evonik Industries AG, PolyOne Corporation, Solvay, GC Innovation America, Arkema Inc.
Global Green Polymer Additive Market Forecast and Regional Outlook:
Market Size & Growth Projections:
- 2025 Market Size: USD 2.4 billion
- 2026 Market Size: USD 2.56 billion
- Projected Market Size: USD 4.81 billion by 2035
- Growth Forecasts: 7.2%
Key Regional Dynamics:
- Largest Region: Asia Pacific (41.8% Share by 2035)
- Fastest Growing Region: North America
- Dominating Countries: United States, China, Germany, Japan, South Korea
- Emerging Countries: India, Brazil, Indonesia, Mexico, Vietnam
Last updated on : 2 December, 2025
Green Polymer Additive Market - Growth Drivers and Challenges
Growth Drivers
- Lucrative opportunities lie in the automotive and electronics sectors: Automotive and electronics are opportunistic marketplaces for green polymer additive manufacturers. These sectors are increasingly investing in superior, specialized, and bio-based materials to attract an eco-friendly consumer base and grab incentivized schemes of the governments. Green polymer additives are enhancing the performance and sustainability of components used in electric vehicles, interiors, and electronics, wherein reduced environmental impact is the center of focus. Boasting EV sales and increasing adoption of green electronics are anticipated to push the consumption of bio-based polymer additives in the coming years. The International Council of Clean Transportation (ICCT) revealed that global EV sales surpassed 7 million units in Q1’FY24 out of which 17% were light-duty vehicles.
- Green chemicals are gaining traction: The green chemistry trend is influencing the chemical sector at large and polymer additives are no exception. The move towards sustainable manufacturing practices is pushing the adoption of green polymer additives in various industries. The replacement of fossil fuel-derived chemicals with renewables or bio-based alternatives is substantially uplifting the green polymer additive trade activities across the world. The leaders from the U.S. Environmental Protection Agency (EPA) and the American Chemical Society are working together to uplift the importance and adoption of green chemistry principles.
Challenges
- Price volatility challenges revenue growth and market entry: Green polymer additive manufacturing is a complex process and involves the integration of advanced technologies. This uplifts the cost of bio-based additives derived from renewable resources. Small-scale companies in price-sensitive green polymer additive markets find it difficult to compete with bigger players, leading to limited sales of their greener additive despite environmental benefits. Thus, price volatility associated with green polymer additive polymer production is a major challenge for both start-ups and small companies.
- Traditional polymer additives are a big rival: Even though the awareness of environmental concerns and carbon emissions is increasing, some end users are resisting investing in green polymer additives. The prime reasons are high costs and a lack of knowledge regarding the results of green polymer additives. Some companies are more inclined towards traditional polymer additive applications owing to their similar performance and cost-effectiveness. To overcome this issue, manufacturers need to invest in awareness programs and better digital marketing strategies.
Green Polymer Additive Market Size and Forecast:
| Report Attribute | Details |
|---|---|
|
Base Year |
2025 |
|
Forecast Year |
2026-2035 |
|
CAGR |
7.2% |
|
Base Year Market Size (2025) |
USD 2.4 billion |
|
Forecast Year Market Size (2035) |
USD 4.81 billion |
|
Regional Scope |
|
Green Polymer Additive Market Segmentation:
Product Segment Analysis
Plasticizers segment is likely to dominate over 43.5% green polymer additive market share by 2035. The growing emphasis on reducing carbon footprint in polymer and plastics industries is promoting the use of green polymer additives in plasticizers. Traditional plasticizers are developed using harmful chemical substances, whereas those made from bio-based alternatives are more environmentally friendly and drive the attention of industries focused on following sustainable manufacturing practices. The majority of manufacturers are investing heavily to introduce innovative and eco-friendly bio plasticizers, which directly influences the demand for green polymer additives.
End use Industry Segment Analysis
By 2035, packaging segment is projected to account for around 44.2% green polymer additive market share. The packaging industry is one of the major consumers of polymer additive solutions and the sustainability trend in this sector is boosting the use of greener alternatives. The strict regulations towards the use of biodegradable and recyclable materials are pushing the demand for green polymer additives in the packaging field. Furthermore, the increasing demand for eco-friendly packaging solutions in the food, cosmetics, and e-commerce sectors is generating lucrative opportunities for bio-based or green polymer additives. For instance, in January 2025, the Sustainable Packaging Coalition in its January Packaging Policy Roundup revealed that a new EPR for packaging and paper products bill was introduced in Washington wherein the first hearing was concluded on January 21, 2025. Illinois also introduced multiple packaging bills at the start of 2025 focusing on the plastic ban. The dominance of stringent regulations on the mitigation of plastic use in packaging is anticipated to propel the sales of green polymer additives in the coming years.
Our in-depth analysis of the global green polymer additive market includes the following segments:
|
Product |
|
|
End use Industry |
|

Vishnu Nair
Head - Global Business DevelopmentCustomize this report to your requirements — connect with our consultant for personalized insights and options.
Green Polymer Additive Market - Regional Analysis
Asia Pacific Market Insights
Asia Pacific green polymer additive market is projected to dominate revenue share of around 41.8% by the end of 2035. The rapidly expanding innovations in the automotive, packaging, and electronics sectors are opening profitable doors for green polymer additive producers. The increasing manufacturing activities coupled with sustainable trends are propelling the sales of green polymer additives in the region. China and India with high industrial and urban activities are set to double the revenues of green polymer additive companies in the coming years. South Korea and Japan, champions in innovations are expected to introduce innovative polymer additives during the study period.
India with its evolving EV market is pushing the adoption of bi0-based and specialized chemicals and green polymer additives are also one of them. The India Brand Equity Foundation (IBEF) study reveals that the EV battery market is set to reach a valuation of USD 27.7 billion by 2028. The same source also estimates that the country is in the race to become the biggest EV industry by 2030. Supportive government policies on sustainable vehicle adoption and strict regulations on carbon emissions are not only driving EV sales but also green polymer additive consumption. Furthermore, the Electric Mobility Promotion Scheme with a USD 60.18 million budget is promoting green mobility and other bio-based component and solvent sales in the country.
China’s dominance in the global manufacturing sector has the potential to drive chemical and petrochemical trade activities. The country’s commitment to the net-zero emission goal is uplifting biochemical production and supply. The OEC report states that China is the leading exporter of organic chemicals. The total export trade of organic chemicals was calculated at USD 110.0 billion in 2022. The U.S. (USD 13.0 billion), India (USD 12.9 billion), Brazil (USD 6.98 billion), South Korea (USD 6.11 billion), and Japan (USD 4.77 billion) were the top importers of organic chemicals from China.
North America Market Insights
The North America green polymer additive market is poised to register the fastest CAGR during the assessed period. The top driving factors augmenting the trade of green polymer additives are strict regulations on greenhouse gas (GHG) emissions, high importance in sustainable manufacturing practices, and lead in bio-based chemical and solvent production and innovation. The rise in electric vehicle adoption and dominant plastic ban rules and regulations are further contributing to the overall green polymer additive market growth in North America. The green chemistry trend is also boasting the sales of green polymer additives in the U.S. and Canada.
In the U.S., the increasing adoption of biochemicals in the construction field is set to increase the consumption of green polymer additives in the years ahead. The green building move is very popular in the country. The adoption of sustainable components, chemicals, and other solutions in construction activities is estimated to propel the revenue growth of green polymer additive market players in the years ahead. For instance, in November 2024, the U.S. Green Building Council (USGBC) stated that LEED-certified projects are aimed at mitigating 120.0 million metric tons of CO2 emission across the world. The Research Nester’s study estimates that in 2022, nearly 13.5% of GHG emissions were contributed by the residential and commercial sectors in the U.S. To mitigate this issue, the government is more focused on green building projects, wherein the Leadership in Energy and Environmental Design (LEED) and Energy Star have emerged as the popular certification systems for green structures/buildings.
Canada’s increasing EV trade is highlighting the booming trade opportunities for biochemicals including green polymer additives. For instance, the report by Statistics Canada highlighted that the country witnessed increasing adoption of EVs during Q4 2023 and Q3 2024. The rapid innovations in EV manufacturing and rising environmental importance among individuals are set to propel the adoption of electric vehicles and subsequently drive the sales of biochemicals including green polymer additives in the coming years.
|
New Zero-emission Vehicle Registrations, quarterly |
||||
|
Geography |
Q4 2023 |
Q1 2024 |
Q2 2024 |
Q3 2024 |
|
Canada |
52,685 |
48,411 |
65,733 |
75,636 |
Green Polymer Additive Market Players:
- Emery Oleochemicals, LLC
- Company Overview
- Business Strategy
- Key Product Offerings
- Financial Performance
- Key Performance Indicators
- Risk Analysis
- Recent Development
- Regional Presence
- SWOT Analysis
- Allnex
- DuPont De Nemours, Inc.
- Clariant AG
- Dow, Inc.
- BASF SE
- Lanxess AG
- AkzoNobel NV
- Evonik Industries AG
- PolyOne Corporation
- Solvay
- GC Innovation America
- Arkema Inc.
The green polymer additive market is highly opportunistic for companies eager to invest in the production of biochemicals or those produced using renewable feedstocks. The increasing implementation of strict regulations on carbon emissions is driving opportunities for green polymer additive manufacturers. Leading companies in the green polymer additive market are employing several organic and inorganic strategies such as technological innovations, new product launches, collaborations & partnerships, mergers & acquisitions, digital marketing, and global expansions to earn high profits and stand out in the crowd. The majority of companies are generating high revenues and YoY growth from organic sale moves.
Some of the key players include:
Recent Developments
- In January 2025, Allnex a global producer of additives and industrial coating resins declared its participation in the Tire Technology Expo in Hannover, in March 2025. Active involvement in events aids companies in expanding their market reach and attracting a new consumer base.
- In November 2024, Emery Oleochemicals, LLC’s Green Polymer Additives (GPA) business unit along with FUSELAB showcased advanced 3D printing solutions at Formnext 2024. The companies stated that Formnext is an ideal stage to reveal their cutting-edge binding and printing solutions.
- Report ID: 7082
- Published Date: Dec 02, 2025
- Report Format: PDF, PPT
- Explore a preview of key market trends and insights
- Review sample data tables and segment breakdowns
- Experience the quality of our visual data representations
- Evaluate our report structure and research methodology
- Get a glimpse of competitive landscape analysis
- Understand how regional forecasts are presented
- Assess the depth of company profiling and benchmarking
- Preview how actionable insights can support your strategy
Explore real data and analysis
Frequently Asked Questions (FAQ)
Green Polymer Additive Market Report Scope
Free Sample includes current and historical market size, growth trends, regional charts & tables, company profiles, segment-wise forecasts, and more.
Connect with our Expert


Copyright @ 2026 Research Nester. All Rights Reserved.
