Fracking Water Treatment Market Outlook:
Fracking Water Treatment Market size was estimated at USD 491.4 million in 2025 and is expected to surpass USD 839.6 million by the end of 2035, rising at a CAGR of 5.5% during the forecast period, i.e., 2026-2035. In 2026, the industry size of fracking water treatment is evaluated at USD 518.4 million.
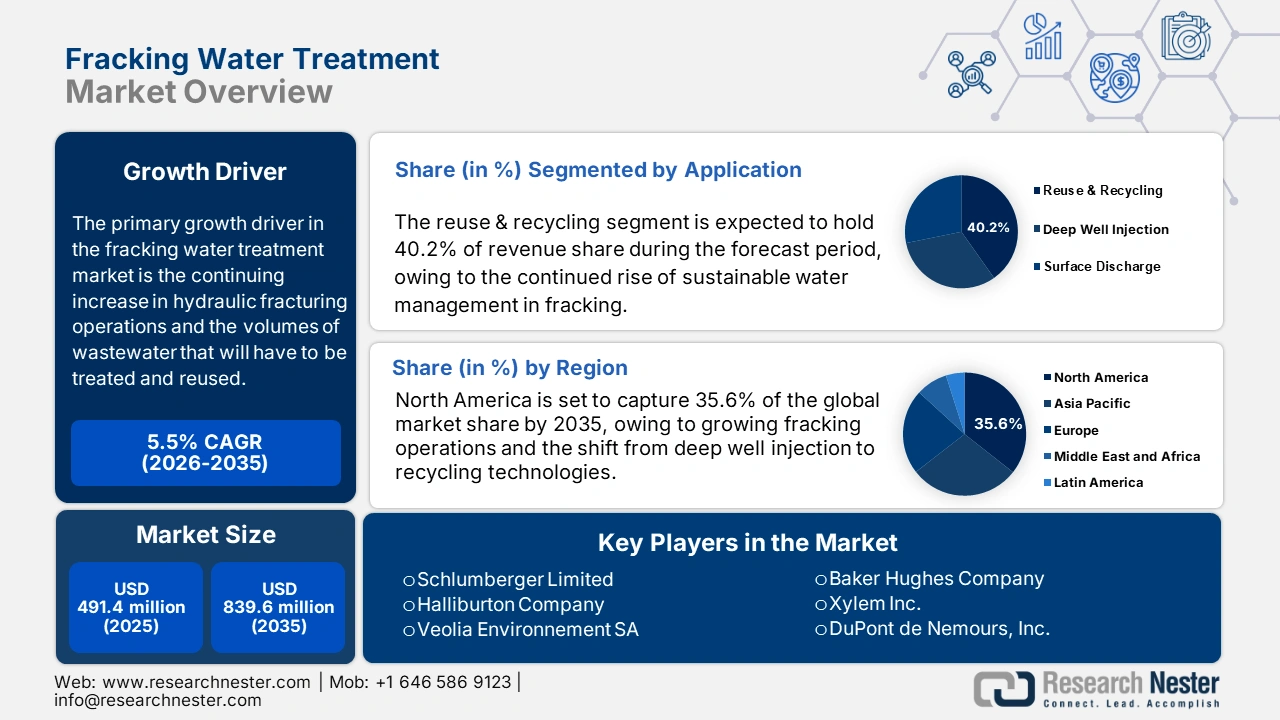
The main factor driving growth in the fracking water treatment sector is the ongoing rise in hydraulic fracturing activities, especially in areas such as the U.S. Over the last decade, tens of thousands of new wells have been drilled each year, leading to a significant increase in the volume of produced and flowback water. This surge has created an urgent demand for effective treatment solutions. Regulatory pressures and environmental issues have compelled operators to pursue sustainable approaches for handling this wastewater. The treatment and reuse of fracking water not only help in adhering to regulations but also reduce environmental hazards, including groundwater contamination and challenges associated with surface disposal.
In addition, financial considerations are motivating numerous operators to implement water treatment and recycling methods. The disposal of wastewater, which frequently involves deep well injection, represents one of the costliest aspects of fracking operations. By reusing treated water, these costs can be substantially reduced. XRI Holdings has introduced their new Evolution Pipeline System in the Midland Basin, which, upon completion, will extend over 230 miles of pipeline and will have the capacity to recycle and manage more than 500,000 barrels per day of produced water from producers in designated counties.
Key Fracking Water Treatment Market Insights Summary:
Regional Insights
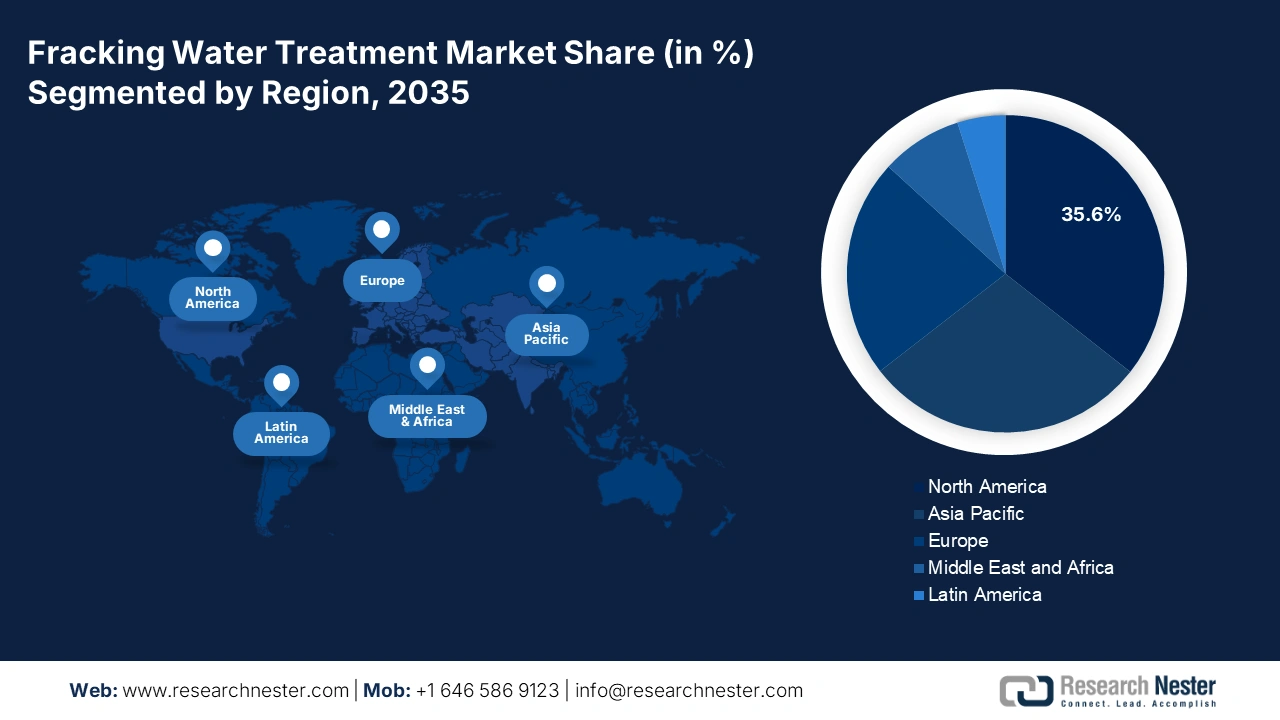
- By 2035, North America is projected to hold 35.6% of the market share, impelled by tougher environmental constraints, growing fracking operations, and the shift from deep well injection to recycling technologies.
- Asia Pacific is expected to capture 28.9% share by 2035, owing to the proliferation of shale exploration and stricter wastewater reuse policies.
Segment Insights
- The reuse & recycling segment is projected to account for 40.2% share by 2035, driven by the continued rise of sustainable water management in fracking.
- The membrane filtration segment is expected to witness the most significant growth by 2035, owing to its efficiency in removing contaminants from fracking wastewater.
Key Growth Trends:
- Rising hydraulic fracturing activity
- Water scarcity concerns
Major Challenges:
- Complex wastewater composition
- Infrastructure and cost constraints
Key Players: Schlumberger Limited, Halliburton Company, Veolia Environnement SA, Baker Hughes Company, Xylem Inc., DuPont de Nemours, Inc., Ovivo Inc., Siemens Water Technologies, Aquatech International LLC, and IDE Technologies Ltd.
Global Fracking Water Treatment Market Forecast and Regional Outlook:
Market Size & Growth Projections:
- 2025 Market Size: USD 491.4 million
- 2026 Market Size: USD 518.4 million
- Projected Market Size: USD 839.6 million by 2035
- Growth Forecasts: 5.5% CAGR (2026-2035)
Key Regional Dynamics:
- Largest Region: North America (35.6% Share by 2035)
- Fastest Growing Region: Asia Pacific (7.7% CAGR 2026–2035)
- Dominating Countries: U.S., Germany, Japan, UK, France
- Emerging Countries: China, India, South Korea, Malaysia, Canada
Last updated on : 6 October, 2025
Fracking Water Treatment Market - Growth Drivers and Challenges
Growth Drivers
- Rising hydraulic fracturing activity: The worldwide proliferation of hydraulic fracturing has markedly heightened the need for effective water treatment solutions, spurred by increasing volumes of wastewater and more stringent environmental regulations. Organizations such as Veolia Water Technologies offer sophisticated treatment systems that facilitate the reuse of produced water, assisting operators in minimizing costs and mitigating environmental impact. Veolia promotes sustainable oil and gas operations by processing 200,000 m³/day of production water at QGC in Australia, achieving a 97% reuse rate. At the Shell-Pearl GTL project, its zero liquid discharge system manages 45,000 m³/day of process water.
- Water scarcity concerns: The escalating drought conditions in critical shale markets are amplifying the demand for fracking water treatment solutions. Each hydraulic fracturing well consumes between 2.1 to 10.1 million gallons of water, placing considerable pressure on local water supplies. This situation has compelled operators to implement recycling and reuse strategies. WaterBridge Resources is proactively tackling the challenges associated with water scarcity in the Permian Basin by overseeing a vast produced water infrastructure. The company manages over 2,400 miles of pipeline and processes more than 2.4 million barrels of water daily across its facilities. This infrastructure underpins the recycling and reuse of produced water, significantly lessening dependence on freshwater sources in drought-stricken areas.
- Regulatory pressure: A significant factor driving growth in the fracking water treatment sector is the rising regulatory pressure to manage and recycle wastewater in a responsible manner. More stringent environmental regulations compel operators to implement advanced treatment technologies to reduce disposal and environmental impact. Evoqua's dedication to sustainability is reflected in its objective to recycle and reuse more water than it withdraws by 2035, with the aim of alleviating water risks linked to climate change. Furthermore, the company's anaerobic wastewater treatment systems generate around 540,000 cubic meters of biogas daily, which aids in renewable energy production and further enhances sustainable operations.
Challenges
- Complex wastewater composition: Fracking wastewater is characterized by elevated concentrations of salts, heavy metals, radioactive substances, and various chemical additives, which complicate the treatment process. The inconsistency in water quality among different wells necessitates the use of flexible and sophisticated technologies, thereby increasing both operational complexity and costs. Additionally, the management of treatment by-products such as sludge and brine present environmental and disposal challenges, which adversely affect the overall efficiency of the treatment process.
- Infrastructure and cost constraints: The limited availability of water treatment infrastructure in remote shale regions results in a dependence on expensive trucking and inefficient transportation methods. The construction of pipelines and treatment facilities requires substantial capital investment and ongoing operational costs. Moreover, the variability in fracking activity and the presence of regulatory obstacles further hinder the development of infrastructure, rendering sustainable and cost-effective water management a significant challenge for numerous operators.
Fracking Water Treatment Market Size and Forecast:
| Report Attribute | Details |
|---|---|
|
Base Year |
2025 |
|
Forecast Year |
2026-2035 |
|
CAGR |
5.5% |
|
Base Year Market Size (2025) |
USD 491.4 million |
|
Forecast Year Market Size (2035) |
USD 839.6 million |
|
Regional Scope |
|
Fracking Water Treatment Market Segmentation:
Application Segment Analysis
Treatment Type Segment Analysis
Service Segment Analysis
The treatment & disposal segment is projected to capture a significant portion of the global fracking water treatment market by the year 2035, propelled by the necessity for the safe management and disposal of contaminated wastewater. As regulations become more stringent, operators are progressively depending on sophisticated treatment and disposal techniques to reduce environmental hazards. Schlumberger’s xWATER service processes 7.4 million gallons of Bakken produced water utilizing entirely recycled water, thereby eliminating the need for freshwater and disposal, while also conserving approximately 650 tanker truck trips for each well.
Our in-depth analysis of the fracking water treatment market includes the following segments:
|
Segment |
Subsegment |
|
Treatment Type |
|
|
Service |
|
|
Application |
|

Vishnu Nair
Head - Global Business DevelopmentCustomize this report to your requirements — connect with our consultant for personalized insights and options.
Fracking Water Treatment Market - Regional Analysis
North America Market Insights
By 2035, the North America market is expected to hold 35.6% of the market share, and it is expected to grow from roughly USD 24.62 billion in 2025 to USD 40.51 billion in 2035 with a compound annual growth rate (CAGR) of around 5.8% during the period. The expansion is driven by tougher constraints on the environment, growing fracking operations, and the shift from deep well injection to recycling technologies. The main segments of the fracking water treatment market are ion exchange, reverse osmosis, and microbial treatment processes. It is expected that North America will be the regional leader in the fracking water treatment market share and dominate global market revenues by region for the years ahead, into 2035.
The U.S. is anticipated to dominate the North American fracking water treatment market by 2035. This anticipated growth is primarily due to significant shale gas production in areas such as the Permian Basin and Marcellus Shale, coupled with rigorous regulatory frameworks and a high rate of adoption of advanced treatment technologies. Hydrozonix is a leader in advanced oxidation and mobile water treatment systems tailored for the oilfield, providing chemical-free solutions that utilize ozone and cavitation technologies. The company has successfully deployed its systems at more than 30 oilfield locations, treating millions of barrels of produced water each year.
Canada is expected to rank as the second-largest market for fracking water treatment in North America by 2035. The growth of this market is fueled by heightened shale gas exploration in areas like British Columbia and Alberta, along with strict environmental regulations that encourage water recycling and reuse. Enbridge Inc. plays a crucial role in delivering solutions for water treatment and recycling, thereby supporting Canada's fracking water treatment efforts. The company has established a zero-liquid discharge (ZLD) system at the Indian Oil Corporation's Panipat Refinery, which features a reverse osmosis-based demineralization plant and a condensate polishing unit. This innovative system effectively recycles and reuses water, leading to a significant reduction in freshwater consumption and a decrease in environmental impact.
Asia Pacific Market Insights
Asia Pacific market is expected to hold 28.9% of the market share due to the proliferation of shale exploration and more stringent policies for wastewater reuse. The market is expected to reach USD 1.39 billion by 2035, growing at 7.7% CAGR from 2026 to 2035. China contributes the most to demand in the region, followed by Australia and India. Authorities are implementing stricter water discharge regulations for wastewater as well as investing in produced water treatment infrastructure, such as desalination plants. Increasingly, R&D directed by companies on cost-effective membrane and electrocoagulation technology further bolsters the market for fracking water treatment installations to grow across the region.
China is anticipated to dominate the APAC fracking water treatment market by 2035, with a projected market value surpassing USD 613 million. This expansion is primarily due to vigorous shale gas development in areas such as Sichuan and Inner Mongolia, coupled with wastewater recycling initiatives aimed at enhancing reused water utilization. Companies like. Sinopec has been proactively enhancing water treatment technologies to bolster its hydraulic fracturing activities. A prominent instance of this is its partnership with OriginClear to test the Electro Water Separation™ (EWS) technology at the Fuling shale gas site in Chongqing. This innovative technology efficiently eliminates total petroleum hydrocarbons and suspended solids from wastewater, facilitating its reuse in hydraulic fracturing operations, thus decreasing freshwater usage and mitigating environmental repercussions.
India is anticipated to emerge as the fastest-growing market within the APAC, with a projected market value of USD 106 million by 2035. This growth is fueled by the Indian government's ambitious plan for a gas-based economy and exploration activities in the Cambay and Krishna-Godavari basins. Firms such as Ion Exchange (India) Ltd. has been significantly involved in providing solutions for water pre-treatment, treatment, recycling, and zero liquid discharge, aiding India's fracking water initiatives. The company has established a zero-liquid discharge (ZLD) system at the Indian Oil Corporation's Panipat Refinery, which features a reverse osmosis-based demineralization plant and a condensate polishing unit. This system recycles and reuses water, leading to a substantial reduction in freshwater consumption and a decrease in environmental impact.
Europe Market Insights
Europe’s fracking water treatment market is anticipated to witness consistent growth until 2035, propelled by more stringent environmental regulations, an increase in zero-liquid discharge (ZLD) requirements, and a rising demand for media filtration and water reuse technologies. Various countries within the region are committing resources to sustainable water management practices aimed at minimizing environmental impact and ensuring adherence to EU wastewater directives, thereby prioritizing advanced treatment solutions for operators engaged in hydraulic fracturing activities.
Germany is projected to emerge as a significant revenue contributor in Europe’s fracking water treatment market by 2035, attributed to robust regulatory pressures, investments in shale gas exploration, and a wealth of industrial expertise in water technology. Domestic firms such as EnviroChemie provide approximately 250 decentralized wastewater treatment systems each year throughout Germany and Europe. With over 30,000 plants installed globally, the company reported revenues of around €200.79 million in 2021.
The UK is also expected to capture a considerable market share by 2035, driven by heightened scrutiny regarding water contamination, stricter permits for flowback and discharge, and government incentives promoting sustainable extraction practices. Kolina has treated wastewater (comprising surface runoff and flowback) at a fracking exploration site in Lancashire utilizing a 4-cell plant with a capacity of approximately 20 m³/hr, successfully meeting stringent discharge standards and eliminating the need for up to 12 tanker loads of transport per day.
Key Fracking Water Treatment Market Players:
- Schlumberger Limited
- Company Overview
- Business Strategy
- Key Product Offerings
- Financial Performance
- Key Performance Indicators
- Risk Analysis
- Recent Development
- Regional Presence
- SWOT Analysis
- Halliburton Company
- Veolia Environnement SA
- Baker Hughes Company
- Xylem Inc.
- DuPont de Nemours, Inc.
- Ovivo Inc.
- Siemens Water Technologies
- Aquatech International LLC
- IDE Technologies Ltd.
- Origin Water
- Clean TeQ Water Ltd.
- Doosan Heavy Industries & Construction
- VA Tech Wabag Ltd.
- Salcon Berhad
The global market for fracking water treatment is mainly controlled by large US companies such as Schlumberger, Halliburton, and Baker Hughes. Together, these companies account for more than 26% of the overall market. Companies in Europe, such as Veolia and Siemens, focus on advanced filtration and zero liquid discharge (ZLD) technology, which helps to maintain their firm hold in the market. Australian, South Korean, Indian, and Malaysian companies are entering niche markets with inexpensive, modular treatment systems. Examples of market initiatives include mergers, which DuPont has used to acquire a number of companies and broaden its membrane technologies, and partnerships to engage in research and develop chemical-free treatment solutions, removing the need to treat produced water. Though companies are focused on sustainability and saving costs, also expanding the capacity in the region to account for stringent environmental regulations and growing unconventional oil & gas production.
Some of the key players operating in the market are listed below:
Recent Developments
- In December 2024, TETRA Technologies launched the Oasis TDS, an end-to-end desalination solution based on the integration of vacuum membrane distillation with osmotically assisted reverse osmosis (OARO) to treat produced water. The system was able to achieve a water recovery rate of 93% with its treated water achieving TDS of between 40-200 ppm, which is above the municipality standards. The pilot treated over 800,000 barrels/day in the last quarter of 2024. In 2024, produced-water volume in the Permian Basin was 8.4 billion barrels, and the annual reuse market size was USD 4.1 billion.
- In 2024, LiqTech implemented a next-generation containerized pilot system that employs silicon-carbide ceramic ultrafiltration technologies to treat any produced water for reinjection or beneficial reuse. This marks the company’s first produced-water reuse project in the United States, and demonstrates/reflects the pressures that many regulators are facing disposal of wastewater raised by the oil and gas industry, and the use of recycling. Their technology allows for cost-effective treatment options and compliance with stringent water reuse requirements, with its treatment process serving as a major path forward for LiqTech to become a leader in sustainable fracking water treatment and recycling of water that regulators pay more attention to in areas of major oil and gas production around the world.
- Report ID: 3389
- Published Date: Oct 06, 2025
- Report Format: PDF, PPT
- Explore a preview of key market trends and insights
- Review sample data tables and segment breakdowns
- Experience the quality of our visual data representations
- Evaluate our report structure and research methodology
- Get a glimpse of competitive landscape analysis
- Understand how regional forecasts are presented
- Assess the depth of company profiling and benchmarking
- Preview how actionable insights can support your strategy
Explore real data and analysis
Frequently Asked Questions (FAQ)
About this Report
Connect with our Expert

Report, 2026-2035


Copyright @ 2026 Research Nester. All Rights Reserved.
