Ethylene Glycol Monobutyl Ether Market Overlook:
Ethylene Glycol Monobutyl Ether Market size was USD 2.2 billion in 2025 and is estimated to reach USD 2.8 billion by the end of 2035, registering a CAGR of 2.7% during the forecast period, i.e., 2026-2035. In 2026, the industry size of ethylene glycol monobutyl ether is assessed at USD 2.4 billion.
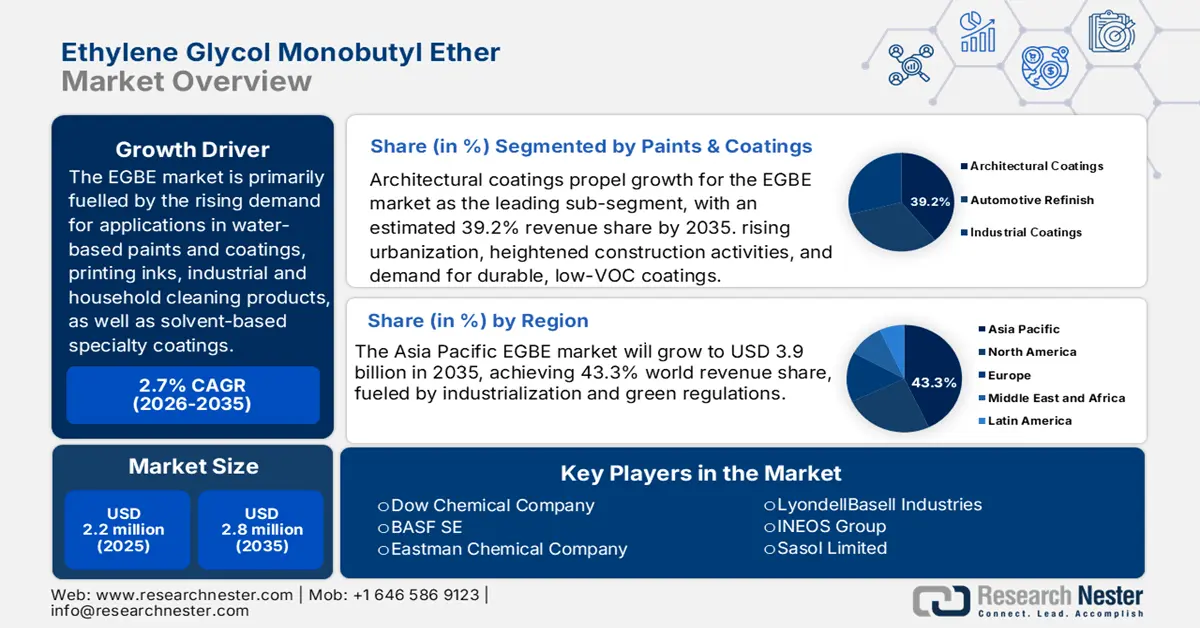
The expansion of the ethylene glycol monobutyl ether market is primarily fuelled by the rising demand for applications in water-based paints and coatings, printing inks, industrial and household cleaning products, as well as solvent-based specialty coatings. The regulatory push to minimize volatile organic compounds (VOCs) is steering formulators towards solvents such as EGBE, which provide advantageous volatility and solvency characteristics. The rapid urbanization and growth in the construction, automotive, and manufacturing industries in the Asia Pacific and the Middle East are further propelling this growth. Additionally, trends in sustainability, such as bio-based feedstocks and certified low-carbon footprint production, are emerging as key differentiators that buyers are increasingly prioritizing.
A prominent case is BASF, in July 2024, BASF declared that its global production facilities for acrylics, alcohols, glycol ethers, and acetates have attained ISCC+ certification, enabling it to provide over 60 products within that range (including glycol ethers) that possess one or more sustainability features like “Low-PCF” (product carbon footprint) or “Zero-PCF.” Furthermore, BASF’s “Butyl Glycol” (Ethylene Glycol Monobutyl Ether) is included in its global product catalogue for the Asia Pacific, underscoring its technical attributes.
Key Ethylene Glycol Monobutyl Ether Market Insights Summary:
Regional Highlights:
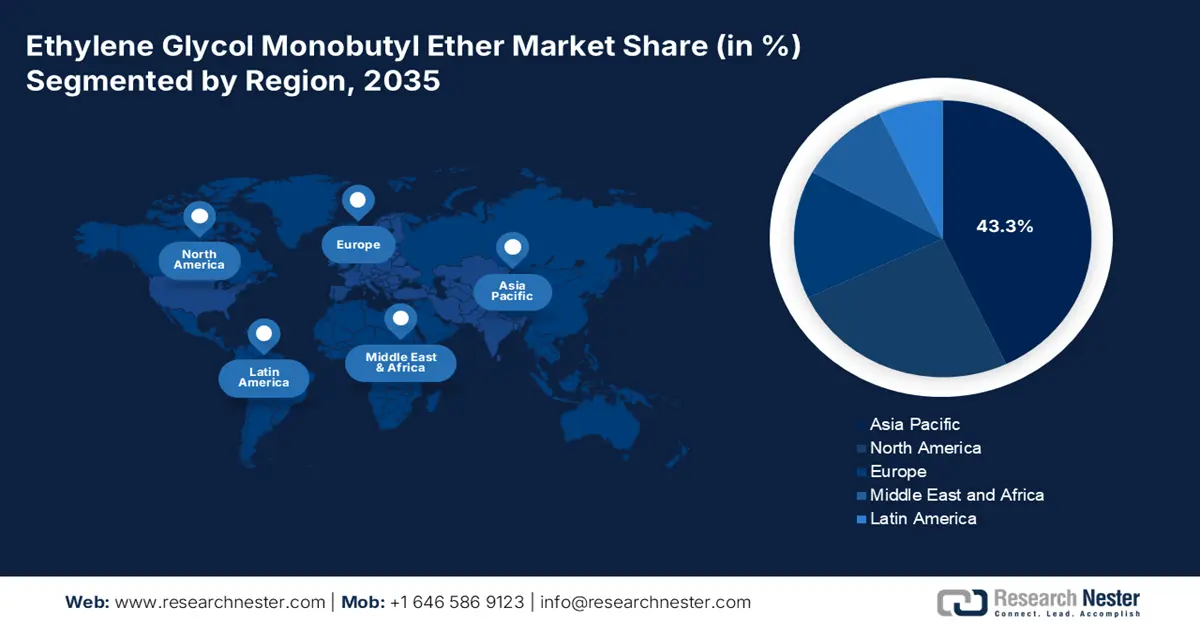
- Asia Pacific’s ethylene glycol monobutyl ether market is anticipated to hold a 43.3% revenue share by 2035, propelled by rapid industrialization, growing demand across coatings, pharmaceuticals, and automotive sectors, and rising preference for sustainable solvents.
- North America’s market is expected to secure a significant share by 2035, owing to increasing demand in paints, coatings, and industrial cleaners, alongside investments in sustainable chemical production.
Segment Insights:
- The architectural coatings segment of the ethylene glycol monobutyl ether market is projected to account for a 39.2% revenue share by 2035, propelled by rising urbanization, expanding construction activities, and the growing preference for sustainable, low-VOC coatings compliant with environmental standards.
- The industrial cleaners segment is expected to capture a significant revenue share by 2035, driven by increasing demand for high-performance, low-toxicity solvents in automotive, manufacturing, and maintenance applications.
Key Growth Trends:
- Growing demand for water-based coatings and paints
- Growing use in industrial cleaning applications
Major Challenges:
- Stringent environmental regulations
- Health and safety concerns
Key Players: Dow Chemical Company, BASF SE, Eastman Chemical Company, LyondellBasell Industries, INEOS Group, Sasol Limited, India Glycols Limited, KH Neochem Co., Ltd., SABIC (Saudi Basic Industries Corporation), Solventis Ltd, DOWA Chemicals, Petronas Chemicals Group, LG Chem, Redox Pty Ltd, Tokyo Chemical Industry Co., Ltd. (TCI).
Global Ethylene Glycol Monobutyl Ether Market Forecast and Regional Outlook:
Market Size & Growth Projections:
- 2025 Market Size: USD 2.2 billion
- 2026 Market Size: USD 2.4 billion
- Projected Market Size: USD 2.8 billion by 2035
- Growth Forecasts: 2.7% CAGR (2026-2035)
Key Regional Dynamics:
- Largest Region: Asia Pacific (43.3% Share by 2035)
- Fastest Growing Region: Europe
- Dominating Countries: China, United States, Germany, India, Japan
- Emerging Countries: Canada, South Korea, Brazil, France, Italy
Last updated on : 6 October, 2025
Ethylene Glycol Monobutyl Ether Market - Growth Drivers and Challenges
Growth Drivers
- Growing demand for water-based coatings and paints: The notable transition from solvent-based to water-based coatings serves as a major catalyst for EGBE, attributed to its superior solvency and compatibility with waterborne formulations. This shift is driven by increasingly stringent environmental regulations aimed at reducing VOC emissions, positioning EGBE as a favoured solvent in environmentally friendly coatings. For example, Dow's DOWANOL PMA Glycol Ether Acetate Electronics Grade is tailored for applications that necessitate low evaporation rates and outstanding solvency, in accordance with eco-friendly standards. Such advancements illustrate Dow's dedication to promoting sustainable chemistry and assisting industries in minimizing their ecological footprint.
- Growing use in industrial cleaning applications: EGBE’s remarkable solvency and minimal toxicity render it suitable for both industrial and household cleaning products. The expansion of the manufacturing and automotive sectors is driving the demand for effective cleaning solvents. For instance, Shell's Ethyl PROXITOL is a high-purity propylene oxide glycol ether, characterized by low volatility and excellent solvency, making it well-suited for waterborne coatings and industrial cleaning agents. These qualities correspond with the rising regulatory requirements for low-VOC and sustainable solvents in cleaning applications. Shell's commitment to sustainability is reflected in its investments in renewable feedstocks and circular chemical production, fostering the creation of eco-friendly cleaning solutions.
- Progress in sustainable production technologies: The demand for bio-based and low-carbon solvents is on the rise as industries strive to lessen their environmental impact. Cutting-edge production technologies for EGBE now incorporate renewable feedstocks, thereby enhancing sustainability and complying with more rigorous regulations. This transition supports greener supply chains and the development of eco-friendly products across various sectors.
1. Ethylene Glycol Monobutyl Ether Market: Trade Analysis
Annual Trade Volume of Paint (2023)
|
Leading Exporters |
Global Share |
Leading Importers |
Global Share |
|
Germany |
13.9% |
Germany |
6.64% |
|
China |
12.2% |
U.S. |
5.82% |
|
U.S. |
9.29% |
China |
5.49% |
|
Japan |
5.55% |
France |
4.64% |
|
India |
3.94% |
Italy |
3.58% |
Source: OEC
2. Export Quantity of Ethylene Glycol Monobutyl Ether Market
Export Quantity of EGBE in 2023
|
Leading Exporters |
Trade Value USD |
Quantity (Kg) |
|
U.S. |
141,573.73 |
113,292,000 |
|
Germany |
62,655.08 |
40,140,000 |
|
Korea |
54,228.33 |
46,991,600 |
|
European Union |
51,857.19 |
32,219,700 |
|
China |
29,907.61 |
20,523,000 |
Source: WITS
Challenges
- Stringent environmental regulations: The EGBE market encounters difficulties due to the growing stringency of environmental regulations globally. Limitations on volatile organic compounds (VOCs) and hazardous air pollutants restrict the application of conventional solvents, compelling manufacturers to either reformulate their products or seek alternatives. Adhering to these regulations raises production expenses and may hinder market expansion, particularly in areas with stringent environmental policies.
- Health and safety concerns: EGBE’s designation as a potential reproductive toxicant generates health and safety apprehensions among both workers and end-users. The implementation of strict handling protocols and protective measures complicates operations and elevates costs for manufacturers and formulators. These safety issues can limit the use of EGBE in consumer products, thereby affecting overall market acceptance despite the solvent's favourable properties.
Ethylene Glycol Monobutyl Ether Market Size and Forecast:
| Report Attribute | Details |
|---|---|
|
Base Year |
2025 |
|
Forecast Year |
2026-2035 |
|
CAGR |
2.7% |
|
Base Year Market Size (2025) |
USD 2.2 billion |
|
Forecast Year Market Size (2035) |
USD 2.8 billion |
|
Regional Scope |
|
Ethylene Glycol Monobutyl Ether Market Segmentation:
Paints & Coatings Segment Analysis
Architectural coatings continue to be the foremost sub-segment propelling growth in the ethylene glycol monobutyl ether market, with projections indicating an anticipated 39.2% revenue share by 2035. This increase is linked to rising urbanization, heightened construction activities, and an escalating demand for durable, low-VOC coatings that comply with environmental regulations. For instance, Sherwin-Williams has created a platform designed to help customers comprehend the sustainability features of its products, including those that contain glycol ethers. This platform offers access to regulatory and product sustainability documents, such as GREENGUARD certifications and Environmental Product Declarations (EPDs), thereby promoting transparency and adherence to environmental standards.
Cleaning Agents Segment Analysis
Industrial cleaners constitute the second-largest segment contributing to growth in the ethylene glycol monobutyl ether market, with expectations of securing a notable revenue share by 2035. This expansion is driven by the rising demand for efficient, low-toxicity solvents across the automotive, manufacturing, and maintenance industries. Eastman Chemical markets Ethylene Glycol Monobutyl Ether under the name Eastman EB Solvent, which is valued for its high flash point, water solubility, slow evaporation rate, and low surface tension. Commonly utilized in coatings and cleaners, EGBE was removed from the EPA’s list of hazardous pollutants in 2004.
Pharmaceuticals Segment Analysis
The drug formulations segment is projected to capture a significant share of the global ethylene glycol monobutyl ether market by 2035, driven by its role as a solvent and intermediate in pharmaceutical manufacturing. Its superior solvency and low toxicity render it ideal for drug synthesis. Clariant AG's Care Chemicals business unit reported sales of CHF 2,242 million in 2024, achieving an EBITDA margin of 18.0%. This segment encompasses specialty glycol ethers utilized in pharmaceutical applications, highlighting product purity and regulatory compliance to satisfy rigorous industry standards. Clariant aims for an annual sales growth of 4-6% and an EBITDA margin of 19-21% by 2025.
Our in-depth analysis of the ethylene glycol monobutyl ether market includes the following segments
|
Segment |
Subsegment |
|
Paints & Coatings |
|
|
Cleaning Agents |
|
|
Pharmaceuticals |
|
|
Printing Inks |
|
|
Other Industrial |
|

Vishnu Nair
Head - Global Business DevelopmentCustomize this report to your requirements — connect with our consultant for personalized insights and options.
Ethylene Glycol Monobutyl Ether Market - Regional Analysis
APAC Market Insights
Asia Pacific’s ethylene glycol monobutyl ether market is anticipated to hold 43.3% revenue share by 2035, propelled by swift industrialization, an increasing demand in the coatings, pharmaceuticals, and automotive sectors, as well as a growing preference for sustainable solvents. The primary nations contributing to this growth include China, India, and Japan, where expanding manufacturing capabilities and governmental support for environmentally friendly chemical production are influencing market dynamics.
China is anticipated to lead the Asia Pacific ethylene glycol monobutyl ether market by 2035, fuelled by advancements in electric vehicle coatings and rigorous environmental regulations that encourage the use of green solvents. ChemChina has made notable progress in sustainable chemical production, particularly in the development of bio-based ethylene glycol (EG) technologies. Researchers in China have created a bio-based EG production technology with an annual capacity of 1,000 metric tonnes, securing over 40 patents. This innovation represents a significant advancement in China’s green transformation of its chemical sector.
India is expected to capture the second-largest share of the APAC ethylene glycol monobutyl ether market, driven by substantial demand from the pharmaceutical and coatings industries. Hindustan Organic Chemicals Limited (HOCL) stands out as a major producer of basic organic chemicals in India, including phenol, acetone, and hydrogen peroxide. The company operates manufacturing facilities in Kochi and has a subsidiary in Rudraram, Telangana. HOCL has been acknowledged for its dedication to quality and environmental management, holding ISO 9001:2015, ISO 14001:2015, and ISO 45001:2018 certifications.
APAC Trade Volume of EGBE (2023)
|
Leading Exporters |
Global Share |
Leading Importers |
Global Share |
|
South Arabia |
66.9% |
China |
50.6% |
|
South Korea |
8.61% |
India |
7.07% |
|
Malaysia |
8.22% |
South Korea |
6.02% |
|
China |
4.68% |
Singapore |
5.71% |
Source: OEC
North America Market Insights
North America's EGBE market is anticipated to capture a significant share by 2035. This anticipated growth is fuelled by rising demand in the sectors of paints, coatings, and industrial cleaners, bolstered by investments in sustainable chemical production and initiatives aimed at reducing VOC emissions. The United States and Canada are the primary contributors to this growth.
The U.S. is projected to dominate the North American Ethylene Glycol Monobutyl Ether (EGBE) market by 2035, driven by strong demand in the paints, coatings, and industrial cleaners sectors. The tightening of environmental regulations that promote the use of low-VOC and sustainable solvents further accelerates market growth. LyondellBasell provides a wide range of glycol ethers, including Ethylene Glycol Monobutyl Ether (EGBE), serving various industries such as paints, coatings, and industrial cleaners. Additionally, the company is dedicated to sustainability, as demonstrated by its introduction of the +LC (Low Carbon) solutions in 2023. These solutions are produced using an International Sustainability and Carbon Certification (ISCC) PLUS certified mass balance methodology, which sources materials from recycled and renewable feedstocks. This initiative aids businesses in achieving their greenhouse gas emissions reduction targets while ensuring high-quality applications.
Canada is expected to secure a considerable revenue share in the North American EGBE market by 2035, propelled by growth in the automotive coatings and household cleaner sectors. In 2021, the Nature Smart Climate Solutions Fund (NSCSF) was established, which will allocate $631 million over a decade to projects aimed at restoring degraded ecosystems, enhancing land management practices, and conserving carbon-rich ecosystems that are at high risk of being converted to other uses that would release their stored carbon.
Europe Market Insights
Europe’s EGBE market is anticipated to experience significant growth by 2035, driven by stringent environmental regulations and an increasing demand in the paints, coatings, and industrial cleaning sectors. The rising emphasis on low-VOC solvents and sustainable production techniques further bolsters market expansion throughout the region.
The UK is expected to capture a considerable revenue share in the European EGBE market by 2035, propelled by growing demand in the pharmaceuticals, paints, and coatings industries. The UK's dedication to minimizing volatile organic compound (VOC) emissions and fostering sustainable chemical manufacturing practices further enhances market growth. Croda International reported a 7% rise in revenue in 2023, attributed to robust demand for sustainable specialty chemicals. Their Industrial Specialties segment, which encompasses glycol ether-based products, played a significant role by providing eco-friendly solutions to the coatings and personal care sectors.
Germany is projected to dominate the EGBE market by 2035, driven by strong demand in automotive coatings, industrial cleaners, and sustainable manufacturing practices. The country’s rigorous environmental regulations and commitment to green chemistry practices promote market growth, establishing Germany as a pivotal centre for eco-friendly solvent production and innovation within the European chemical industry.
Key Ethylene Glycol Monobutyl Ether Market Players:
- Dow Chemical Company
- Company Overview
- Business Strategy
- Key Product Offerings
- Financial Performance
- Key Performance Indicators
- Risk Analysis
- Recent Development
- Regional Presence
- SWOT Analysis
- BASF SE
- Eastman Chemical Company
- LyondellBasell Industries
- INEOS Group
- Sasol Limited
- India Glycols Limited
- KH Neochem Co., Ltd.
- SABIC (Saudi Basic Industries Corporation)
- Solventis Ltd
- DOWA Chemicals
- Petronas Chemicals Group
- LG Chem
- Redox Pty Ltd
- Tokyo Chemical Industry Co., Ltd. (TCI)
The global market for ethylene glycol monobutyl ether is relatively consolidated, featuring key players like Dow, BASF, and Eastman, who possess significant production capabilities and extensive distribution networks worldwide. Such strategic moves as vertical integration, low-VOC solvent R&D, and mergers and acquisitions are major drivers. For example, Dow has recently expanded its glycol ether capacity in Texas, and BASF invested €400 million in Asia-Pacific solvent facilities. Indian and Malaysian start-ups are using cost savings and green chemistry initiatives to penetrate international supply chains. Innovation, sustainability, and regional growth continue to be at the heart of competitive differentiation in this changing market.
The following are the top key players of the ethylene glycol monobutyl ether market:
Recent Developments
- In December 2024, Dow Chemical increased the price of various grades of glycol ethers, such as EGBE, by USD 0.05 per pound, effective January 6, 2025. This shift reflects strong demand for these products in the sectors of paints, coatings, and cleaners, and aims to address the rising production costs.
- In 2023, BASF launched a new grade of ethylene glycol monobutyl ether (EGBE) specifically for water-based paints and coatings. The product increases adhesion, flexibility, and durability, meeting the expanding need for environmentally friendly solvents in the coatings market.
- Report ID: 7724
- Published Date: Oct 06, 2025
- Report Format: PDF, PPT
- Explore a preview of key market trends and insights
- Review sample data tables and segment breakdowns
- Experience the quality of our visual data representations
- Evaluate our report structure and research methodology
- Get a glimpse of competitive landscape analysis
- Understand how regional forecasts are presented
- Assess the depth of company profiling and benchmarking
- Preview how actionable insights can support your strategy
Explore real data and analysis
Frequently Asked Questions (FAQ)
Free Sample includes current and historical market size, growth trends, regional charts & tables, company profiles, segment-wise forecasts, and more.
Connect with our Expert


Copyright @ 2026 Research Nester. All Rights Reserved.
