Energy Management Software Market Outlook:
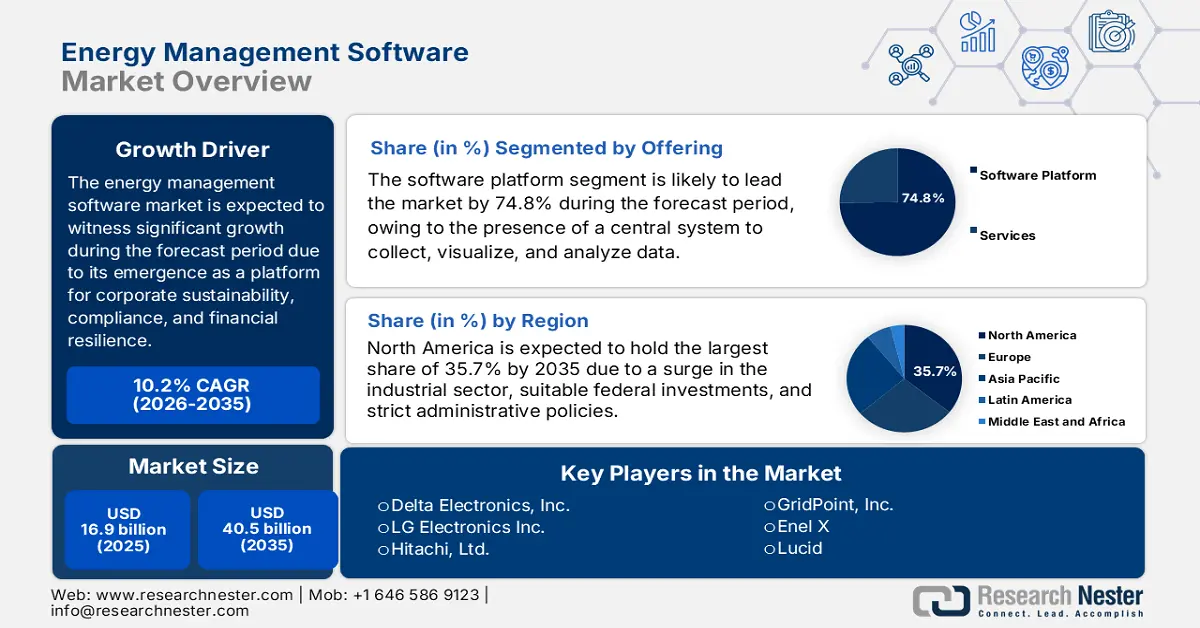
Energy Management Software Market size was over USD 16.9 billion in 2025 and is estimated to reach USD 40.5 billion by the end of 2035, expanding at a CAGR of 10.2% during the forecast timeline, i.e., 2026-2035. In 2026, the industry size of energy management software is estimated at USD 18.6 billion.
The worldwide energy management software market is witnessing a profound transformation, emerging from a niche operational tool for cost reduction into a severe and tactical platform for financial resilience, corporate sustainability, and regulatory compliance. According to a data report published by the IEA Organization in 2025, there has been an increase in the international electricity demand by 4.3% as of 2024, denoting a surge from 2.5% in 2023. In addition, the average pace of electricity requirement between 2010 and 2023 was 2.7%, which is twice the rate of overall energy growth. Besides, the electricity consumption has also increased by 1,080 TWh, which is almost twice the yearly average of the previous decade. Moreover, there has been a continuous change in the overall finalized electricity consumption for a few regions, which is highly responsible for uplifting the energy management software market globally.
Total Final Electricity Consumption Modifications Across Regions (2012-2024)
|
Regions |
2012-2022 (TWh) |
2023 (TWh) |
2024 (TWh) |
|
Advanced Economies |
39.0 |
-140.8 |
230.9 |
|
India |
57.5 |
141.4 |
80.7 |
|
Southeast Asia |
47.1 |
44.0 |
85.9 |
|
Middle East |
30.4 |
28.8 |
29.5 |
Source: IEA Organization
Furthermore, artificial intelligence-based predictive analytics, carbon accounting, ESG integration, SaaS and cloud-native dominance, increased focus on demand response and grid interaction, and hyper-automation in industry and buildings are other drivers for bolstering the energy management software market. As per a report published by the ANL Government in April 2024, through artificial intelligence, commercial powerplant licensing and design readily account for almost 50% of the time to commercialize the latest energy deployments. Besides, the Department of Energy (DOE) has estimated the successful onboarding of 1.6TW of the newest solar capacity, along with 200 GW of the newest nuclear capacity. In addition, the DOE also estimated the demand to diminish expenses to less than USD 100 per net metric ton of carbon dioxide, which is equivalent for both carbon storage and capture to cater to carbon pollution, thereby making it suitable for skyrocketing the market’s exposure.
Key Energy Management Software Market Insights Summary:
Regional Highlights:
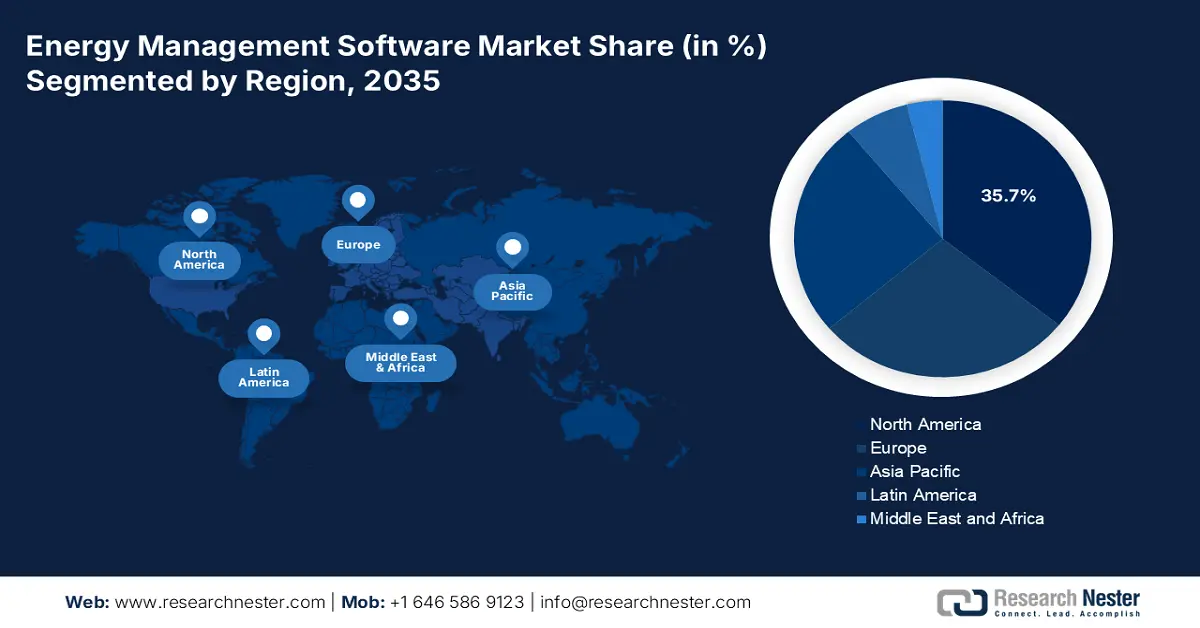
- In the energy management software market, North America is expected to secure a 35.7% share by 2035, uplifted by the presence of a mature industrial sector, strict regulatory frameworks, and substantial federal investment in decarbonization and energy efficiency.
- Asia Pacific is poised to become the fastest-growing region by 2035, supported by rising industrialization, escalating industrial energy costs, and stringent government mandates on carbon neutrality and energy efficiency.
Segment Insights:
- In the energy management software market, the software platform sub-segment is anticipated to command a 74.8% share by 2035, propelled by its ability to centralize visualization, analysis, and data collection.
- The subscription-based (SaaS) segment is forecasted to hold a significant share by 2035, supported by the preference for predictable operational spending and agility-driven business models.
Key Growth Trends:
- Rising and volatile energy costs
- Advancements in connectivity and IoT
Major Challenges:
- Data privacy and cybersecurity concerns
- Interoperability issue and market fragmentation
Key Players: Siemens AG (Germany), Schneider Electric SE (France), Honeywell International Inc. (U.S.), Johnson Controls International plc (Ireland), IBM Corporation (U.S.), ABB Ltd. (Switzerland), General Electric Company (U.S.), Emerson Electric Co. (U.S.), Rockwell Automation, Inc. (U.S.), Oracle Corporation (U.S.), SAP SE (Germany), Mitsubishi Electric Corporation (Japan), Delta Electronics, Inc. (Taiwan), LG Electronics Inc. (South Korea), Hitachi, Ltd. (Japan), GridPoint, Inc. (U.S.), Enel X (Italy), Lucid (U.S.), EnergyCAP, Inc. (U.S.), C3.ai, Inc. (U.S.).
Global Energy Management Software Market Forecast and Regional Outlook:
Market Size & Growth Projections:
- 2025 Market Size: USD 16.9 billion
- 2026 Market Size: USD 18.6 billion
- Projected Market Size: USD 40.5 billion by 2035
- Growth Forecasts: 10.2% CAGR (2026-2035)
Key Regional Dynamics:
- Largest Region: North America (35.7% Share by 2035)
- Fastest Growing Region: Asia Pacific
- Dominating Countries: United States, China, Germany, Japan, United Kingdom
- Emerging Countries: India, South Korea, Australia, Singapore, Brazil
Last updated on : 1 December, 2025
Energy Management Software Market - Growth Drivers and Challenges
Growth Drivers
- Rising and volatile energy costs: The global energy price volatility and long-lasting inflationary trends are significantly pushing operational expenditure reduction to the topmost corporate agenda. This has created an urgent and direct return on investment (ROI) for energy efficiency investments, which in turn is positively impacting the energy management software market internationally. According to an article published by the EIA Government in June 2023, the yearly average retail electricity price in the U.S. was 12.49¢ per kilowatt-hour as of 2022. Additionally, the electricity prices for utility customers amounted to 15.12¢ per kWh for residential, followed by 12.55¢ per kWh for commercial, 11.66¢ per kWh for transportation, and 8.45¢ per kWh for industrial. Therefore, the variation in electricity prices is constituting a huge growth opportunity for the market across different nations.
- Advancements in connectivity and IoT: The proliferation of robust connectivity and low-cost IoT sensors is significantly offering real-time and granular data, which is essential for applications in the innovative energy management software market. This has readily resulted in making sophisticated energy management suitable for a comprehensive range of organizations. For instance, as per an article published by NLM in April 2023, the 5G connectivity usually ranges from 24 GHz to 100 GHz, and the Sub 6 GHz band comprises frequencies lower than 6 GHz. Besides, in the case of 5G energy consumption, when the traffic load is lower, a base station can tend to save almost 98.7% of power, which denotes a suitable way of combating increased electricity consumption, thereby bolstering the market’s exposure.
- Standard financial grants and incentives: The aspects of utility rebate programs, tax credits, and government grants for clean technology and energy efficiency are effectively reducing the overall expense of ownership for the energy management software market. This has caused an increase in adopting the market across small and medium-sized enterprises (SMEs). As stated in a data report published by the IEA Organization in June 2023, USD 1.3 trillion has been generously allocated by governments to support clean energy projects internationally. Since then, there has been an increase in investment by 25%, which has outpaced the fossil fuels growth. Meanwhile, nearly USD 130 billion of the latest government expenditure significantly supports clean energy investments for new allocations, thereby continuously boosting the overall energy management software market.
Challenges
- Data privacy and cybersecurity concerns: The aspect of connecting energy assets to the cloud and corporate network has significantly expanded organizations’ attack surface, which negatively impacts the energy management software market’s growth. Besides, energy systems are readily considered severe infrastructure, and a breach occurrence can result in physical damage, financial loss, and operational disruption. Therefore, an energy management software demands accessibility to sensitive operational technology networks that have conventionally been air-gapped. Meanwhile, risks around the granular operational data exposure can reveal production secrets and business approaches, which also lead to resistance to cloud-based deployments, thereby causing a hindrance in the market’s development.
- Interoperability issue and market fragmentation: The energy management software market is extremely fragmented, with organizations ranging from building controls specialists to industrial automation giants, along with utility spin-offs and pure-play software start-ups. Therefore, this absence of standardization has led to significant interoperability risks, which have reduced the market’s expansion and growth. Besides, while vendors readily promote their proprietary ecosystems, consumers are frequently left with the limitation of undertaking solutions from various vendors. The lack of open data and universal standards caters to the fact that, after a successful implementation, the adoption or expansion of new technologies to additional infrastructures is considered a recurring challenge, thus negatively impacting the market’s development.
Energy Management Software Market Size and Forecast:
| Report Attribute | Details |
|---|---|
|
Base Year |
2025 |
|
Forecast Year |
2026-2035 |
|
CAGR |
10.2% |
|
Base Year Market Size (2025) |
USD 16.9 billion |
|
Forecast Year Market Size (2035) |
USD 40.5 billion |
|
Regional Scope |
|
Energy Management Software Market Segmentation:
Offering Segment Analysis
The software platform sub-segment, which is part of the offering segment, is anticipated to garner the highest share of 74.8% in the energy management software market by the end of 2035. The sub-segment’s exposure is highly attributed to its provision of a centralized system to visualize, analyze, and collect data. In addition, this enables better sustainability, improved operational efficiency, and enables cost savings. According to an article published by WIPO in June 2025, the international software expenditure reached USD 675 billion as of 2024, denoting an almost 50% rise from USD 454 billion in 2020. Besides, the U.S. effectively maintains a standard position by leading in software investment, amounting to USD 368.5 billion as of 2024. This is over half of other nations’ total and almost 6 times the next-highest spender, thereby making it suitable for boosting the overall segment.
Pricing Model Segment Analysis
The subscription-based (SaaS) segment, a part of the pricing model, is projected to account for the second-largest share in the energy management software market during the forecast duration. The segment’s growth is highly driven by the fundamental alignment with the demand for predictable operating spending and modernized businesses seeking agility. Unlike perpetual licenses that need upfront and massive capital investment, SaaS readily operates on a pay-as-you-go and recurring subscription fee. This has eventually lowered the actual gap to entry, thereby making the innovative EMS accessible to SMEs. Besides, for vendors, this has created a recurring and stable revenue stream and has also fostered a continuous relationship with consumers. Furthermore, the SaaS pricing model inherently comprises technical support, security patches, and ongoing updates, thus ensuring client accessibility to the current features.
Deployment Segment Analysis
The cloud-based segment in the energy management system market is predicted to cater to the third-largest share by the end of the stipulated period. The segment’s development is highly fueled by its ability to provide anywhere and real-time accessibility to energy consumption data, which enables households and businesses to control and monitor usage for improved efficiency and cost reduction. As per an article published by the EESI Organization in April 2025, nearly 56% of electricity utilized for power data centers derives from fossil fuels, and these centers constitute a projected electricity need by the end of 2030, which is set to increase to almost 130 GW or 1,050 TWh. This represents close to 12% of the overall U.S. yearly demand. Therefore, it is crucial to build the newest fossil-fuel facilities to successfully fulfil the electricity demand, thus suitable for the segment’s growth.
Our in-depth analysis of the energy management software market includes the following segments:
|
Segment |
Subsegments |
|
Offering |
|
|
Pricing Model |
|
|
Deployment |
|
|
Enterprise Size |
|
|
End user |
|
|
Application |
|

Vishnu Nair
Head - Global Business DevelopmentCustomize this report to your requirements — connect with our consultant for personalized insights and options.
Energy Management Software Market - Regional Analysis
North America Market Insights
North America in the energy management software market is anticipated to garner the highest share of 35.7% by the end of 2035. The market’s upliftment is highly attributed to the existence of the mature industrial sector, strict regulatory frameworks, and substantial federal investment in decarbonization and energy efficiency. In addition, the financial imperative to combat volatile energy prices, the demand for grid resilience, and corporate ESG mandates are also uplifting the market in the region. For instance, in October 2024, the U.S. Department of Energy (DOE) declared over USD 600 million to boost grid reliability and resilience in the face of critical weather and enhance electricity demand across different states. Besides, the Grid Deployment Office is significantly administering the USD 1.5 billion Grid Resilience and Innovation Partnerships (GRIP) Program to optimize the power system resilience and enhance grid flexibility, thereby making it suitable for uplifting the energy management software market in the region.
Innovation Partnerships and Grid Resilience Program Components in America (2024)
|
Program Components |
Attributes |
|
Overall Federal Investment |
USD 7.6 billion |
|
Total Projects Selected |
105 |
|
Miles of Transmission Affected |
Approximately 2,500 |
|
Employment Opportunity Created or Supported |
More than 15,000 |
|
Estimated Number of Consumers Impacted |
85 million |
Source: Department of Energy
The U.S. in the energy management software market is growing significantly, owing to the aspect of federal regulatory and funding opportunities, the presence of specific programs and their impact, along with advanced manufacturing technologies. For instance, as per an article published by the U.S. DOE in April 2023, the department provided USD 50 million in funding to escalate the utilization of smart manufacturing technologies through offering accessibility to assistance and tools. In addition, the State Manufacturing Leadership Program readily supports the newest or extended state programs that permit small- and medium-sized manufacturers (SMM) to enhance the smart manufacturing utilization. Moreover, the Program also provided nearly USD 2 million to ensure a competitive basis for a more than 3-year term and will need nearly 30% cost match, thus creating an optimistic approach for the energy management software market.
Canada in the energy management software market is also growing due to the aspect of the federal carbon pricing backstop, tactical federal funding for clean technology adoption, the economic imperative in export and resource-driven industries, grid interaction, and develop code modernization. Besides, the governmental funding provision is also the most driving factor for bolstering the market in the country. For instance, as per an article published by the Global Trade Alert Organization, in October 2024, the country’s government notified CAD 40 million in state aid for the Manufacturing Program, as well as the Green Industrial Facilities. Besides, as mentioned in a report published by UNFCCC in February 2025, the nation is determined and committed to achieving net-zero emissions by the end of 2050, and generously contributes to international efforts to restrict temperature to below 2 degrees Celsius, which is creating a positive impact on the market.
APAC Market Insights
Asia Pacific market is predicted to emerge as the fastest-growing region during the forecast duration. The market’s development in the region is extremely propelled by an increase in industrialization, escalation in industrial energy expenses, and strict government mandates on carbon neutrality and energy efficiency. Besides, artificial intelligence and cloud-based technologies are also notable drivers for the energy management software market in the region. As per an article published by NLM in March 2025, the technical ecosystem depends on Cyber-Physical Systems (CPSs), which are equally distributed and significantly utilize LoRaWAN with specific regional parameters, such as AS923 (923 MHz) in parts of Asia, followed by KR920 (920 to 923 MHz) in South Korea, CN470 (470 to 510 MHz) in China, AU915 (915 to 928 MHz) in Australia, IN865 (865 to 867 MHz) in India. Therefore, with the availability of these parameters, there is a huge growth opportunity for the market in the region.
China in the energy management software market is gaining increased traction due to the existence of its very own industrial base, along with the government’s uncompromising regulatory frameworks. Meanwhile, the National Development and Reform Commission's (NDRC) Dual Control approach has mandated reductions in energy consumption and intensity, which has pressured large-scale enterprises to integrate energy management software to avoid penalties and ensure compliance. As per an article published by Climate Cooperation China in July 2025, the Ministry of Ecology and Environment (MEE) has incorporated the Product Carbon Footprint Management System, based on which an average carbon intensity of 0.6205 kg CO₂e/kWh of electricity is readily generated throughout the country. Regarding this, more than 1,000 listed organizations have disclosed greenhouse gas emissions, and over 150 firms have reported Scope 3 emissions, thereby bolstering the market’s upliftment in the nation.
India in the energy management software market is also developing, owing to rapid expansion in the economy and the presence of an aggressive government policy. In addition, the extended Perform, Achieve, and Trade (PAT) scheme, functioning under the Bureau of Energy Efficiency, has significantly expanded its sectors to virtually cover the majority of energy customers. According to a data report published by the IBEF Organization in October 2025, the foreign direct investment (FDI) flow in the country has reached USD 23.4 billion by June 2025. Based on this, Odisha has aimed to convert into a standard petrochemical center by targeting ₹1.2 trillion (USD 13.6 billion) by the end of 2035. In addition, the Power and Renewable Energy Manufacturing Zone’s construction is projected to be worth ₹460 crore (USD 55.5 million), which is poised to contribute to employment opportunities, thereby enhancing the market’s growth.
Europe Market Insights
Europe market is projected to witness considerable growth by the end of the stipulated period. The market’s growth in the region is highly fueled by the strict regulatory framework, which is centered around the Fit for 55 package and the Green Deal strategy. This has readily mandated in-depth decarbonization across different industrial sectors, which has positively boosted the market’s exposure throughout the region. Besides, according to a report published by the IPC Organization in 2025, the regional production of electronic systems across 8 tactical industries is projected to increase by 52.5% by the end of 2035. In addition, the region needs to achieve an additional 16.8% growth, with the intention of maintaining its 2023 international market share of 16.7% in electronics systems. Therefore, with increased focus on electronics, the energy management software market is poised to experience growth in the region.
The energy management software market in Germany is gaining increased exposure, owing to the export-based industrial and massive base for automotive and chemical industries, along with a high-cost and proactive regulatory environment. Besides, the country’s Federal Ministry for Economic Affairs and Climate Action (BMWK) is strongly enforcing the Energy Efficiency Strategy 2050, which has ensured consumption reduction. According to the 2025 IEA Organization report, 80% of the electricity supply in the country needs to be derived from renewable sources by the end of 2030 and 100% by the end of 2035. Moreover, the majority of legislative policies in renewable energy have resulted in planning and ensuring targets of 200 GW solar, 100 to 110 GW onshore wind, 30 GW offshore wind, as well as generous investments in 10 GW hydrogen by the end of 2030. Therefore, with such futuristic objectives, the country is readily uplifting the energy management software market.
The energy management software market in Poland is also growing due to increased pressure on its coal-based and massive industrial sector, intending to align with regional climate reforms and ensure accessibility to modernization funds. Besides, as per an article published by the Bankwatch Network in April 2024, the Just Transition Fund (JTF) has allocated nearly EUR 3.8 billion, and it has been further divided among 5 regions. This includes EUR 2.1 billion for Upper Silesia, followed by EUR 254 million for West Małopolska, EUR 581.5 million for Lower Silesia (Wałbrzych), EUR 415 million for East Wielkopolska, and EUR 370 million for Łódź (Bełchatów). This funding is considered a huge benefit for heavy sectors, such as manufacturing and chemicals, which are being compelled to invest in energy-based technologies to overcome escalating ETS expenses and qualify for generous funding.
Key Energy Management Software Market Players:
- Siemens AG (Germany)
- Company Overview
- Business Strategy
- Key Product Offerings
- Financial Performance
- Key Performance Indicators
- Risk Analysis
- Recent Development
- Regional Presence
- SWOT Analysis
- Schneider Electric SE (France)
- Honeywell International Inc. (U.S.)
- Johnson Controls International plc (Ireland)
- IBM Corporation (U.S.)
- ABB Ltd. (Switzerland)
- General Electric Company (U.S.)
- Emerson Electric Co. (U.S.)
- Rockwell Automation, Inc. (U.S.)
- Oracle Corporation (U.S.)
- SAP SE (Germany)
- Mitsubishi Electric Corporation (Japan)
- Delta Electronics, Inc. (Taiwan)
- LG Electronics Inc. (South Korea)
- Hitachi, Ltd. (Japan)
- GridPoint, Inc. (U.S.)
- Enel X (Italy)
- Lucid (U.S.)
- EnergyCAP, Inc. (U.S.)
- C3.ai, Inc. (U.S.)
- Siemens AG is considered an international automation powerhouse, providing its wide-ranging portfolio, which comprises the Building Twin and MindSphere IoT platform solutions for improving energy across the overall supply chain system. Its strength emerges from deeply integrated operational technology, along with informational technology to deliver energy efficiency for smart manufacturing and infrastructure. Based on these, and as stated in its 2024 annual report, Siemens has generated €8,301 million in earnings per share, followed by €8,795 million in adjusted net income, €789 million in weighted average shares, and 11.1 as EPS pre PPA.
- Schneider Electric SE has integrated efficiency through its very own EcoStruxure platform, which is an IoT-based architecture that connects building management, industrial automation, and power distribution without any obstacles. The organization is also considered a leader in offering end-to-end solutions that readily deliver resilience and sustainability for industries, data centers, buildings, and homes.
- Honeywell International Inc. has leveraged its expanded expertise in aerospace and building controls to offer the Honeywell Building Management System, which is a notable component of its Enterprise Performance Management portfolio. Its solutions are focused on improving energy consumption, ensuring regulatory compliance, and optimizing operational efficiency for an international client base. Besides, as stated in its 2024 annual report, the organization witnessed 5% growth in full-year sales as well as enhancement in research and development expenditures, along with USD 13.1 billion in overall revenue contributions.
- Johnson Controls International plc is regarded as the foundational player in the building technologies space, fueling efficiency through its OpenBlue digital platform as a service. The firm readily specializes in connecting legacy building systems, such as its outstanding HVAC equipment, to the centralized nervous system that permits AI-based energy improvement and sustainability.
- IBM Corporation has brought its formidable expertise in artificial intelligence and enterprise software to the overall market through its IBM Maximo Application Suites and IBM Tririga, which are frequently powered by the IBM Watson AI platform. The company’s focus is on offering strong data analytics, ESG reporting capabilities, and asset performance management for complex and large enterprise portfolios.
Here is a list of key players operating in the global energy management software market:
The international energy management software market is extremely fragmented and characterized by the combined existence of emerging artificial intelligence-based platforms, specialized pure-play vendors, and industrial automation organizations. Notable giants, such as Schneider Electric and Siemens, have effectively leveraged their in-depth expertise in industrial and building hardware to provide end-to-end, integrated solutions. Moreover, a tactical approach for driving the market is the robust integration of machine learning and AI for autonomous optimization and predictive analytics. Besides, in June 2024, Yokogawa Electric Corporation declared that it has successfully acquired BaxEnergy. This particular acquisition provided Yokogawa with a standard range of solutions that have been eventually adopted by the majority of power firms across Europe, which is positively impacting the energy management software market globally.
Corporate Landscape of the Energy Management Software Market:
Recent Developments
- In January 2025, ABB significantly invested in a tactical partnership with Edgecom Energy for utilizing artificial intelligence to assist commercial and industrial consumers in reducing and managing peaks in their power demand.
- In November 2024, Hitachi Energy introduced the latest artificial intelligence-based energy forecasting solution, which is known as Nostradamus AI. This has been developed by utilizing the company’s in-depth energy industry expertise, and it offers traders, energy producers, power system operators, and utilities with precise forecasts.
- In July 2024, GreenPowerMonitor (GPM) has introduced an innovative energy management system, which is designed particularly for renewable power plants. This latest system displays a suitable leap forward in these infrastructures’ operational efficiency, syncing with the international movement to enhance renewable energy capacity.
- Report ID: 3061
- Published Date: Dec 01, 2025
- Report Format: PDF, PPT
- Explore a preview of key market trends and insights
- Review sample data tables and segment breakdowns
- Experience the quality of our visual data representations
- Evaluate our report structure and research methodology
- Get a glimpse of competitive landscape analysis
- Understand how regional forecasts are presented
- Assess the depth of company profiling and benchmarking
- Preview how actionable insights can support your strategy
Explore real data and analysis
Frequently Asked Questions (FAQ)
About this Report
Connect with our Expert


Copyright @ 2026 Research Nester. All Rights Reserved.
