Cutting Fluid Market Outlook:
Cutting Fluid Market size was valued at USD 11.75 billion in 2025 and is set to exceed USD 17.73 billion by 2035, expanding at over 4.2% CAGR during the forecast period i.e., between 2026-2035. In the year 2026, the industry size of cutting fluid is estimated at USD 12.19 billion.
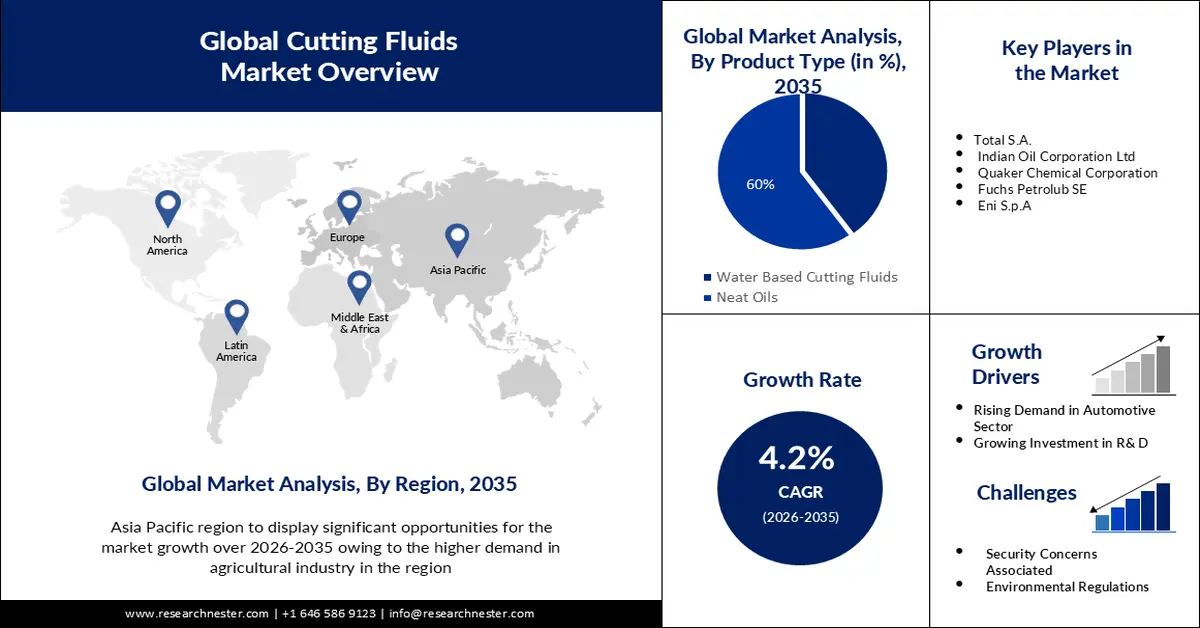
Cutting fluids are seeing significant expansion in the market mainly because of the expanding automotive sector brought on by the rising production of automobiles. In metalworking applications, they are frequently utilized as coolants for metal treatment, removal, forming, and protection. Therefore, it is anticipated that an increase in auto production will stimulate the cutting fluids industry. In the year 2022, somewhere around 85 million motor vehicles were produced all over the world.
Increasing demand for sustainable products is predicted to drive the growth of the cutting fluid market. Nowadays, manufacturers are focusing on providing sustainable cutting fluids that are high in demand among consumers. Owing to environmental concerns and other reasons consumers' interest in sustainable products is growing rapidly.
Key Cutting Fluid Market Insights Summary:
Regional Highlights:
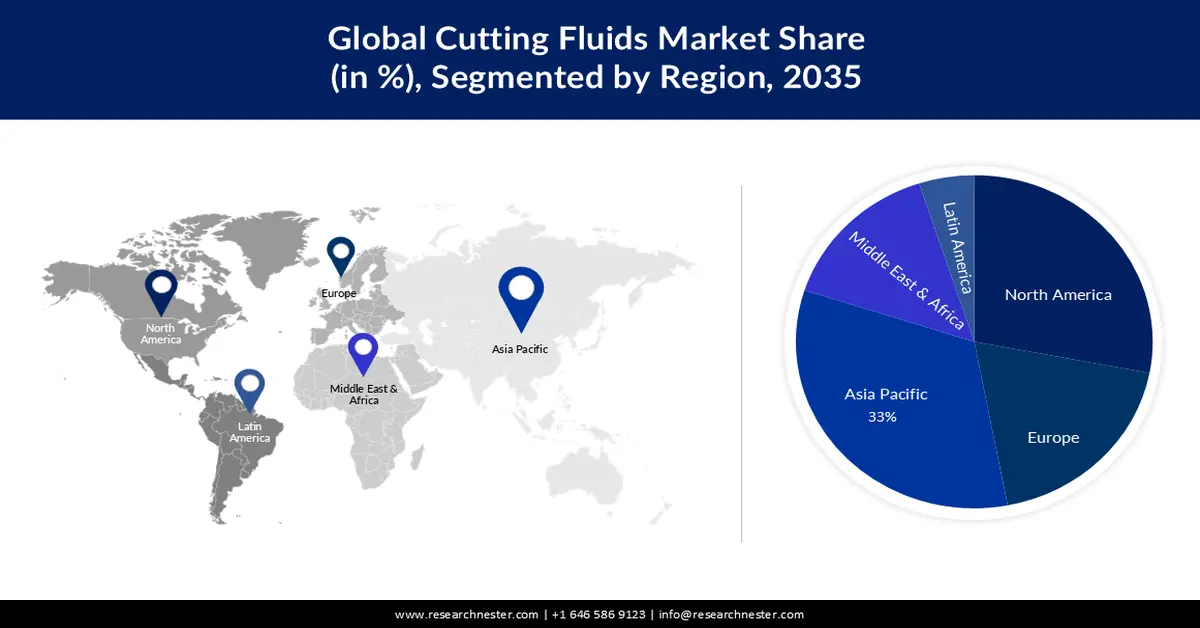
- Asia Pacific is projected to command a 33% share in the cutting fluid market by 2035, supported by accelerating industrialization and rising heavy machinery demand across major economies.
- North America is expected to witness substantial growth by 2035, spurred by advanced manufacturing capabilities and the strong reliance of heavy-duty machine production on high-performance cutting fluids.
Segment Insights:
- The bio-based segment in the cutting fluid market is anticipated to secure a significant share by 2035, propelled by stricter environmental regulations and the manufacturing sector’s shift toward sustainable lubrication solutions.
- The neat oils segment is set to record notable growth through 2026–2035, fueled by rising machining demand in automotive and aeronautics industries and increased use of high-alloy steels in large-scale manufacturing.
Key Growth Trends:
- Growing Investment in Research and Development Activities
- Growing Demand in Aerospace Sector
Major Challenges:
- Environmental Regulations
- Safety Concerns Associated are Predicted to Pose limitation on the Market Growth
Key Players: Total S.A., Indian Oil Corporation Ltd, Quaker Chemical Corporation, Fuchs Petrolub SE, Eni S.p.A., Univar Solutions Inc.
Global Cutting Fluid Market Forecast and Regional Outlook:
Market Size & Growth Projections:
- 2025 Market Size: USD 11.75 billion
- 2026 Market Size: USD 12.19 billion
- Projected Market Size: USD 17.73 billion by 2035
- Growth Forecasts: 4.2%
Key Regional Dynamics:
- Largest Region: Asia Pacific (33% Share by 2035)
- Fastest Growing Region: North America
- Dominating Countries: United States, China, Japan, Germany, United Kingdom
- Emerging Countries: India, South Korea, Brazil, Singapore, United Arab Emirates
Last updated on : 26 November, 2025
Cutting Fluid Market - Growth Drivers and Challenges
Growth Drivers
- Growing Investment in Research and Development Activities - Manufacturers want to produce different types of cutting fluids based on machine requirements and developments. Cutting fluid disposal has long been a concern, which is why manufacturers are turning to bio-based cutting fluids. Therefore, investing in research and development to meet the growing demand for cutting fluids has become a trend in the global cutting fluid market. Add to this the increasing environmental regulation of cutting fluid recycling.
- Growing Demand in Aerospace Sector - Besides automotive sector, cutting fluids are also utilized in the aerospace industry owing to their wide range of abilities such as lightweight, easy construction, chemical resistance attack and more. Additionally, integration of advanced cutting fluids such as synthetic or bio-based ones that are eco-friendly is expected to drive the growth further in the projected period. Cutting fluids help improve the efficiency of the machining process, leading to higher machine production volumes. Therefore, the demand for cutting fluids is expected to remain stable during the prediction period.
- Expansion of Oil & Gas Industry - There is increasing emphasis on improving machining performance, reducing tool wear and increasing productivity as well as health and safety, with the need for cutting fluids to cut exposure to contaminants and harmful contamination in the air. The expansion of the oil and gas industry, which requires cutting fluids for drilling and exploration activities, is expected to shape the cutting fluid market landscape.
Challenges
- Environmental Regulations – Cutting Fluids contain harmful chemicals so manufacturers are under increasing pressure to develop more environmentally friendly products. This is predicted to hamper the market growth in the forecast period.
- Safety Concerns Associated are Predicted to Pose limitation on the Market Growth
- High Cost of Cutting Fluids is Expected to Restrict the Cutting Fluid Market Growth in the Upcoming Period
Cutting Fluid Market Size and Forecast:
| Report Attribute | Details |
|---|---|
|
Base Year |
2025 |
|
Forecast Year |
2026-2035 |
|
CAGR |
4.2% |
|
Base Year Market Size (2025) |
USD 11.75 billion |
|
Forecast Year Market Size (2035) |
USD 17.73 billion |
|
Regional Scope |
|
Cutting Fluid Market Segmentation:
Source Segment Analysis
In terms of source, the bio based segment in the cutting fluid market is anticipated to hold a significant revenue share by the end of 2035. Growth can be driven by increasing concern for the environment and a need to develop more environmentally friendly solutions within the manufacturing sector. Some of the advantages, such as improved lubrication tool & equipment and increased tool life, compared to traditional petroleum oils are offered by these fluids. The regions with stringent environmental legislation and an emphasis on sustainability are forecast to be particularly attractive for the growth of the bio-based cutting fluids industry.
Product Type Segment Analysis
Cutting fluid market from the neat oil segment is anticipated to record substantial growth during the forecast period. This growth is driven by an increase in demand from the automotive, aeronautics, marine, and construction sectors. It is used in many types of machining, as well as for a variety of cutting operations. They are highly sought by the large volume manufacturing sector of emerging Asia Pacific economies, in view of their ability to provide cost-effective solutions. The utilization of high alloy steels in heavy manufacturing industries is predicted to drive the neat oil segment in the projected period.
Our in-depth analysis of the global cutting fluid market includes the following segments:
|
Product Type |
|
|
Source |
|
|
End Use |
|

Vishnu Nair
Head - Global Business DevelopmentCustomize this report to your requirements — connect with our consultant for personalized insights and options.
Cutting Fluid Market - Regional Analysis
Asia Pacific Market Insights
Asia Pacific industry is anticipated to account for largest revenue share of 33% by 2035. Asia Pacific dominates the market mainly due to growing demand from the agriculture and construction sectors. Increasing industrialization and economic development is driving the growth of heavy machinery industry in countries like China, India, Japan, etc. The heavy machinery industry includes many different sub-sectors, such as machine tools, heavy electrical equipment, cement, machinery, material handling machinery, plastic processing machinery, processing plant equipment, earthmoving, construction and mining equipment, among others. China's 14th Five-Year Plan provides an opportunity for China to promote agricultural and rural transformation, directly related to increased use of heavy machinery in agricultural and construction activities.
North America Market Insights
The cutting fluid market in the region is set to grow substantially by the end of project ted period. This is due to factors such as the presence of economically developed countries and the availability of superior technology compared to other regions. Heavy machinery manufacturing is expected to contribute significantly to the expansion of this market. Heavy-duty machine manufacturing requires forging, machining, bending and forming, along with other processes that use cutting fluids to give metal better shape. In 2021, the United States exported a significant 4,444 pieces of transportation equipment, including airplanes, helicopters, and aircraft parts.
Cutting Fluid Market Players:
- Exxon Mobil Corporation
- Company Overview
- Business Strategy
- Key Product Offerings
- Financial Performance
- Key Performance Indicators
- Risk Analysis
- Recent Development
- Regional Presence
- SWOT Analysis
- Idemtsu Kosan
- Chevron Corporation
- Total S.A.
- Indian Oil Corporation Ltd
- Quaker Chemical Corporation
- Fuchs Petrolub SE
- Eni S.p.A.
- Univar Solutions Inc.
- Castrol Limited
Recent Developments
- Univar Solutions and Milliken sign an agreement to automate the North American liquid colorants market for lubricants and metalworking fluids.
- SKF and Castrol have joined forces to facilitate access to industrial lubricant recycling. The partnership includes providing “oil as a service” by combining the SKF RecondOil solution with Castrol metalworking lubricants.
- Report ID: 5385
- Published Date: Nov 26, 2025
- Report Format: PDF, PPT
- Explore a preview of key market trends and insights
- Review sample data tables and segment breakdowns
- Experience the quality of our visual data representations
- Evaluate our report structure and research methodology
- Get a glimpse of competitive landscape analysis
- Understand how regional forecasts are presented
- Assess the depth of company profiling and benchmarking
- Preview how actionable insights can support your strategy
Explore real data and analysis
Frequently Asked Questions (FAQ)
Cutting Fluid Market Report Scope
Free Sample includes current and historical market size, growth trends, regional charts & tables, company profiles, segment-wise forecasts, and more.
Connect with our Expert


Copyright @ 2026 Research Nester. All Rights Reserved.
