Congenital Anomalies Treatment Market Outlook:
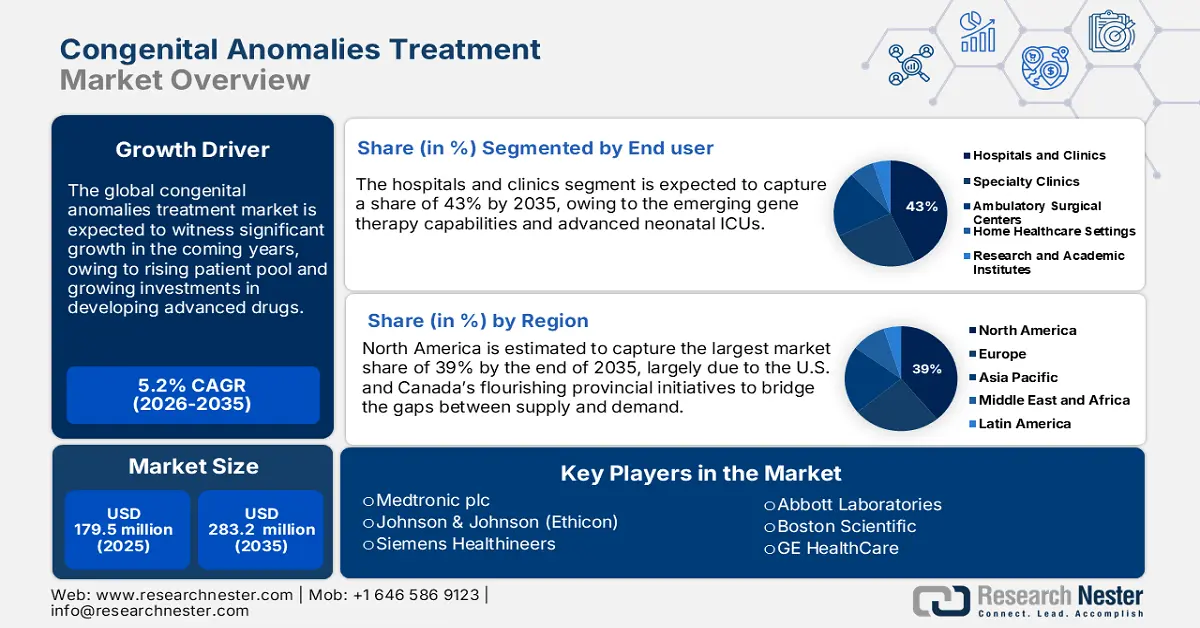
Congenital Anomalies Treatment Market size is valued at USD 179.5 million in 2025 and is projected to reach USD 283.2 million by the end of 2035, rising at a CAGR of 5.2% during the forecast period, i.e., 2026‑2035. In 2026, the industry size of congenital anomalies treatment is estimated at USD 188.8 million.
The global patient pool for the congenital anomalies treatment market is growing due to birth rates in relatively lower-income countries increasing and diagnostic facilities improving in higher-income settings. According to a report by the World Health Organization in February 2023, on average, around 240,000 newborns die within a span of 28 days due to congenital disorders, with more than 170,000 deaths occurring between 1 month and 5 years of age. This very burden has caused demand for interventions to experience upward pressure during the very early stages, particularly in prenatal screening and corrective treatments. Supply chains remain dependent on very high-precision imports of APIs, diagnostic reagents, and implantable devices, especially in developing markets.
Key components of the supply chains supporting the market consist of active pharmaceutical ingredients (API) for prenatal and postnatal diagnostics, surgical devices for corrective interventions, and specialized nutritional/therapeutic products. Furthermore, emerging trends offer proxy awareness about the producer price index (PPI) and consumer price index (CPI) as tracked by the U.S. Bureau of Labor Statistics (BLS). As per a report by the U.S. Bureau of Labor Statistics (BLS) in September 2025, in May 2025, the producer price index for surgical and medical instruments was at 157.8. The upward trend directly determines the structure of costs for the market and the downstream pricing strategies and investment decisions.
PPI Commodity Indexes in Healthcare and Their Relative Importance as of December 2022
|
Index title |
Relative Importance in Final Demand, December 2022 (%) |
Relative Importance in Health Care Services, December 2022 (%) |
|
Health care services |
16.6 |
100.0 |
|
Outpatient care |
10.6 |
63.6 |
|
Physician care |
4.0 |
23.7 |
|
Medical laboratory and diagnostic imaging center care |
0.3 |
2.4 |
|
Home health and hospice care |
0.9 |
5.3 |
|
Hospital outpatient care |
4.3 |
25.4 |
|
Dental Care |
1.1 |
6.7 |
|
Inpatient Care |
6.0 |
35.8 |
|
Hospital inpatient care |
4.5 |
26.9 |
|
Nursing home care |
1.2 |
7.3 |
|
Intellectual and developmental disability center care |
0.3 |
1.5 |
|
Sales of blood and blood products, organs, and tissues |
0.1 |
0.6 |
Source: U.S. BLS
Key Congenital Anomalies Treatment Market Insights Summary:
Regional Highlights:
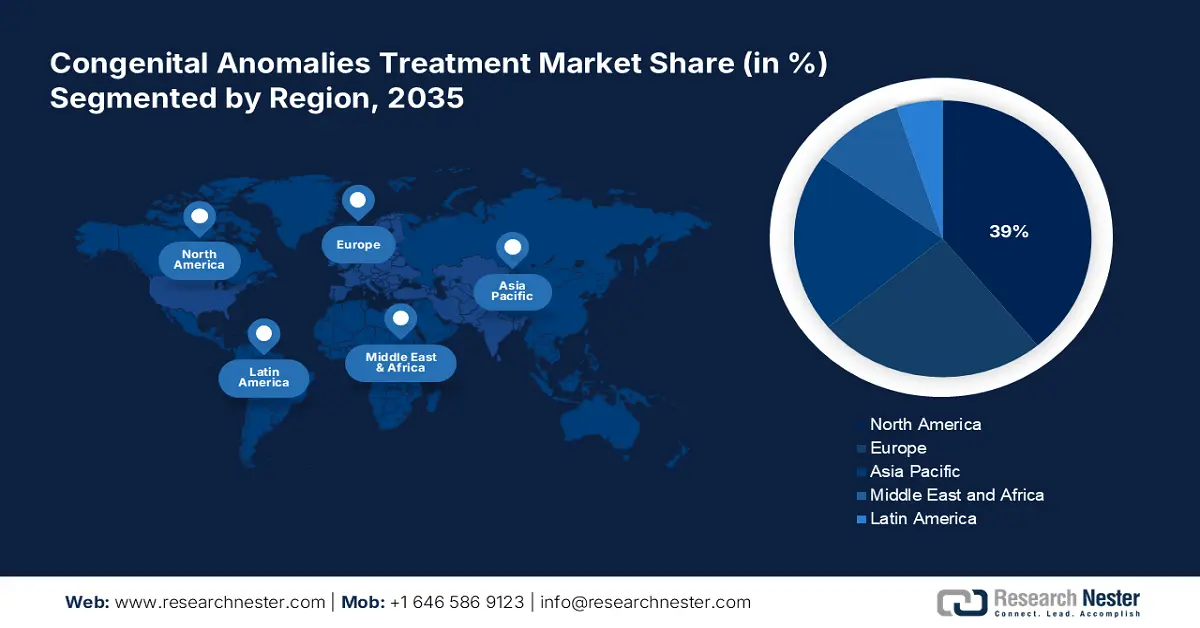
- The North America congenital anomalies treatment market is projected to hold a 39% share by 2035, supported by robust healthcare spending, provincial initiatives, and the presence of leading pharmaceutical and biotech companies.
- The Asia Pacific market is anticipated to be the fastest-growing region by 2035, driven by rising healthcare investments, technological advancements, and increasing neonatal and congenital disease incidences.
Segment Insights:
- The hospitals and clinics segment in the end-user category of the congenital anomalies treatment market is projected to dominate with a 43% share by 2035, driven by centralized expertise, advanced neonatal ICUs, and emerging gene therapy capabilities.
- The surgical intervention subsegment within the type of treatment segment is expected to hold the highest market share by 2035, fueled by the critical role of precise cardiac procedures in mitigating congenital anomalies and improving pediatric patient outcomes.
Key Growth Trends:
- Government spending on healthcare & advancements in healthcare quality improvement
- Unmet needs in emerging markets & company innovations
Major Challenges:
- Stringent Regulatory Approvals
- Limited awareness and early diagnosis
Key Players: Medtronic plc, Johnson & Johnson (Ethicon), Siemens Healthineers, Abbott Laboratories, Boston Scientific, GE HealthCare, F. Hoffmann‑La Roche Ltd., Terumo Corporation, B. Braun Melsungen AG, Dr. Reddy’s Laboratories, Samsung Medison, CSL Limited (CSL Behring), Sanofi S.A., Baxter International Inc., Duopharma Biotech Berhad
Global Congenital Anomalies Treatment Market Forecast and Regional Outlook:
Market Size & Growth Projections:
- 2025 Market Size: USD 179.5 million
- 2026 Market Size: USD 188.8 million
- Projected Market Size: USD 283.2 million by 2035
- Growth Forecasts: 5.2% CAGR (2026-2035)
Key Regional Dynamics:
- Largest Region: North America (39% Share by 2035)
- Fastest Growing Region: Asia Pacific
- Dominating Countries: United States, Germany, Japan, Canada, United Kingdom
- Emerging Countries: India, China, South Korea, Australia, France
Last updated on : 6 October, 2025
Congenital Anomalies Treatment Market - Growth Drivers and Challenges
Growth Drivers
- Government spending on healthcare & advancements in healthcare quality improvement: Governments are keen on expanding their healthcare budgets to mitigate rising cases in the congenital anomaly treatment market. As per a report by the World Health Organization in December 2023, there was a new high level of spending on health at USD 9.8 trillion or 10.3% of worldwide gross domestic product (GDP) in the previous 4 years. Moreover, Low-income countries shared 0.24% of the global health spending, even though they had an 8% population share of the world. The increasing financial investment is anticipated to be the driver for significant growth in the market, with growing funds to be the fuel for advancements in diagnostics, therapeutics, and surgery across the world.
- Unmet needs in emerging markets & company innovations: The gap between the demand for healthcare services and the available supply creates important opportunities for both established companies and new businesses to grow in the congenital anomalies treatment market. Among emerging technologies, telemedicine has taken center stage as it has significantly enhanced consultation processes. As per a report by NLM in October 2023, this innovation becomes much more critical considering nearly 50% of birth defects remain without any well-defined etiology, making diagnosis and timely intervention difficult. However, the known etiologic factors are parental chromosomal abnormalities (2 to 4%), anatomical and endocrine conditions (10 to 27%), and antiphospholipid antibody syndrome (17 to 20%), requiring the initial input of a specialist, oftentimes difficult to obtain in low-resource settings.
- Rising Prevalence of Birth Defects and Improved Regional Reporting Systems: For the market, an increasing number of reported congenital anomalies accounts significantly toward the growth of the market. As per a report by the World Health Organization in 2025, births were recorded in over 150 hospitals 2025 across the region, with more than 3,000 cases of birth defects recorded. Therefore, growing awareness about congenital anomalies and reporting them highlights the magnitude of the problem and the need for early diagnosis, intervention, and specialized treatment. Better healthcare infrastructure and stronger birth defect surveillance systems lead to better opportunities for early detection and improved management of congenital anomalies. As awareness grows amongst the medical professionals and parents, the demand for surgical interventions, therapeutic devices, and ongoing medical care will also grow.
Risk of Major Congenital Malformations Associated with Select Drugs (2025)
|
Drug |
(Livebirths/MCM %) (major congenital malformations) |
Adjusted OR |
Adjusted OR |
|
Butylscopolamine |
72/6 (8.3%) |
2.92 (1.26-6.79) |
1.79 (0.61-5.25) |
|
Budesonide |
89/10 (11.2%) |
3.35 (1.68-6.69) |
2.38 (0.82-6.92) |
|
Liraglutide |
55/8 (14.5%) |
3.52 (1.59-7.82) |
0.74 (0.20-2.70) |
|
Insulin glargine |
460/45 (9.8%) |
2.71 (1.98-3.72) |
0.93 (0.39-2.24) |
|
Insulin (human) |
601/49 (8.2%) |
2.59 (1.91-3.51) |
0.61 (0.29-1.31) |
|
Insulin (human) |
1069/86 (8.0%) |
2.53 (2.01-3.17) |
0.81 (0.44-1.50) |
|
Insulin aspart |
1495/125 (8.4%) |
2.43 (2.01-2.93) |
1.34 (0.52-3.46) |
|
Insulin detemir |
473/35 (7.4) |
2.12 (1.48-3.02) |
1.09 (0.46-2.62) |
Source: NLM
Challenges
- Stringent Regulatory Approvals: The market growth and adoption are largely hindered by the rigorous approval and regulatory norms before drug and product launch in the congenital anomalies treatment market. The high cost of research, development & deployment has led to high CapEx requirements. Clinical trials, followed by strict approvals, are cost-intensive, making it a challenge for smaller players to gain a competitive edge. Furthermore, the approval process's time span being long can hold up the introduction of innovative treatments and affect market dynamism. The regulatory complexities lead to further costs for the end consumer, limiting accessibility and adoption in emerging markets.
- Limited awareness and early diagnosis: The market is constrained due to a lack of general awareness about congenital defects among parents and, in some instances, even among healthcare providers, especially in a few resourcefully constrained settings. This often results in delayed diagnosis and treatment, thus decreasing intervention efficacy. In addition, poor access to more advanced diagnostic techniques and specialized medical establishments in rural or backward areas renders early detection and timely intervention impossible, thereby inhibiting market expansion and better patient outcomes.
Congenital Anomalies Treatment Market Size and Forecast:
| Report Attribute | Details |
|---|---|
|
Base Year |
2025 |
|
Forecast Year |
2026-2035 |
|
CAGR |
5.2% |
|
Base Year Market Size (2025) |
USD 179.5 million |
|
Forecast Year Market Size (2035) |
USD 283.2 million |
|
Regional Scope |
|
Congenital Anomalies Treatment Market Segmentation:
End user Segment Analysis
The hospitals and clinics segment in the end user segment in the congenital anomalies treatment market is likely to dominate the market with a share of 43% in the forecast period. The growth is ascribed to the centralization of congenital anomaly expertise, emerging gene therapy capabilities, and advanced neonatal ICUs. As per a report by CMS in June 2025, the expenditures for physicians and clinical services rose by 7.4% to USD 978 billion, having registered only 4.6% GDP in 2022. The surge in expenditures is resulting in enhanced demand for specialized pediatric and surgical services in hospital settings. Furthermore, with the assurance of multidisciplinary care teams in hospitals for the integrated management of complex congenital conditions, treatment outcomes get better, thereby supporting the market growth of the market.
Type of Treatment Segment Analysis
The surgical intervention subsegment is expected to hold the highest market share in the type of treatment segment within the forecast period in the congenital anomalies treatment market. Procedures such as atrial septal defects and Tetralogy of Fallot are vital in mitigating congenital anomalies due to the high global birth incidence. In such complex cardiac procedures, the cannulation strategy needs to be carefully planned ahead of the case, with proper device selection. As per a report by NLM in November 2023, central cannulation (aortic/bicaval) is mostly preferred for cases weighing under 30 kg, a hybrid strategy is adopted for patients between 30 and 50 kg, and complete peripheral cannulation is generally used in cases exceeding 50 kg. This differentiated approach especially increases operative precision and patient safety in pediatric cardiac surgeries.
Diagnostic Method Segment Analysis
The prenatal screening sub-segment is expected to hold the highest market share in the diagnostic method segment within the forecast period in the congenital anomalies treatment market. Growing awareness about early detection, increasing adoption of non-invasive prenatal testing (NIPT), and improvements in ultrasound technology, along with genetic testing, are driving this growth. There exist maternal health programs by the government's initiative on one hand, and key guidelines for routine prenatal care in both developed and emerging economies supporting this trend on the other. The early diagnosis achieved with prenatal screening promotes timely medical planning and intervention with significant improvement in neonatal outcomes.
Our in-depth analysis of the global market includes the following segments:
|
Segment |
Subsegments |
|
Type of Treatment |
|
|
Therapy Type |
|
|
End user |
|
|
Diagnostic Method |
|
|
Product Type |
|

Vishnu Nair
Head - Global Business DevelopmentCustomize this report to your requirements — connect with our consultant for personalized insights and options.
Congenital Anomalies Treatment Market - Regional Analysis
North America Market Insights
North America market is expected to hold the highest market share of 39% by the end of 2035, largely due to the U.S. and Canada’s flourishing provincial initiatives to bridge the gaps between supply and demand. According to a report by CMS in December 2024, U.S. health care spending grew by 7.5% in 2023, reaching USD 4.9 trillion or USD 14,570 per capita. Health care expenditures thus amounted to 17.6 percent of the gross national product. This increase has witnessed thousands of patients gaining medical accessibility every year. The presence of renowned pharmaceutical and biotech companies also accelerated the development of modern therapies and diagnostics for congenital disorders.
The congenital anomalies treatment market in the U.S. is growing due to increasing healthcare investments and expanding access to specialist medical services. As per a report by CMS in June 2025, prescription drug spending rose by 11.4% in 2023, thus reaching approximately USD 449.7 billion. This growth rate exceeds the 7.8% increase recorded in 2022 and is due to increased utilization of advanced therapies. This increased pharmaceutical expenditure is directly contributing to the marketplace for novel treatments aimed at congenital disorders. Further entry points in this regard are being provided by the government support programs for rare diseases and interventions into the earliest stages in creating a viable ecosystem for diagnosing and treating congenital anomalies.
The congenital anomalies treatment market in Canada is growing due to increased government financing for health infrastructures and initiatives for better maternal and child health outcomes. According to a report by the World Health Organization in 2025, life expectancy at birth in Canada has improved by 2.4 years, from 79.1 to 81.6, reflecting improvements in early diagnosis and effective treatment of various illnesses, including congenital anomalies. This improvement brings on positive changes with improved healthcare services and further supports the need for newer treatments targeting congenital anomalies. With increasing awareness among healthcare professionals and parents regarding early intervention options, there is consequently a large demand for such specialized treatment all over the country.
Prevalence of Selected Congenital Anomalies (per 10,000 births) (2023)
|
Anomaly Type |
Rate (per 10,000) |
Trend |
|
Neural tube defects |
4.8 |
Stable |
|
Genital anomalies |
68.0 |
Stable |
|
Congenital heart defects |
20.8 |
Stable |
|
Limb deficiency defects |
4.0 |
Stable |
|
Oro-facial clefts |
15.8 |
Stable |
|
Diaphragmatic hernia |
3.1 |
Stable |
|
Abdominal wall defects |
5.8 |
Decreasing |
|
Gastrointestinal defects |
14.2 |
Stable |
|
Chromosomal defects |
18.0 |
Stable |
|
CNS defects |
5.3 |
Decreasing |
|
Urinary tract defects |
13.8 |
Increasing |
|
Sense organ defects |
4.9 |
Stable |
Source: Government of Canada
Asia Pacific Market Insights
The congenital anomalies treatment market in the Asia Pacific is anticipated to capture the fastest-growing market by the end of 2035 due to increasing healthcare and pharmaceutical investments, technological advancements, and rising disease occurrence. According to a report by OECD in November 2022, average neonatal mortality in the lower-middle and lower-income economy nations in the region still stands high at 15.8 deaths per 1,000 live births. These points point toward the beauty challenges that indicate the urgent need for basic and advanced healthcare treatments and infrastructure. With most countries creating and expanding prenatal screening programs, fair optimism exists regarding an upward growth trajectory of this market, which is further promoted through investments in modern medical equipment.
The congenital anomalies treatment market in India is projected to register the fastest growth rate during the forecast period. This is primarily driven by supportive government policies and initiatives. As per a report by Invest India in May 2025, the medical devices sector size in India is expected to be around USD 14 billion, and is expected to increase to USD 30 billion by 2030. India has the fourth-largest medical device market in Asia after Japan, China, and South Korea, and one of the world's top 20 medical device markets. After that, the expanding consciousness of congenital disorders and infrastructural growth for healthcare in urban and rural settings keep up the demand for modern treatment modalities throughout the country.
The congenital anomalies treatment market in China is increasing due to growing government support for healthcare innovation, rising birth defect awareness, and expanding access to specialized medical care. As per a report by NLM in April 2023, the Center for Drug Evaluation (CDE) published and disseminated over 100 consultation drafts for drug R&D guidelines in 2022, marking the ramp-up in China for fast-tracking development and approval of innovative therapies, some of which are for rare or congenital disorders. The wave of regulations, in addition to the great investments made into pediatric healthcare and prenatal diagnostics, is ushering in higher rates of early detection and treatment for congenital anomalies across the country.
Europe Market Insights
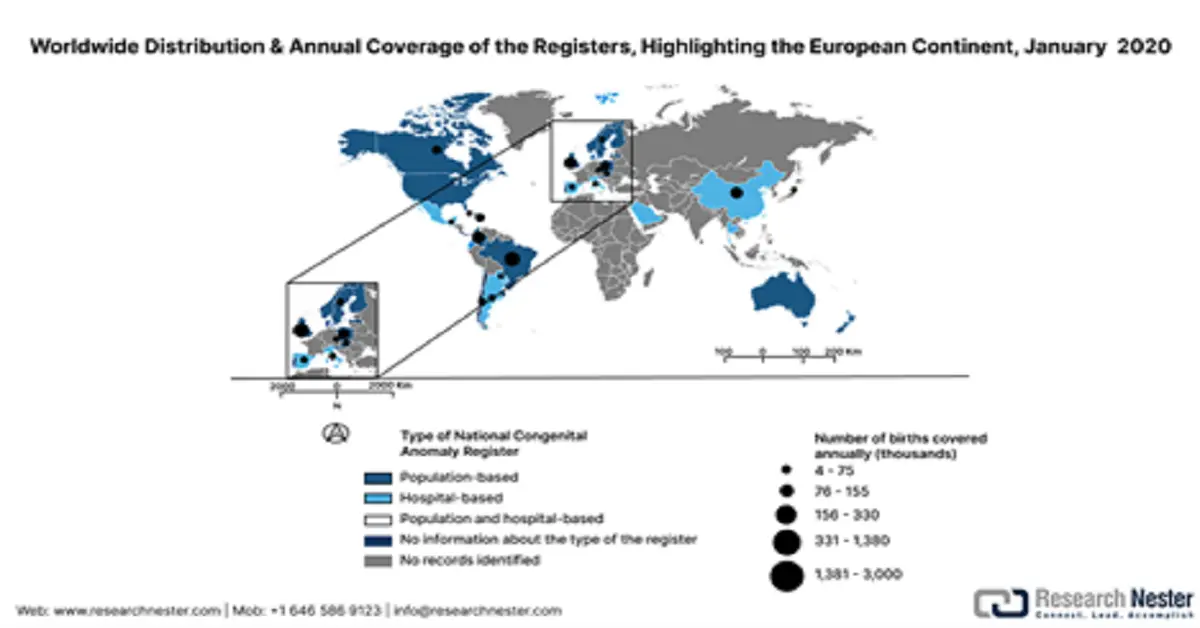
The market in Europe is experiencing steady growth, advanced healthcare, and regulatory systems, in addition to higher investments in medical technologies. However, as per a report by OECD in December 2022, screening rates for breast cancer and cervical cancer dropped by 6%, on average, across the countries, signifying gaps in preventive care services. Besides, the document below summarizes the characteristics of the overall region's 14 congenital anomaly registers, along with national coverage that has been extracted from the National Congenital Anomaly Registers dataset. It includes coding systems, surveillance practices, pregnancy outcomes, and registry details, which are aligned with EUROCAT and ICBDSR standards.
European Congenital Anomalies Registers with National Coverage, January 10, 2020
|
Country |
Registry Name |
Year Created |
Type |
Network |
Births (thousands, % coverage) |
Compulsory |
Time Limit |
Anomaly Type |
Coding |
Pregnancy Outcomes |
Surveillance |
|
Czech Republic |
National Registry of Congenital Anomalies (NRCA) |
1964 |
Population |
ICBDSR, EUROCAT |
110 (100%) |
Yes |
15 years |
– |
ICD |
Live birth, Stillborn, TOPFA |
Yes |
|
Denmark |
Danish Medical Birth Registry |
1973 |
Population |
– |
– |
– |
1 year |
– |
ICD |
Live birth, Stillborn, TOPFA |
– |
|
England |
NCARDRS |
2015 |
Population |
BINOCAR, ICBDSR |
610 (100%) |
No |
– |
Major, minor |
ICD |
Live birth, Stillborn, TOPFA |
– |
|
Finland |
Register of Congenital Malformations |
1963 |
Population |
ICBDSR, EUROCAT |
60 (100%) |
Yes |
1 year |
Major |
ICD |
Live birth, Stillborn, TOPFA |
Yes |
|
Hungary |
Hungarian Congenital Abnormality Registry (HCAR) |
1962 |
Population |
ICBDSR, EUROCAT |
100 (100%) |
Yes |
1 year |
Major, minor |
ICD (modified) |
Live birth, Stillborn, TOPFA |
– |
|
Latvia |
Register of Patients Suffering from Certain Diseases |
1987 |
Population |
EUROCAT |
19.2 (100%) |
Yes |
18 years |
– |
– |
Live birth, Stillborn, TOPFA |
– |
|
Malta |
Malta Congenital Anomalies Register (MCAR) |
1985 |
Population |
ICBDSR, EUROCAT |
4 (100%) |
No |
1 year |
Major, minor |
ICD |
Live birth, Stillborn |
– |
|
Norway |
Medical Birth Registry of Norway (MBRN) |
1967 |
Population |
ICBDSR, EUROCAT |
60 (100%) |
Yes |
1 year |
– |
ICD-BPA |
Live birth, Stillborn, TOPFA |
Yes |
|
Poland |
Polish Registry of Congenital Malformations (PRCM) |
1997 |
Population |
EUROCAT |
300 (85%) |
Yes |
2 years |
Major, minor |
ICD |
Live birth, Stillborn, TOPFA |
Yes |
|
Portugal |
Portuguese National Registry of Congenital Anomalies (RENAC) |
1995 |
Population |
EUROCAT |
– |
No |
Neonatal period |
Major |
ICD |
Live birth, Stillborn, TOPFA |
Yes |
|
Scotland |
Scottish Linked Routine Data Congenital Anomaly Register |
2018 |
Population |
EUROCAT |
50-55 (100%) |
Hybrid |
1 year |
Major |
ICD |
Live birth, Stillborn, TOPFA |
– |
|
Slovakia |
Teratologic Information Centre, Slovak Medical University |
1964 |
Population |
ICBDSR |
55 (100%) |
Yes |
Hospital-based |
– |
– |
Live birth, Stillborn, TOPFA |
– |
|
Sweden |
Swedish Medical Birth Registry (MBR) |
1964 |
Population |
ICBDSR, EUROCAT |
100-120 (100%) |
Yes |
1 year |
– |
ICD |
Live birth, Stillborn, TOPFA |
Yes |
|
Wales |
Congenital Anomaly Register & Information Service for Wales (CARIS) |
1998 |
Population |
BINOCAR, ICBDSR, EUROCAT |
35 (100%) |
No |
1 year |
Major, minor |
ICD |
Live birth, Stillborn, TOPFA |
– |
Source: Scielosp, January 2020
The congenital anomalies treatment market in the UK is expected to grow due to the advancements in early diagnostics, pediatric care, and surgical innovations. According to a report by ONS in May 2024, in 2023, the entire healthcare expenditure grew by 5.6% in nominal terms, showing that economic pressures impacted the spending from a real-term perspective. The UK continues to direct investment towards critical health services, including terms such as maternal and neonatal health. Increasing weightage on genetic screening programs and NHS initiatives for early detection, intervention, and treatment of congenital disorders will contribute toward maintaining the demand for advanced treatment solutions in the coming years.
The market in Germany is expected to grow due to strong government initiatives to improve maternal and child health, along with ongoing R&D investments. As per a report by the World Health Organization in 2024, in 2022, Germany spent about 12.7% of its GDP on health. The government promotes early diagnosis through prenatal screening programs carried out nationwide, and there are regulations to support access to specialized pediatric care. In addition, the strong R&D landscape provides ample opportunities for public and private companies to innovate gene therapy, regenerative medicine, and advanced surgical techniques, thereby carving out enhanced treatment modalities for congenital anomalies.
Target Diseases of Neonatal Screening in Germany, Their Prevalence, and Their Year of Inclusion in The National Screening Program (2022)
|
Disease |
Classification |
Prevalence |
|
Very-long-chain-acyl-CoA-dehydrogenase deficiency (VLCAD) |
Fatty acid oxidation disorder, a metabolic disease |
1:75 562 |
|
Medium-chain acyl-CoA-dehydrogenase deficiency (MCAD) |
Fatty acid oxidation disorder, a metabolic disease |
1:10 086 |
|
Long-chain-3-OH-acyl-CoA-dehydrogenase deficiency (LCHAD) |
Fatty acid oxidation disorder, a metabolic disease |
1:141 824 |
|
Carnitine palmitoyl transferase 1 deficiency (CPT-1) |
Carnitine cycle defect, metabolic disease |
1:576 159 |
|
Carnitine palmitoyl transferase 2 deficiency (CPT-2) |
Carnitine cycle defect, metabolic disease |
|
|
Carnitine acylcarnitine translocase ‧deficiency (CACT) |
Carnitine cycle defect, metabolic disease |
|
|
Phenylketonuria (PKU) and hyperphenylalaninemia (HPA) |
Amino acid metabolism disorder, metabolic disease |
1:5 262 |
|
Maple syrup urine disease (MSUD) |
Amino acid metabolism disorder, metabolic disease |
1:170 714 |
|
Tyrosinemia type 1 |
Amino acid metabolism disorder, metabolic disease |
1:135 000*2 |
|
Glutaraciduria type 1 (GA1) |
Metabolic disease, organoacidopathy |
1:139 675 |
|
Isovaleric acidemia (IVA) |
Metabolic disease, organoacidopathy |
1:89 500 |
|
Biotinidase deficiency |
Metabolic disease |
1:28 365 |
|
Galactosemia |
Carbohydrate metabolism disorder, metabolic disease |
1:76 821 |
|
Primary hypothyroidism |
Endocrinopathy |
1:3 338 |
|
Adrenogenital syndrome (AGS) |
Endocrinopathy |
1:14 917 |
|
Cystic fibrosis (CF) |
Lung disease |
1:5 400*1 |
|
Severe combined immunodeficiency (SCID) |
Immune disease |
1:32 500*2 |
|
5q-associated spinal muscular atrophy (SMA) |
Muscular disease |
|
|
Sickle cell disease (SCD) |
Hematological disease |
|
|
Total |
1:1 333 |
Source: NIH
Key Congenital Anomalies Treatment Market Players:
- Medtronic plc
- Company Overview
- Business Strategy
- Key Product Offerings
- Financial Performance
- Key Performance Indicators
- Risk Analysis
- Recent Development
- Regional Presence
- SWOT Analysis
- Johnson & Johnson (Ethicon)
- Siemens Healthineers
- Abbott Laboratories
- Boston Scientific
- GE HealthCare
- F. Hoffmann‑La Roche Ltd.
- Terumo Corporation
- B. Braun Melsungen AG
- Dr. Reddy’s Laboratories
- Samsung Medison
- CSL Limited (CSL Behring)
- Sanofi S.A.
- Baxter International Inc.
- Duopharma Biotech Berhad
The congenital anomalies treatment market is highly competitive as the major global healthcare companies are on a flight for strategic initiatives to dent one another's market share. Some key players competing in the global congenital anomalies treatments market include Medtronic plc, Johnson & Johnson (Ethicon), Siemens Healthineers, Abbott Laboratories, and Boston Scientific. Through mergers and acquisitions, these companies seek to diversify their product lines and enhance their capabilities in the treatment of complex congenital abnormalities. Research, development, and deployment (RD&D) constitute the main thrust in this field, with enhanced investments being made in terms of advanced surgical tools, prenatal diagnostics, gene therapies, and minimally invasive procedures.
Here is a list of key players operating in the global market:
Recent Developments
- In December 2024, the U.S. FDA approved Crenessity (crinecerfont) in combination with glucocorticoids (steroids) to treat pediatric patients 4 years of age and older suffering from classic congenital adrenal hyperplasia.
- In November 2024, PTC Therapeutics received FDA approval for AADC Deficiency Gene Therapy. This is the first-ever U.S.-based approved drug that is directly administered to the brain. This revolutionary drug is designed to address both children and adult age groups.
- Report ID: 2702
- Published Date: Oct 06, 2025
- Report Format: PDF, PPT
- Explore a preview of key market trends and insights
- Review sample data tables and segment breakdowns
- Experience the quality of our visual data representations
- Evaluate our report structure and research methodology
- Get a glimpse of competitive landscape analysis
- Understand how regional forecasts are presented
- Assess the depth of company profiling and benchmarking
- Preview how actionable insights can support your strategy
Explore real data and analysis
Frequently Asked Questions (FAQ)
About this Report
Connect with our Expert

Report, 2026-2035


Copyright @ 2026 Research Nester. All Rights Reserved.
