Global Ammonia Gas and Ammonia Water Market
- An Outline of the Global Ammonia Gas and Ammonia Water Market
- Market Definition
- Market Segmentation
- Assumptions and Abbreviations
- Research Methodology & Approach
- Primary Research
- Secondary Research
- Data Triangulation
- SPSS Methodology
- Executive Summary
- Growth Drivers
- Major Roadblocks
- Opportunities
- Prevalent Trends
- Government Regulation
- Ongoing Advancements
- Growth Outlook
- Risk
- Pricing Benchmarking
- SWOT
- Regional Demand
- End-User Segment Analysis of the Global Micro-LED Market
- Growth Potential for End-User of Ammonia Gas and Ammonia Water Market
- Root Cause Analysis (RCA) for discovering problems of the Ammonia Gas and Ammonia Water Market
- Porter Five Forces
- PESTLE
- Comparative Positioning
- Competitive Landscape: Key Players
- Competitive Model
- Market Share of Company, 2024
- Company Profile
- CF Industries Holdings, Inc.
- Yara International ASA
- Nutrien Ltd.
- BASF SE
- OCI N.V.
- SABIC
- Koch Fertilizer, LLC
- Qatar Fertiliser Company (QAFCO)
- PJSC Togliattiazot
- EuroChem Group
- IFFCO (Indian Farmers Fertiliser Cooperative)
- Sumitomo Chemical Co., Ltd.
- CSBP Limited
- Lotte Chemical Corporation
- PETRONAS Chemicals Group Berhad
- Global Ammonia Gas and Ammonia Water Market Outlook
- Market Overview
- Market Revenue by Value (USD Million), Volume (Thousand Tons), and Compound Annual Growth Rate (CAGR)
- Year-on-Year (Y-o-Y) Growth Trend Analysis
- Global Ammonia Gas and Ammonia Water Market Segmentation Analysis (2025-2038)
- By Type
- Ammonia Gas (Anhydrous)
- Ammonia Water (Aqueous)
- By Ammonia Gas (Anhydrous) Application
- Fertilizers
- Industrial Synthesis
- Refrigeration
- Power Generation
- Metal Treatment
- NOx Reduction
- Others
- By Ammonia Water (Aqueous) Application
- Water Treatment
- Cleaning & Disinfection
- Rubber & Plastics
- Textile Manufacturing
- Food Processing
- Laboratory Use
- Others
- By Region
- North America, Market Value (USD Million), Volume (Thousand Tons), and CAGR, 2025-2037F
- Europe, Market Value (USD Million), Volume (Thousand Tons), and CAGR, 2025-2037F
- Asia Pacific excluding Japan, Market Value (USD Million), Volume (Thousand Tons), and CAGR, 2025-2037F
- Japan, Market Value (USD Million), Volume (Thousand Tons), and CAGR, 2025-2037F
- Latin America, Market Value (USD Million), Volume (Thousand Tons), and CAGR, 2025-2037F
- Middle East and Africa, Market Value (USD Million), Volume (Thousand Tons), and CAGR, 2025-2037F
- By Type
- North America Ammonia Gas and Ammonia Water Market Outlook
- Market Overview
- Market Revenue by Value (USD Million), Volume (Thousand Tons), and Compound Annual Growth Rate (CAGR)
- Year-on-Year (Y-o-Y) Growth Trend Analysis
- North America Ammonia Gas and Ammonia Water Market Segmentation Analysis (2025-2038)
- By Type
- Ammonia Gas (Anhydrous)
- Ammonia Water (Aqueous)
- By Ammonia Gas (Anhydrous) Application
- Fertilizers
- Industrial Synthesis
- Refrigeration
- Power Generation
- Metal Treatment
- NOx Reduction
- Others
- By Ammonia Water (Aqueous) Application
- Water Treatment
- Cleaning & Disinfection
- Rubber & Plastics
- Textile Manufacturing
- Food Processing
- Laboratory Use
- Others
- By Country
- U.S., Market Value (USD Million), Volume (Thousand Tons), and CAGR, 2025-2037F
- Canada, Market Value (USD Million), Volume (Thousand Tons), and CAGR, 2025-2037F
- By Type
- Europe Ammonia Gas and Ammonia Water Market Outlook
- Market Overview
- Market Revenue by Value (USD Million), Volume (Thousand Tons), and Compound Annual Growth Rate (CAGR)
- Year-on-Year (Y-o-Y) Growth Trend Analysis
- Europe Ammonia Gas and Ammonia Water Market Segmentation Analysis (2025-2038)
- By Type
- Ammonia Gas (Anhydrous)
- Ammonia Water (Aqueous)
- By Ammonia Gas (Anhydrous) Application
- Fertilizers
- Industrial Synthesis
- Refrigeration
- Power Generation
- Metal Treatment
- NOx Reduction
- Others
- By Ammonia Water (Aqueous) Application
- Water Treatment
- Cleaning & Disinfection
- Rubber & Plastics
- Textile Manufacturing
- Food Processing
- Laboratory Use
- Others
- By Country
- UK, Market Value (USD Million), Volume (Thousand Tons), and CAGR, 2025-2037F
- Germany, Market Value (USD Million), Volume (Thousand Tons), and CAGR, 2025-2037F
- France, Market Value (USD Million), Volume (Thousand Tons), and CAGR, 2025-2037F
- Italy, Market Value (USD Million), Volume (Thousand Tons), and CAGR, 2025-2037F
- Spain, Market Value (USD Million), Volume (Thousand Tons), and CAGR, 2025-2037F
- BENELUX, Market Value (USD Million), Volume (Thousand Tons), and CAGR, 2025-2037F
- Poland, Market Value (USD Million), Volume (Thousand Tons), and CAGR, 2025-2037F
- Russia, Market Value (USD Million), Volume (Thousand Tons), and CAGR, 2025-2037F
- Rest of Europe, Market Value (USD Million), Volume (Thousand Tons), and CAGR, 2025-2037F
- By Type
- Asia Pacific Excluding Japan Ammonia Gas and Ammonia Water Market Outlook
- Market Revenue by Value (USD Million), Volume (Thousand Tons), and Compound Annual Growth Rate (CAGR)
- Year-on-Year (Y-o-Y) Growth Trend Analysis
- Asia Pacific excluding Japan Ammonia Gas and Ammonia Water Market Segmentation Analysis (2025-2038)
- Ammonia Gas and Ammonia Water Market Segmentation Analysis (2025-2038)
- By Type
- Ammonia Gas (Anhydrous)
- Ammonia Water (Aqueous)
- By Ammonia Gas (Anhydrous) Application
- Fertilizers
- Industrial Synthesis
- Refrigeration
- Power Generation
- Metal Treatment
- NOx Reduction
- Others
- By Ammonia Water (Aqueous) Application
- Water Treatment
- Cleaning & Disinfection
- Rubber & Plastics
- Textile Manufacturing
- Food Processing
- Laboratory Use
- Others
- By Country
- China, Market Value (USD Million), Volume (Thousand Tons), and CAGR, 2025-2037F
- India, Market Value (USD Million), Volume (Thousand Tons), and CAGR, 2025-2037F
- Indonesia, Market Value (USD Million), Volume (Thousand Tons), and CAGR, 2025-2037F
- South Korea, Market Value (USD Million), Volume (Thousand Tons), and CAGR, 2025-2037F
- Malaysia, Market Value (USD Million), Volume (Thousand Tons), and CAGR, 2025-2037F
- Australia, Market Value (USD Million), Volume (Thousand Tons), and CAGR, 2025-2037F
- Singapore, Market Value (USD Million), Volume (Thousand Tons), and CAGR, 2025-2037F
- Vietnam, Market Value (USD Million), Volume (Thousand Tons), and CAGR, 2025-2037F
- New Zealand, Market Value (USD Million), Volume (Thousand Tons), and CAGR, 2025-2037F
- Rest of APEJ, Market Value (USD Million), Volume (Thousand Tons), and CAGR, 2025-2037F
- By Type
- Japan Ammonia Gas and Ammonia Water Market Outlook
- Market Overview
- Market Revenue by Value (USD Million), Volume (Thousand Tons), and Compound Annual Growth Rate (CAGR)
- Year-on-Year (Y-o-Y) Growth Trend Analysis
- Japan Ammonia Gas and Ammonia Water Market Segmentation Analysis (2025-2038)
- By Type
- Ammonia Gas (Anhydrous)
- Ammonia Water (Aqueous)
- By Ammonia Gas (Anhydrous) Application
- Fertilizers
- Industrial Synthesis
- Refrigeration
- Power Generation
- Metal Treatment
- NOx Reduction
- Others
- By Ammonia Water (Aqueous) Application
- Water Treatment
- Cleaning & Disinfection
- Rubber & Plastics
- Textile Manufacturing
- Food Processing
- Laboratory Use
- Others
- By Type
- Latin America Ammonia Gas and Ammonia Water Market Outlook
- Market Overview
- Market Revenue by Value (USD Million), Volume (Thousand Tons), and Compound Annual Growth Rate (CAGR)
- Year-on-Year (Y-o-Y) Growth Trend Analysis
- Latin America Ammonia Gas and Ammonia Water Market Segmentation Analysis (2025-2038)
- By Type
- Ammonia Gas (Anhydrous)
- Ammonia Water (Aqueous)
- By Ammonia Gas (Anhydrous) Application
- Fertilizers
- Industrial Synthesis
- Refrigeration
- Power Generation
- Metal Treatment
- NOx Reduction
- Others
- By Ammonia Water (Aqueous) Application
- Water Treatment
- Cleaning & Disinfection
- Rubber & Plastics
- Textile Manufacturing
- Food Processing
- Laboratory Use
- Others
- By Country
- Brazil, Market Value (USD Million), Volume (Thousand Tons), and CAGR, 2025-2037F
- Argentina, Market Value (USD Million), Volume (Thousand Tons), and CAGR, 2025-2037F
- Mexico, Market Value (USD Million), Volume (Thousand Tons), and CAGR, 2025-2037F
- Rest of Latin America, Market Value (USD Million), Volume (Thousand Tons), and CAGR, 2025-2037F
- By Type
- Middle East & Africa Ammonia Gas and Ammonia Water Market Outlook
- Market Overview
- Market Revenue by Value (USD Million), and Compound Annual Growth Rate (CAGR)
- Ammonia Gas and Ammonia Water Market Segmentation Analysis (2025-2038)
- By Type
- Ammonia Gas (Anhydrous)
- Ammonia Water (Aqueous)
- By Ammonia Gas (Anhydrous) Application
- Fertilizers
- Industrial Synthesis
- Refrigeration
- Power Generation
- Metal Treatment
- NOx Reduction
- Others
- By Ammonia Water (Aqueous) Application
- Water Treatment
- Cleaning & Disinfection
- Rubber & Plastics
- Textile Manufacturing
- Food Processing
- Laboratory Use
- Others
- By Country
- GCC, Market Value (USD Million), Volume (Thousand Tons), and CAGR, 2025-2037F
- Israel, Market Value (USD Million), Volume (Thousand Tons), and CAGR, 2025-2037F
- South Africa, Market Value (USD Million), Volume (Thousand Tons), and CAGR, 2025-2037F
- Rest of Middle East & Africa, Market Value (USD Million), Volume (Thousand Tons), and CAGR, 2025-2037F
- By Type
- Global Economic Scenario
- About Research Nester
Ammonia Gas and Ammonia Water Market Outlook:
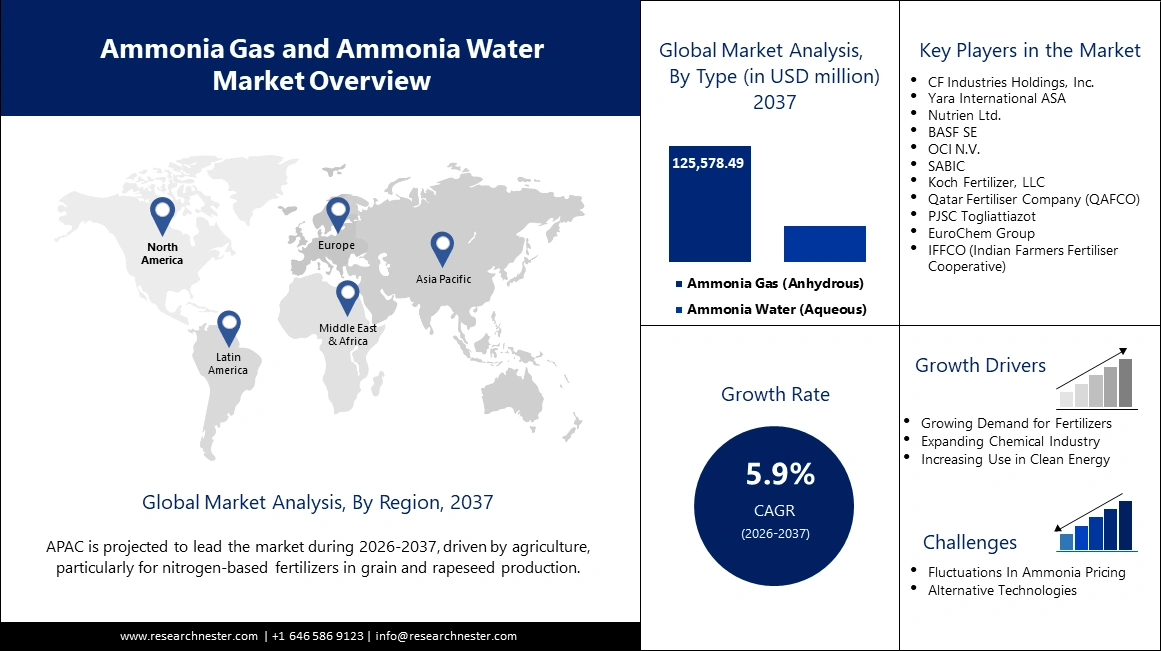
Ammonia Gas and Ammonia Water Market size was valued at USD 90.5 billion in 2025 and is projected to reach a valuation of USD 177.7 billion by the end of 2037, rising at a CAGR of 5.9% during the forecast period, i.e., 2026-2037. In 2026, the industry size of ammonia gas and ammonia water is estimated at USD 95.7 billion.
The ammonia gas and ammonia water market is witnessing a massive change, spurred by a global drive for decarbonization and the production of green ammonia as a premier energy carrier. Companies are making significant investments in low-carbon production technology and strategic collaborations to meet the increasing demand from both incumbent and emerging end-use markets. One of the developments in this space was the May 2025 long-term supply agreement between ExxonMobil and Marubeni for low-carbon ammonia. This collaboration will enable the establishment of new, cleaner energy supply chains. The process is backed by increasing interest from financial institutions, with participants such as Carlyle and GIC making strategic investments in green ammonia project developers, a sign of high market confidence in a sustainable ammonia economy.
Government policies and international collaborations are shaping the future of the market. For instance, in June 2024, Solar Energy Corporation of India (SECI) issued a record tender of 724,000 metric tons of green ammonia annually to green the nation's domestic fertilizer industry under its Strategic Interventions for Green Hydrogen Transition (SIGHT) program. This is backed by robust financial frameworks, such as a Payment Security Mechanism (PSM) to de-risk offtake contracts. These government programs are stabilizing the environment and making it investor-friendly, driving the transition towards green ammonia and making it the backbone of the future energy and agrifood economy.
Key Ammonia Gas and Ammonia Water Market Insights Summary:
Regional Highlights:
- North America’s Ammonia Gas and Ammonia Water Market is anticipated to grow at a CAGR of 5.5% from 2026 to 2037, underpinned by major investments in low-carbon ammonia production and strategic acquisitions within the clean energy sector.
- Europe is projected to experience substantial growth through 2037, attributed to strong policy support for decarbonization and large-scale initiatives promoting a green hydrogen economy.
Segment Insights:
- The anhydrous ammonia gas segment is predicted to command a dominant 91% share by 2037 in the Ammonia Gas and Ammonia Water Market, propelled by its crucial role in fertilizer production and the expanding adoption of clean energy applications.
- The fertilizers segment is projected to capture a 48.5% share by 2037, supported by the rising global demand for nitrogen fertilizers to ensure food security and the increasing shift toward sustainable agricultural practices.
Key Growth Trends:
- Global green energy revolution
- Maritime and industrial sector decarbonization
Major Challenges:
- Impact of geopolitical risk on ammonia supply chains
- Logistics challenges and safety hazards in ammonia operation
Key Players: CF Industries Holdings, Inc., Company Overview, Business Strategy, Key Product Offerings, Financial Performance, Key Performance Indicators, Risk Analysis, Recent Development, Regional Presence, SWOT Analysis, Yara International ASA, Nutrien Ltd., BASF SE, OCI N.V., SABIC, Koch Fertilizer, LLC, Qatar Fertiliser Company (QAFCO), PJSC Togliattiazot, EuroChem Group, IFFCO (Indian Farmers Fertiliser Cooperative), Sumitomo Chemical Co., Ltd., CSBP Limited, Lotte Chemical Corporation, PETRONAS Chemicals Group Berhad.
Global Ammonia Gas and Ammonia Water Market Forecast and Regional Outlook:
Market Size & Growth Projections:
- 2025 Market Size: USD 90.5 billion
- 2026 Market Size: USD 95.7 billion
- Projected Market Size: USD 177.7 billion by 2037
- Growth Forecasts: 5.9% CAGR (2026-2037)
Key Regional Dynamics:
- Largest Region: North America (5.5% CAGR by 2037)
- Fastest Growing Region: Europe
- Dominating Countries: United States, China, India, Germany, Japan
- Emerging Countries: Brazil, Saudi Arabia, South Korea, Australia, United Arab Emirates
Last updated on : 7 October, 2025
Ammonia Gas and Ammonia Water Market - Growth Drivers and Challenges
Growth Drivers
- Global green energy revolution: Rising inclination towards green energy is a major driver for the ammonia market, and green ammonia is emerging as a significant vector for hydrogen transport and storage. China Envision Energy commissioned the world's largest planned green hydrogen and ammonia complex in July 2025, with a 320,000-tonne-per-year capacity and a major offtake agreement with Japan Marubeni. The venture is representative of the ambition and size of investment in the green ammonia space. As the world moves towards achieving its climate goals, the need for green ammonia as a clean energy carrier and fuel will remain a key factor for market growth and development in the coming years.
- Maritime and industrial sector decarbonization: The shipping sector’s search for low-carbon fuels is building a robust market for ammonia. Amon Maritime and Navigator Gas established a joint venture to construct two ammonia-fueled ammonia carriers in July 2025, with backing from Norwegian state investment grant funding. The action shows the momentum for growth in ammonia as a zero-carbon marine fuel. Outside shipping, industrial end-users are also switching to low-carbon ammonia as they look to lower their emissions, building a two-way demand driver behind investment in new production technology and off-take transactions at scale.
- Growing applications in cutting-edge technology fields: Another significant driver is the increasing use of high-purity ammonia water in new manufacturing. The electronic grade ammonia water market is anticipated to experience strong growth due to the increasing semiconductor industry. The chemical is an essential material that is used to manufacture microelectronics, integrated circuits, and photovoltaic cells. 5G, the Internet of Things (IoT), and other new technologies have led to a boom in demand for tailored ammonia solutions, opening up lucrative opportunities for ammonia gas and ammonia water market growth beyond the traditional uses.
Global Trade Dynamics of Ammonia
New trade patterns in the global ammonia market are being redrawn by the clean energy transition. Historically, around 10% of global ammonia production (19-21 million tons) is traded annually, with the dominant export channels running from low-cost natural gas hubs, such as Russia, Trinidad and Tobago, and the Middle East, to major import centers in Europe, India, and East Asia. The trend continues, but its foundation is being rewritten. Europe's energy crisis prompted a shift in imports, and the U.S. transitioned from being an importer to a net exporter. The largest change is the anticipated development of new global trade channels for clean ammonia, with regions blessed with renewable energy sources (such as Australia and Chile) or carbon sequestration capabilities (such as North America and the Middle East) poised to become the clean energy providers of the future for European and Asian demand centers.
Global Ammonia Export Analysis (2019–2021)
|
Country |
Export Value (2019) |
Export Value (2020) |
Export Value (2021) |
|
Canada |
941813.00 |
1052308.00 |
1196041.00 |
|
U.S. |
289p24.82 |
40072.96 |
281923.24 |
|
UK |
232059.69 |
311981.24 |
111764.85 |
|
China |
192.54 |
31.55 |
70.27 |
|
India |
1526.80 |
1511.91 |
2592.48 |
|
Japan |
120.73 |
210.6 |
164.25 |
Global Ammonia Import Analysis (2019–2021)
|
Country |
Import Value (2019) |
Import Value (2020) |
Import Value (2021) |
|
Canada |
1057.98 |
8512.87 |
3676.92 |
|
U.S. |
25690.15 |
20.76 |
28878.19 |
|
UK |
25690.15 |
20.76 |
28878.19 |
|
Japan |
234958.84 |
213078.84 |
217446.57 |
|
India |
1526.80 |
1511.91 |
2592.48 |
|
China |
96.60 |
98.44 |
124.58 |
Challenges
- Impact of geopolitical risk on ammonia supply chains: One of the significant risks to the ammonia market is the impact of geopolitical uncertainty on supply chains. In June 2025, the delayed reopening of the Togliatti–Odesa pipeline and the subsequent drone attacks on manufacturing facilities severely impacted Russia's regional production and export of ammonia. These events exert tremendous pressure on the wider European supply chain, which is heavily reliant on these supplies for fertilizers and industrial chemicals. These disruptions lead to price volatility and market uncertainty and increase the need for more diversified and more resilient supply networks.
- Logistics challenges and safety hazards in ammonia operation: Another core issue is the logistical complexity and safety concerns of the storage and handling of ammonia water. A market report of March 2025 noted that, as ammonia is corrosive and highly volatile, it requires special storage conditions that would ensure stability and safety. There are stringent environmental laws and health standards that firms must be in adherence to, which add complexity and expense in operations. Balancing the requirements and competitiveness is a core issue for industry actors, especially in the face of rising regulatory pressure.
Ammonia Gas and Ammonia Water Market Size and Forecast:
| Report Attribute | Details |
|---|---|
|
Base Year |
2025 |
|
Forecast Year |
2026-2037 |
|
CAGR |
5.9% |
|
Base Year Market Size (2025) |
USD 90.5 billion |
|
Forecast Year Market Size (2037) |
USD 177.7 billion |
|
Regional Scope |
|
Ammonia Gas and Ammonia Water Market Segmentation:
Type Segment Analysis
The anhydrous ammonia gas segment is predicted to hold a commanding 91% share through 2037, fueled by its pivotal position in the manufacture of fertilizers and a host of industrial chemicals. Anhydrous ammonia is the feedstock of choice for nitrogen fertilizers, and it is thus critical to world agriculture. In December 2024, CF Industries proceeded with its ambition to make low-carbon ammonia at its Donaldsonville complex by sequestering and capturing up to 2 million metric tons of CO₂, the largest such conversion project to date. This indicates the industry's intent to decarbonize its flagship product while keeping pace with insatiable demand. The domination of the segment is further exemplified by its growing position as a clean energy carrier. New green and low-carbon ammonia production technologies are opening up new applications in the energy and transport sectors.
Ammonia Gas (Anhydrous) Application Segment Analysis
The fertilizers segment is projected to hold a 48.5% stake in the anhydrous ammonia market in 2037, owing to its pivotal role in global food security. As the global population grows, the need for nitrogen fertilizers to increase crop yields is a recurring and powerful ammonia gas and ammonia water market driver. In August 2024, the Indian government increased the green ammonia import quota for the fertilizer sector to 7.5 lakh tonnes annually under its SIGHT Scheme as part of a move to promote the use of sustainable ammonia in Indian fertilizer manufacturing and reduce the carbon footprint. Its growth is also driven by a worldwide trend towards more sustainable agricultural uses.
Ammonia Water (Aqueous) Application Segment Analysis
The rubber & plastics segment is projected to hold a 30% stake by the end of 2037, driven by its use as a processing agent and stabilizer in a broad range of manufacturing applications. While segment-specific developments are part of broader industrial trends, the growing demand for high-performance products in the automotive, construction, and consumer goods sectors drives recurring demand for ammonia water. Increased use of specialized industrial applications is creating new opportunities for high-purity and functional ammonia-based solutions in the manufacturing sector. The broader industrial applications of ammonia water, including pharmaceuticals, are also at the forefront of its market presence.
Our in-depth analysis of the global ammonia gas and ammonia water market includes the following segments:
|
Segment |
Subsegments |
|
Type |
|
|
Ammonia Gas (Anhydrous) Application |
|
|
Ammonia Water (Aqueous) Application |
|

Vishnu Nair
Head - Global Business DevelopmentCustomize this report to your requirements — connect with our consultant for personalized insights and options.
Ammonia Gas and Ammonia Water Market - Regional Analysis
APAC Market Insights
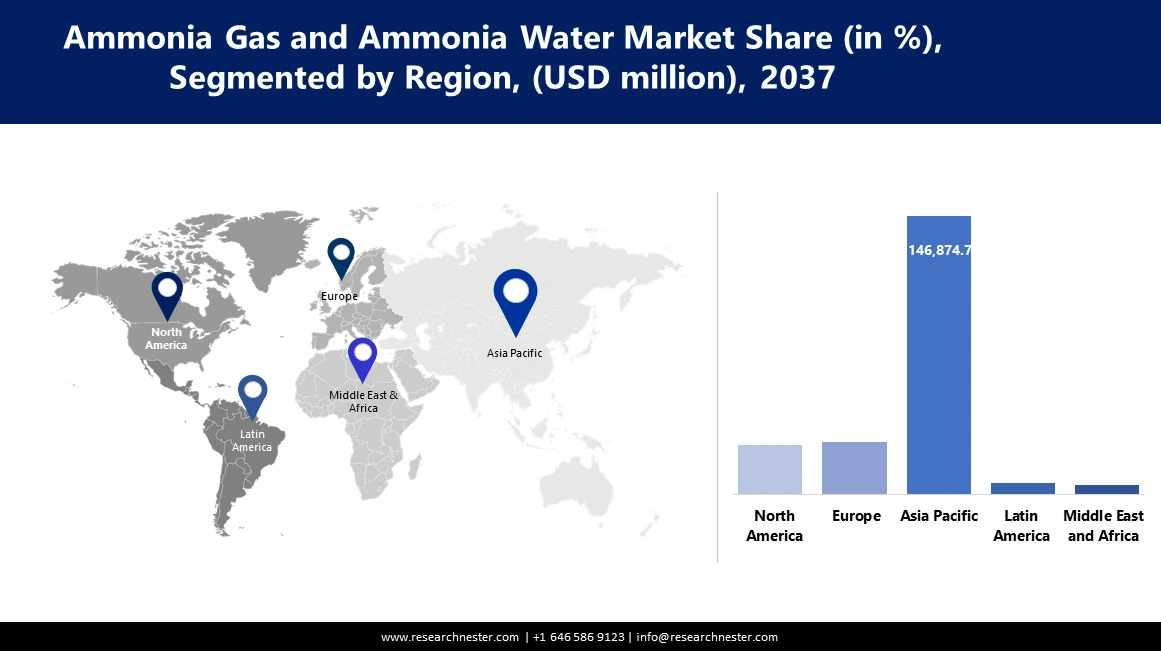
Asia Pacific ammonia water and ammonia gas market is anticipated to capture a 62.5% share during the forecast period. The region's dominance is due to its massive agriculture sector, rapid industrialization, and high government support for the development of an economy based on green hydrogen. In January 2024, the Indian Ministry of New and Renewable Energy conducted new auctions for green hydrogen subsidy use in the production of ammonia and refining oil. This aligns with a broader regional strategy to expand domestic clean energy capacity and reduce reliance on imported fuels, positioning the APAC as the center of future growth in ammonia markets.
China leads the ammonia water and ammonia gas market in terms of the highest production and consumption. The nation is making concerted efforts to reduce the carbon intensity of its massive ammonia sector through technological and policy measures. In December 2024, CHN Energy launched a project in Ningxia to partially replace coal-based hydrogen with clean hydrogen in one of its ammonia facilities. The action is a major operational transition towards cleaner production and is in line with China's national strategy to decrease industrial emissions. As China continues to make significant investments in green technology and renewable energy, its dominance in the ammonia water and ammonia gas markets will become even stronger.
India is strategically positioning itself to become a global hub for green ammonia production and consumption, supported by visionary government policies and substantial funding programs. In July 2024, the government was reported to be considering a viability gap funding (VGF) program of approximately USD 898 million to render green ammonia projects commercially viable. The sogram, which is expected to be incorporated in Budget 2024-25, is aimed at boosting domestic production and reducing the nation's reliance on imported ammonia. This visionary government program is creating a very robust market for domestic as well as international investors.
Ammonia Capacities Region Specific Insights
|
Region |
2025 |
2026 |
2027 |
2028 |
2029 |
|
Western Europe |
8,298 |
8,298 |
8,298 |
8,293 |
8,318 |
|
Central Europe |
5,835 |
5,835 |
5,835 |
5,835 |
5,835 |
|
E. Europe & c. Asia |
27,950 |
29,020 |
30,411 |
30,411 |
31,937 |
|
North America |
20,763 |
20,763 |
20,783 |
20,783 |
21,934 |
|
Latin America |
9,717 |
10,499 |
10,514 |
10,514 |
10,854 |
|
Africa |
11,442 |
12,237 |
12,763 |
14,209 |
15,567 |
|
West Asia |
18,694 |
19,643 |
21,414 |
21,414 |
21,414 |
|
South Asia |
20,974 |
20,974 |
21,572 |
21,572 |
22,170 |
|
East Asia |
74,419 |
74,067 |
74,527 |
74,296 |
74,897 |
|
Oceania |
1,615 |
1,615 |
2,748 |
2,753 |
2,753 |
North America Market Insights
North America's ammonia water and gas industry is anticipated to witness expansion at a CAGR of 5.5% from 2026 to 2037, led by significant investments in low-carbon ammonia production and tactical acquisitions to leverage the growth potential in the new clean energy sector. In September 2024, Woodside Energy finalized the acquisition of the OCI Clean Ammonia project in Texas, rebranded as the Beaumont New Ammonia Project, making the company among the largest future lower-carbon ammonia producers. The acquisition is part of a broader trend across the region, where energy players are diversifying their portfolios and investing in infrastructure to enable the transition to cleaner fuels and chemicals.
The U.S. ammonia gas and ammonia water market is driven by enormous infrastructure investments at scale and a strong focus on environmental protection. In April 2024, the U.S. EPA outlined its priorities for FY 2025-2026, including the successful implementation of the Bipartisan Infrastructure Law and its $50 billion allocation for water infrastructure upgrades. This program, along with programs like the "Get the Lead Out" program announced in November 2023, is driving demand for ammonia in water treatment applications. The EPA's focus on providing technical assistance and engineering support is additionally accelerating these projects, creating long-term demand for ammonia-based solutions.
Canada is influenced by international supply trends and strategic actions of its largest producers in the ammonia gas and ammonia water market. In September 2024, Nutrien announced that it would permanently shut down one of its four ammonia plants in Trinidad, the world's largest production complex. The shutdown was set to further cut world ammonia supplies and added to pressure on prices, especially in the North American market. Such strategic actions by Canadian industry titans have a significant influence on regional market stability and supply-demand balances, reflecting the nation's strategic role in the global ammonia trade.
Europe Market Insights
Europe is set to garner significant industry growth during the forecast period, with robust policy emphasis on decarbonization and the development of a green hydrogen economy. The European Union's November 2024 EUDP program funded a large green ammonia project by Skovgaard Invest, Vestas, and Haldor Topsoe. This 10 MW facility, directly integrated with local wind and solar power, is a significant stepping stone in the establishment of sustainable ammonia production in the region. The EU's plans to fund such innovative projects are creating a fertile space for investment and technological innovation in the European ammonia water and ammonia gas markets.
Germany is poised to become a European market leader in ammonia, driven by its advanced industrial base and a strong emphasis on the green energy transition. Low-carbon and green ammonia demand is expected to grow in Germany as its chemical and manufacturing sectors strive to decarbonize their operations. While there are specific projects located elsewhere in the EU, German technology and engineering companies usually spearhead the development of the needed components and systems, such as electrolyzers and catalysts. Germany's location at the center of the European industrial economy puts it at the hub of demand and innovation in the regional ammonia water and ammonia gas market.
The UK is strategically placing itself to be at the vanguard of the decarbonization future of the ammonia water and ammonia gas market, with green ammonia at its net-zero core. It is investing in renewable energy plants and exploring the application of green ammonia in shipping, power, and as a hydrogen carrier. In December 2023, India's Ministry of Ports, Shipping, and Waterways introduced an incentive scheme for alternatively-fueled vessels, including ammonia-fueled vessels—a policy direction replicated in the UK's approach to maritime decarbonization. As the UK builds its green energy capability, the UK domestic market for clean ammonia will increase significantly.
Key Ammonia Gas and Ammonia Water Market Players:
- CF Industries Holdings, Inc.
- Company Overview
- Business Strategy
- Key Product Offerings
- Financial Performance
- Key Performance Indicators
- Risk Analysis
- Recent Development
- Regional Presence
- SWOT Analysis
- Yara International ASA
- Nutrien Ltd.
- BASF SE
- OCI N.V.
- SABIC
- Koch Fertilizer, LLC
- Qatar Fertiliser Company (QAFCO)
- PJSC Togliattiazot
- EuroChem Group
- IFFCO (Indian Farmers Fertiliser Cooperative)
- Sumitomo Chemical Co., Ltd.
- CSBP Limited
- Lotte Chemical Corporation
- PETRONAS Chemicals Group Berhad
The ammonia gas and ammonia water market is dominated by large multinational companies that are moving towards sustainability and strategic investments to continue their dominance at the top. The industry is characterized by a combination of legacy production and future investments in decarbonization technology, enabling adaptation to the evolving market needs and sustainability targets. As the market further consolidates, the ability to adapt and meet the requirements of the green transition will be the test of success. In December 2024, CF Industries moved forward with its plan to produce low-carbon ammonia at its Donaldsonville complex by capturing and storing up to 2 million metric tons of CO₂, the largest such conversion project to date. This highlights the industry's commitment to decarbonizing its core product while meeting sustained demand. These industry giants are focused on expanding their capacity and making enormous strategic strides to secure their position in the future of clean energy.
Here are some leading companies in the ammonia gas and ammonia water market:
Recent Developments
- In June 2025, Woodside Energy's Beaumont New Ammonia Project in Texas targeted the start of its initial ammonia production for the second half of the year. The project plans to shift to producing lower-carbon ammonia in the latter half of 2026. This timeline positions Woodside as an early mover in the growing market for ammonia with a reduced carbon intensity.
- In April 2025, JERA, alongside partners CF Industries and Mitsui & Co., announced its final investment decision on the Blue Point low-carbon ammonia production facility in Louisiana. Set to be the world's largest of its kind, the plant is designed with an annual capacity of approximately 1.4 million tons. Production is scheduled to commence in 2029, marking a significant step in scaling up low-carbon ammonia supply.
- In December 2024, Yara Cubatão began the production of renewable ammonia from biomethane at its facility in Brazil. This project involves the conversion of a conventional plant to utilize a cleaner feedstock. The initiative represents a growing trend of retrofitting existing infrastructure to reduce emissions and produce lower-carbon products more quickly and with lower capital expenditure.
- Report ID: 7967
- Published Date: Oct 07, 2025
- Report Format: PDF, PPT
- Explore a preview of key market trends and insights
- Review sample data tables and segment breakdowns
- Experience the quality of our visual data representations
- Evaluate our report structure and research methodology
- Get a glimpse of competitive landscape analysis
- Understand how regional forecasts are presented
- Assess the depth of company profiling and benchmarking
- Preview how actionable insights can support your strategy
Explore real data and analysis
Frequently Asked Questions (FAQ)
Free Sample includes current and historical market size, growth trends, regional charts & tables, company profiles, segment-wise forecasts, and more.
Connect with our Expert


Copyright @ 2026 Research Nester. All Rights Reserved.
