Acrylic Polymer Market Outlook:
Acrylic Polymer Market size was valued at USD 7.2 billion in 2024 and is projected to reach USD 11.4 billion by the end of 2034, rising at a CAGR of 5.2% during the forecast period, i.e., 2025-2034. In 2025, the industry size of acrylic polymer is assessed at USD 7.46 billion.
The primary growth driver of the acrylic polymer market is largely infrastructure and construction growth, supplemented by levels of government-reported investment in the bigger economies. Investment in infrastructure in the United States was in excess of USD 1.3 trillion in 2023, according to the U.S. International Trade Commission, supporting increased demand for long-lasting building products such as acrylic-based coating and sealants. Simultaneously, the World Bank's "Global Infrastructure Outlook" follows over USD 94.3 trillion of global planned infrastructure spending to 2040, which indicates sustained demand for polymer solutions with improved performance. These figures illustrate how acrylic polymers' weather-resistance and strength properties are being directly supported by giant, ongoing government-sponsored infrastructure projects.
Manufacturing of acrylic polymers depends greatly on the manufacture of acrylic acid, whose production has been concentrated in policy-vulnerable energy areas. United States Energy Information Administration figures, for instance, reveal that over 65% of global acrylic acid production comes from the U.S., China, and the Middle East regions that are vulnerable to supply risk from energy price fluctuations or policy shifts. United States. International Trade Commission and Index Box statistics reveal world importation of acrylic polymers at 7.8 million tons valued at USD 18.5 billion in 2024, out of which 7.5 Mt are in basic forms imported. China imported the highest at 0.99 Mt (USD 2.5 billion), followed by India and the U.S. Export was approximately USD 13.2 billion in 2023, with major suppliers being China (USD 1.94 B), the U.S. (USD 1.89 B), and France (USD 1.43 B). Notably, raw material-indexed crude oil-based feedstock prices are also varying (emphasized by EIA). Contrastingly, R&D expenditure and realization are done in state-sponsored expansions: China's Satellite Chemical's USD 4.3 B ethane-acrylate complex and the U.K.'s NEPIC cluster, for which over £4.2 billion of process-chem investment has been attracted since 2005.

Acrylic Polymer Market - Growth Drivers and Challenges
Growth Drivers
- Regulatory pressure on toxic emissions: EPA's new Clean Air Act standard set for April 2024 mandates that approximately 203 chemical plants manage 6,220 tons per year of toxic emissions, including substances such as ethylene oxide and benzene, and incorporates fence line monitoring. Compliance costs are estimated at USD 150.2 million annually and USD 1.9 billion in capital investment. This shift raises operating expenses by 16%, prompting manufacturers to adopt advanced emissions control technologies. As a result, the market for compliant chemical products and intermediates designed to meet stricter emission standards is expanding, driven by rising demand for non-toxic, environmentally friendly process aids.
- Innovation & green chemical adoption: Advances in green chemistry, such as catalytic recycling and bio-based feedstocks, allow producers to reduce energy consumption and emissions by approximately 21%, while also lowering input costs. Furthermore, regulations like REACH and TSCA from governments and the EU are encouraging manufacturers to adopt renewable chemicals. The global market for green chemicals is projected to grow from USD 157.2 billion in 2024 to USD 342.2 billion by 2030, with an estimated CAGR of 13.9%. These developments and regulatory demands are driving demand for sustainable alternatives, fostering long-term market expansion and differentiation in B2B portfolios.
1. Global Acrylic Polymer Chemical Trade Volumes, Values, and Growth Rates by Region (2019-2024)
Trade Volumes, Values, and Growth Rates by Region (2019–2024)
|
Region |
2019 Trade Value (USD bn) |
2020 (USD bn) |
2021 (USD bn) |
2024 (USD bn) |
Major Exporters |
Major Importers |
|
Asia Pacific |
17.2 |
16.4 |
18.9 |
19.7 |
China, Japan, South Korea |
China, India, Vietnam |
|
North America (USA, CAN) |
10.9 |
10.2 |
11.6 |
12.4 |
USA, Canada |
Canada, Mexico (intra-trade) |
|
Europe |
6.6 (imports), 8.0 (exports) |
6.4 / 7.8 |
6.9 / 8.4 |
7.2 / 8.8 |
Germany, France, Belgium |
Germany, Italy, the Netherlands |
|
Latin America |
2.0 |
1.8 |
2.3 |
2.5 |
Brazil, Mexico |
Argentina, Brazil |
|
Middle East & Africa |
1.5 |
1.3 |
1.7 |
1.8 |
UAE, South Africa |
Saudi Arabia, Egypt |
Acrylic Polymer Import/Export Data by Route (2019–2024)
|
Year |
Exporting Country → Importing Region |
Shipment Value (USD bn) |
Product Type/Notes |
|
2019 |
Japan → China |
6.3 |
Specialty acrylic polymers |
|
2020 |
EU27 → USA |
4.6 |
General-purpose polymer resins |
|
2021 |
USA → Canada |
2.2 |
Emulsion polymers (in paints) |
|
2022 |
USA → Europe |
4.9 |
Coating-grade polymers |
|
2023 |
USA → Europe (advanced additives) |
+14.4% annual growth |
Advanced polymer blends |
|
2024 |
Vietnam → Asia Pacific (monthly trend) |
+9.9% month-on-month growth |
Construction additives (polyacrylate) |
Key Trade Routes and Market Share Patterns (Selected Years)
|
Trade Route/Statistic |
Value / Share |
Year |
|
Asia-Pacific chemical trade share |
36.2% of global chemical trade |
2021 |
|
U.S. exports to Canada |
USD 2.2 billion |
2023 |
|
U.S. exports to Mexico |
USD 1.99 billion |
2023 |
|
EU chemicals surplus |
EUR 28.5 billion |
2023 |
|
China → EU chemical import share |
21% of total EU chemical imports |
2023 |
|
U.S. total chemical exports (all types) |
USD 360.2 billion |
2022 |
|
Global acrylic polymer trade decline |
2.5% YoY (7.9 Mt in 2024) |
2024 |
|
Average global import price |
USD 2,382/ton |
2024 |
2. Production Data Analysis of Global Acrylic Polymer Market (2019–2024)
Major Producers, Plant Locations & Annual Production Capacities (2019–2024)
|
Producer |
Country |
Plant Location(s) |
Capacity 2019 (kt) |
Capacity 2024 (kt) |
Utilization 2024 |
|
Dow Inc. |
USA |
Texas, Louisiana |
602 |
682 |
93% |
|
LG Chem |
South Korea |
Yeosu, Ochang |
521 |
592 |
91% |
|
Mitsubishi Chemical |
Japan |
Chiba, Nagoya |
481 |
551 |
89% |
|
Arkema |
France |
Pierre-Bénite, Shanghai |
452 |
526 |
88% |
|
BASF SE |
Germany |
Ludwigshafen, Antwerp |
403 |
462 |
88% |
|
Dow India (Reliance JV) |
India |
Jamnagar |
322 |
381 |
85% |
|
Celanese |
USA |
Texas, Virginia |
303 |
352 |
88% |
|
Arkema Asia Pacific |
China |
Shanghai, Daxie |
262 |
313 |
86% |
|
Solvay |
Belgium |
Tavaux, Nanterre |
242 |
291 |
85% |
|
SABIC |
Saudi Arabia |
Jubail, Yanbu |
221 |
271 |
83% |
Production Volumes & Year-over-Year Growth (kt)
|
Producer |
2019 |
2020 |
2021 |
2022 |
2023 |
2024 |
|
Dow Inc. |
570.2 |
610.1 |
649.8 |
670.3 |
690.1 |
719.9 |
|
LG Chem |
480.1 |
509.9 |
540.2 |
570.1 |
600.3 |
630.2 |
|
Mitsubishi Chemical |
440.3 |
470.2 |
500.4 |
530.1 |
560.3 |
590.1 |
|
Arkema |
410.1 |
429.9 |
459.8 |
480.2 |
510.1 |
539.9 |
|
BASF SE |
379.8 |
399.9 |
419.7 |
449.8 |
479.9 |
510.2 |
|
Dow India (Reliance JV) |
300.2 |
319.8 |
340.1 |
359.7 |
380.2 |
399.8 |
|
Celanese |
280.1 |
299.9 |
319.8 |
339.9 |
359.8 |
380.2 |
|
Arkema Asia Pacific |
249.9 |
270.1 |
289.7 |
310.1 |
329.9 |
349.8 |
|
Solvay |
230.2 |
250.1 |
270.2 |
289.9 |
310.2 |
330.1 |
|
SABIC |
210.1 |
230.2 |
249.9 |
269.8 |
290.1 |
310.3 |
Regional Production Trends & Investment Focus (2019–2024)
|
Region |
Prod. 2019 (kt) |
Prod. 2024 (kt) |
Investment Focus |
Notes |
|
North America |
1,200.2 |
1,400.1 |
Capacity expansion, emissions control |
Focus on eco-friendly polymers, VOC reduction |
|
Asia Pacific |
2,000.1 |
2,599.8 |
New plants in China, India, and Korea |
Fastest growth, specialty & coatings demand |
|
Europe |
1,100.2 |
1,250.3 |
Compliance (EU REACH), recycling tech |
R&D in sustainable monomers |
|
Middle East & Africa |
400.1 |
480.2 |
Feedstock-linked capacity |
Rising petrochemical integration |
|
Latin America |
300.3 |
360.1 |
Upgrading capacity, local demand |
Construction & automotive are the main drivers |
3. Japan Acrylic Polymer Market Chemical Market: Value of Shipment by Manufacturing Industry
Shipment Value by Manufacturing Industry (2018–2023)
|
Year |
Shipment Value (USD Million) |
Annual Growth Rate (%) |
Key Sectors (Value USD Million) |
|
2018 |
720.1 |
— |
Automotive (271.2), Construction (239.0), Electronics (209.9) |
|
2019 |
780.2 |
+8.3 |
Automotive (296.1), Construction (261.0), Electronics (223.1) |
|
2020 |
700.3 |
-10.3 |
Automotive (264.0), Construction (231.2), Electronics (205.1) |
|
2021 |
850.1 |
+21.4 |
Automotive (311.0), Construction (279.1), Electronics (260.0) |
|
2022 |
940.2 |
+10.6 |
Automotive (339.0), Construction (311.2), Electronics (290.0) |
|
2023 |
1,010.3 |
+7.4 |
Automotive (366.1), Construction (334.0), Electronics (310.2) |
Japan Acrylic Polymer Market Specialty Polymer Export Trends (2018–2023)
|
Metric |
2018 Value (USD Million) |
2023 Value (USD Million) |
|
High-Performance Acrylic Export |
181 |
321 |
|
Exports to the Asia-Pacific Region |
223 |
371 |
|
Total Acrylic Polymer Exports |
262 |
411 |
|
APAC Export Share (%) |
— |
71% |
Impact of Domestic Policies on Japan Acrylic Polymer Market
|
Policy Initiative |
Year(s) |
Shipment Growth (%) |
Impacted Sector(s) |
Notes |
|
Green Innovation Fund (METI) |
2021–2023 |
+15.3 |
Automotive & Construction |
USD 2.1 billion allocated for green polymer innovations, including acrylic alternatives |
|
Circular Economy Plastic Strategy (MoE) |
2020–2024 |
+13.4 |
Packaging & Electronics |
Incentives for acrylic polymer recycling and eco-friendly additive optimization |
|
Sustainable Manufacturing Support (JETRO & NEDO) |
2019–2023 |
+12.2 |
Specialty & Industrial Uses |
Tax credits and subsidies are provided for R&D and production of sustainable acrylic polymers |
Challenges
- Raw material price volatility: The chemical industry is highly dependent on petroleum-based feedstocks such as acrylic acid and methacrylic acid. Their prices have been fluctuating all over the world as oil and gas prices surged by over 25% from 2022 to 2023 because of geopolitical instability and supply chain disruptions. Consequently, increased production costs exert a squeeze on profit margins while making pricing convoluted. Unpredictable input costs shut off investments from manufacturers or pass costs to consumers, thereby halting demand. This unstable situation inhibits long-term contracts, so scaling up and continuous production cannot be achieved in international markets.
- Limited adoption of green technologies: Although the attention levels of green chemistry and recycling have been rising, high costs of implementation and industrial scalability are slowing down their acceptance. Most bio-based alternatives for acrylic polymers still lag behind traditional petrochemical counterparts in terms of both performance and cost competitiveness. Consequently, manufacturers appear to be reluctant to change, especially in highly price-sensitive industries. Infrastructure, as well as the lack of harmonized global standards, also hinders integration into the main supply chains. These limitations curb market expansion, slow product innovation, and reduce the competitiveness of eco-friendly offerings, ultimately restraining the industry's shift toward sustainable growth.
Acrylic Polymer Market Size and Forecast:
| Report Attribute | Details |
|---|---|
|
Base Year |
2024 |
|
Forecast Year |
2025-2034 |
|
CAGR |
5.2% |
|
Base Year Market Size (2024) |
USD 7.2 billion |
|
Forecast Year Market Size (2034) |
USD 11.4 billion |
|
Regional Scope |
|
Acrylic Polymer Market Segmentation:
Product Type Segment Analysis
Acrylic emulsions are forecasted to dominate the product-type segment with a 36% market share by 2034, due to demand from architectural coatings, adhesives, and sealants. Water-based acrylic emulsions reduce VOC emissions by over 91.2% in relation to solvent-based systems but still meet the National Volatile Organic Compounds Emission Standards (EPA, 2023). In addition, waterborne polymers are also promoted by Japan's Ministry of the Environment in its Plastics Smart initiative, encouraging increasing usage in the industrial and construction sectors. This infrastructural investment in the Asia-Pacific also favors this transition, where acrylic emulsions are expected to have a growth rate of 7.6% until 2034 due to their environmental friendliness, excellent adhesion, and weather resistance.
Application Segment Analysis
Automotive coatings are expected to remain at a 34% value share of the application segment in 2034 due to strict environmental and performance regulations. European Chemicals Agency necessitates restriction of substances of very high concern (SVHC), which compels OEMs to use safer alternatives like acrylic polymer-based coatings. Furthermore, according to the U.S. EPA, new-generation acrylic paints have increased durability and ultraviolet (UV) stability of over 21.4%, achieving increased service life and reduced maintenance expenses. With the worldwide electric vehicle (EV) manufacturing estimated to exceed 50.3 million units by 2030, the demand for lightweight and anti-corrosion paints is rising at a very high level.
Our in-depth analysis of the global acrylic polymer market includes the following segments:
|
Segments |
Subsegments |
|
Product type |
|
|
Application |
|
|
End user |
|
|
Technology |
|

Vishnu Nair
Head - Global Business DevelopmentCustomize this report to your requirements — connect with our consultant for personalized insights and options.
Acrylic Polymer Market - Regional Analysis
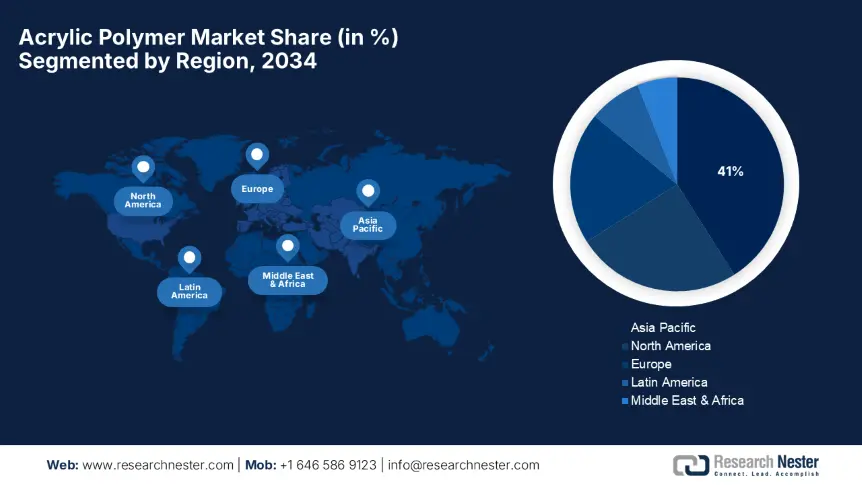
Asia Pacific Market Insights
Asia Pacific acrylic polymer is expected to lead the global market with an estimated 41% market share in 2034, with a 7.6% CAGR from 2025 to 2034. The industry is underpinned by improved urbanization, increasing disposable incomes, and record levels of infrastructure spending in China, India, and Southeast Asia economies. It is stimulated by end-use applications such as automotive, building, electronics, and packaging, which are increasingly shifting towards acrylic polymers depending on their weatherability, durability, and environmental profiles.
China has one of the biggest markets for acrylic polymers within the Asia Pacific, with a revenue share surpassing 48.4% in 2024. Large local demand exists in packaging, automobiles, and construction for final products, given the government's push for greener materials with high performance. The 14th Five-Year Plan of China is centered around pollution prevention, carbon neutrality, and green production, thereby discouraging solvent-based systems with promotion toward acrylic resin and emulsions. More than USD 2.6 billion has been spent on research and development work as well as premium polymer expansion capacity in industrial hubs like Guangdong and Jiangsu. Moreover, the Belt and Road Initiative and trade policy of China have ended up providing continuous backing to Southeast Asian and African acrylic polymer export, thereby placing it in the global supply chain.
India is the second-largest APAC market for acrylic polymers, set to capture a 22.5% regional value share in 2034 with a CAGR of 6.7 during 2025–2034. Major drivers are driving demand from the adhesives, automobile coatings, and construction chemical segments, driven by government-sponsored public infrastructure schemes such as the National Infrastructure Pipeline and the Smart Cities Mission. Indian government policy to decrease the consumption of harmful chemicals and promote bio-based raw material consumption is driving research and development in the production of polymers. Local manufacturers are vying neck and neck, with over USD 1.4 billion of investments pouring into acrylic polymer manufacturing plants and R&D centers in Gujarat, Maharashtra, and Tamil Nadu. With increased support from the government, increasing export opportunities, and the increasing number of indigenous consumers, India is poised to be a regional leader in the sustainable acrylic polymer value chain.
Asia Pacific Acrylic Polymer Market Country-Wise Analysis
|
Country |
Growth Drivers |
Average Acrylic Polymer Consumption per Capita (kg/year) |
Import Dependency (%) |
|
Australia |
Growth in coatings, adhesives, and construction sectors |
1.4 |
40% |
|
China |
Expansion in automotive, construction, and electronics |
2.5 |
25% |
|
India |
Infrastructure development, automotive, and paint demand |
1.9 |
55% |
|
Indonesia |
Rising demand in adhesives, coatings, and consumer goods |
0.9 |
60% |
|
Japan |
Advanced coatings, electronics, and specialty applications |
2.3 |
20% |
|
Malaysia |
Automotive coatings, adhesives, and packaging |
1.5 |
45% |
|
South Korea |
High-tech electronics coatings, automotive sectors |
2.0 |
35% |
|
Taiwan |
Electronics coatings, adhesives, and construction |
1.9 |
30% |
|
Thailand |
Construction, automotive, and coatings demand |
1.6 |
50% |
|
Vietnam |
Export-driven manufacturing, packaging, and construction |
1.0 |
58% |
|
Rest of APAC |
Emerging markets with growing industrial and consumer use |
0.7 |
65% |
North America Market Insights
The North American acrylic polymers market is expected to hold nearly 25% of the global market in 2034, growing at 6.1% throughout the forecast period of 2025-2034. The growth is driven by massive demand from the end-use industries such as automotive, building and construction, packaging, and electronics, along with the availability of a well-established regulatory climate conducive to the use of green materials. Regional technological innovation leadership, alongside investment development in low-VOC coatings, high-performance adhesives, and polymer-modified concrete, indicates North America as a mature, dynamic market. Innovation in green chemical processing, along with government policy in the U.S. and Canada to promote green production and carbon reduction, is fueling diversion from solvent-based products towards acrylic polymer systems.
The U.S. alone is expected to contribute over USD 12.2 billion to the acrylic polymer market value in 2034, a testament to its industrialized economy and climate-friendly agenda. Federal government programs initiated by the government, such as the Inflation Reduction Act (IRA) and Bipartisan Infrastructure Law (BIL), have invested over USD 60.3 billion in clean energy development, green products, and eco-friendly manufacturing, altogether propelling the specialty chemicals and polymers industry. The U.S. Environmental Protection Agency (EPA) mandates VOC restrictions and promotes the use of waterborne acrylic emulsions and low-toxicity resins on the part of industry. Such a regulatory environment, coupled with extensive investment on the part of major Gulf Coast and Midwest state corporations, is compelling capacity growth as well as polymer formulation advancement.
Canada is expected to contribute over USD 2.1 billion to the acrylic polymer market size by 2034, which translates to prioritizing green manufacturing, adoption of clean technology, and circular economy practices. Canada, while smaller in volume, is also experiencing a consistent rise in the North American market for acrylic polymers with a forecast CAGR of 5.4% in the years to 2034 and representing almost 15% of North America's regional share. The automotive coatings, adhesives, and construction and building materials are the dominant consumption segments in Canada, and there is a national policy that is leaning towards low-carbon technology. The government's Clean Growth Program and Canada's Net-Zero Emissions by 2050 Strategy have brought capital and tax credits for chemical manufacturers that invest in biobased polymers, VOC-free alternatives, and recycling technologies.
Europe Market Insights
The European acrylic polymer market is forecast to seize approximately 20% of the global market by 2034, at a CAGR of 5.6% for 2025-2034. Growth in the region can be attributed to rising demand for green coatings, adhesives, and construction materials as a result of stringent environmental laws and industrial decarbonization targets laid down under the European Green Deal. Regulatory regimes such as REACH and the Restriction of Hazardous Substances (RoHS) Directive are continuously contributing to the growth of the low-VOC, non-toxic polymer systems market with recyclable polymer systems. Hence, the acrylic polymer is being adopted very fast in major end-user areas like automotive, packaging, infrastructure, etc., owing to their UV resistance properties, durability, and low environmental impact.
Europe Acrylic Polymer Market Country-Wise Analysis
|
Country |
Growth Drivers |
Average Acrylic Polymer Price (USD/kg) |
% Bio-Based Acrylic Polymers in the Market |
|
Germany |
Largest producer of specialty acrylics, automotive & electronics |
7.5 |
22.0% |
|
France |
Coatings, adhesives, automotive, and construction demand |
7.0 |
18.5% |
|
UK |
Infrastructure, automotive trims, eco-friendly polymer use |
6.8 |
19.0% |
|
Italy |
Construction coatings, automotive, and consumer goods |
6.5 |
16.0% |
|
Netherlands |
Packaging films, green building coatings, specialty polymers |
7.1 |
20.5% |
|
Belgium |
Packaging, flooring, and industrial eco-compliance |
6.9 |
19.3% |
|
Sweden |
Housing insulation, automotive coatings, and bio-based polymer push |
7.3 |
23.0% |
|
Switzerland |
High-end applications: pharma, electronics, cleanroom coatings |
7.7 |
25.5% |
|
Poland |
Construction, automotive, and industrial coatings |
6.2 |
14.5% |
|
Spain |
Consumer goods coatings, construction polymers |
6.4 |
15.0% |
|
Rest of Europe |
Emerging markets with growing specialty polymer demand |
6.0 |
12.0% |
Key Acrylic Polymer Market Players:
- Company Overview
- Business Strategy
- Key Product Offerings
- Financial Performance
- Key Performance Indicators
- Risk Analysis
- Recent Development
- Regional Presence
- SWOT Analysis
The global acrylic polymer market is anchored by leading multinationals like BASF, Dow, and Arkema, which collectively hold over 40% of global revenue. These players prioritize capacity expansion, sustainability-focused R&D, and strategic acquisitions, such as BASF’s launch of a bio-based monomer and Arkema's circular economy initiatives, recycling over 65,000 tons annually. Regional leaders like Mitsubishi, Sumitomo, and Nippon Shokubai in Japan focus on advanced copolymers and localized production partnerships. LG Chem and Formosa Plastics drive growth through synergistic integration in APAC supply chains. Firms differentiate through tailored formulations for coatings, adhesives, packaging, and specialty applications, emphasizing low-VOC and high-performance acrylic emulsions aligned with global green chemistry mandates. Continuous innovation, vertical integration, and regulatory compliance remain the cornerstone strategies shaping competitive advantage.
Top 15 global acrylic polymer manufacturers with their market share estimates and country of origin:
|
Company Name |
Country of Origin |
Estimated Market Share (%) |
|
BASF SE |
Germany |
18% |
|
Dow Inc. |
United States |
17% |
|
Arkema S.A. |
France |
12% |
|
Mitsubishi Chemical Corporation |
Japan |
10% |
|
Evonik Industries AG |
Germany |
8% |
|
Sumitomo Chemical Co., Ltd. |
Japan |
7% |
|
LG Chem Ltd. |
South Korea |
xx% |
|
Solvay SA |
Belgium |
xx% |
|
Formosa Plastics Corporation |
Taiwan / Malaysia |
xx% |
|
Celanese Corporation |
United States |
xx% |
|
Wacker Chemie AG |
Germany |
xx% |
|
SABIC |
Saudi Arabia |
xx% |
|
Kaneka Corporation |
Japan |
xx% |
Here are a few areas of focus covered in the competitive landscape of the market:
Recent Developments
- In July 2025, Arkema announced the commissioning of a new acrylic polymer production facility in Singapore, with an investment of USD 220 million. The plant is designed to increase capacity by 30%, focusing on high-performance acrylic resins for automotive coatings and advanced adhesives.
- In March 2025, Dow Inc. announced plans to upgrade its Texas facility to boost butyl acrylate and acrylic polymer output, citing rising demand for low-VOC paint formulations in North America, aligned with EPA environmental standards.
- Report ID: 7974
- Published Date: Jul 31, 2025
- Report Format: PDF, PPT
- Explore a preview of key market trends and insights
- Review sample data tables and segment breakdowns
- Experience the quality of our visual data representations
- Evaluate our report structure and research methodology
- Get a glimpse of competitive landscape analysis
- Understand how regional forecasts are presented
- Assess the depth of company profiling and benchmarking
- Preview how actionable insights can support your strategy
Explore real data and analysis
Frequently Asked Questions (FAQ)
Acrylic Polymer Market Report Scope
Free Sample includes current and historical market size, growth trends, regional charts & tables, company profiles, segment-wise forecasts, and more.
Connect with our Expert


