Solar PV Mounting Systems Market Outlook:
Solar PV Mounting Systems Market size was over USD 15.54 billion in 2025 and is anticipated to cross USD 24.13 billion by 2035, growing at more than 4.5% CAGR during the forecast period i.e., between 2026-2035. In the year 2026, the industry size of solar PV mounting systems is estimated at USD 16.17 billion.
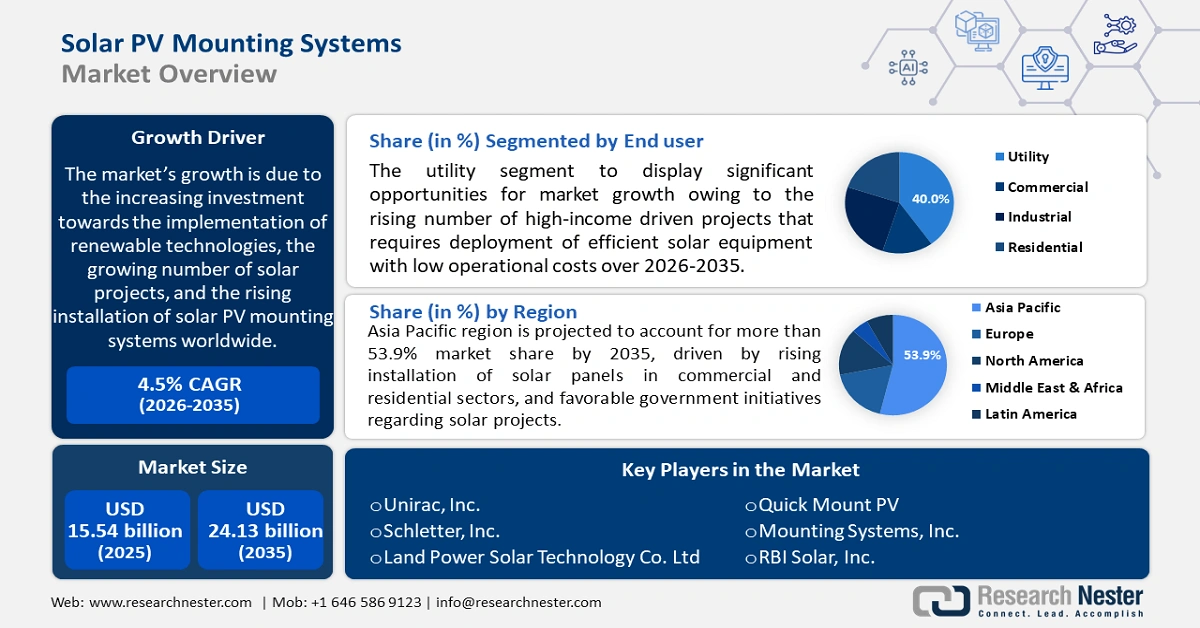
The market growth is driven by increasing investment towards implementation of renewable technologies, growing number of solar projects and rising installation of solar PV mounting systems around the world. According to the Solar Energy Industries Association, in 2020, the cumulative capacity of solar installations was approximately 100,000 megawatts, up from 80,000 megawatts in 2019.
Furthermore, adoption of government policies that promote the adoption of solar energy will boost the market growth. In addition, the high consumption of fossil fuels in the last decades has emerged to be a major concern for the rise of global warming. The industrial and commercial sectors in developing nations have a high need for solar photovoltaic (PV) mounting solutions, fueling the market expansion. Sales of photovoltaic mounting solutions should increase over time as a result of changing architectural trends and innovations in the building sector.
Key Solar PV Mounting Systems Market Insights Summary:
Regional Highlights:
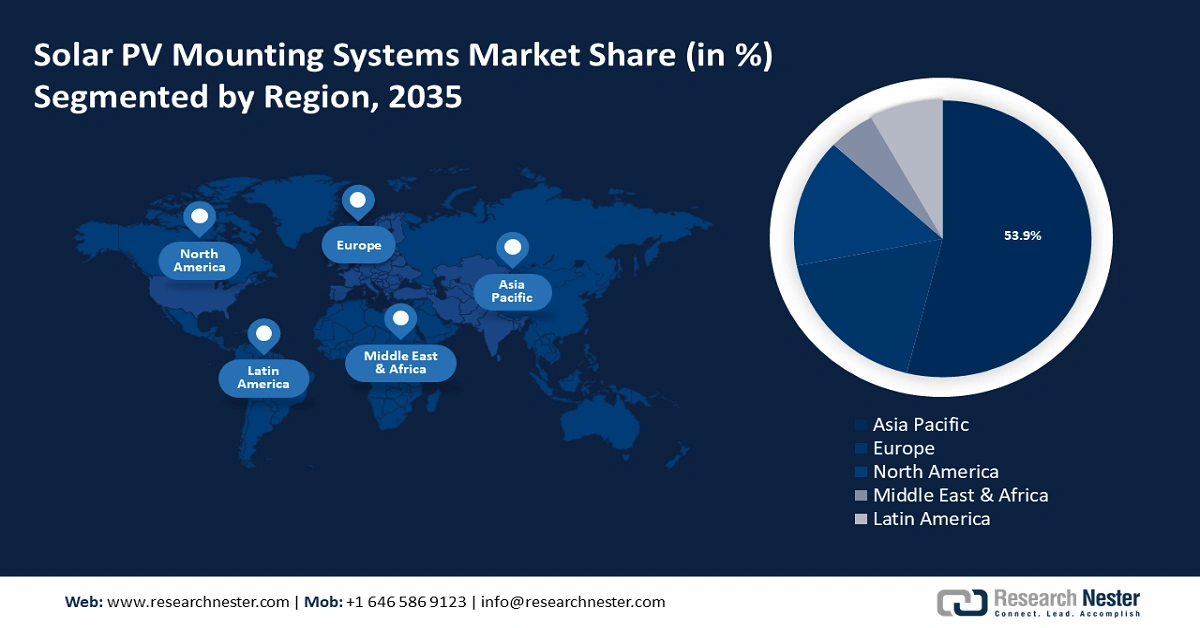
- Asia Pacific solar PV mounting systems market will hold around 53.9% share by 2035, driven by rising installation of solar panels in commercial and residential sectors, and favorable government initiatives regarding solar projects.
- Europe market projects significant growth during the forecast timeline, driven by high usage of sustainable energy resources and government encouragement for renewable energy.
Segment Insights:
- The utility segment in the solar pv mounting systems market is forecasted to capture the largest share by 2035, driven by increased deployment of efficient solar equipment supported by high-income projects.
- The ground mounted segment in the solar pv mounting systems market is projected to hold the highest market share by 2035, attributed to increasing installation in utility-scale solar projects and ease of maintenance.
Key Growth Trends:
- Growing Urban Population
- Growing Demand for Electricity
Major Challenges:
- Growing Urban Population
- Growing Demand for Electricity
Key Players: K2 Systems GmbH, Unirac, Inc., Schletter, Inc., Land Power Solar Technology Co. Ltd, Quick Mount PV, Mounting Systems, Inc., RBI Solar, Inc., Pennar Industries Limited, Tata International Limited, Nuevosol Energy Pvt. Ltd.
Global Solar PV Mounting Systems Market Forecast and Regional Outlook:
Market Size & Growth Projections:
- 2025 Market Size: USD 15.54 billion
- 2026 Market Size: USD 16.17 billion
- Projected Market Size: USD 24.13 billion by 2035
- Growth Forecasts: 4.5% CAGR (2026-2035)
Key Regional Dynamics:
- Largest Region: Asia Pacific (53.9% Share by 2035)
- Fastest Growing Region: Asia Pacific
- Dominating Countries: China, United States, Germany, India, Japan
- Emerging Countries: China, India, Japan, South Korea, Brazil
Last updated on : 8 September, 2025
Solar PV Mounting Systems Market Growth Drivers and Challenges:
Growth Drivers
-
Growing Urban Population - Around 4.4 billion people, or 56% of the world's population, reside in cities. By 2050, approximately 7 out of 10 people would live in cities, with the urban population predicted to more than double from its current level. Further, owing to the growing urban population the infrastructure activities is expected to boost, Moreover many construction industries are driving their attention towards solar buildings. Also, government are initiating efforts to encourage development of solar buildings. For instance, the Building Standards Commission of California enacted a new regulation in 2018 that is beyond any other statute in the history of the United States. The government imposed a requirement that all new residential buildings with three floors or less must have solar panels in an endeavor to generate all of the state's electricity from renewable sources. In 2020, the law has already taken effect.
-
Growing Demand for Electricity - By 2040, the world's electricity demand would be growing at a about 3% annual rate, which is twice as fast as demand for primary energy. As a result, the percentage of electricity in final energy consumption rises from about 20% in 2018 to approximately 25% in 2040.
-
Rising Preference for Clean Energy - The development of alternative energy sources such as wind and solar is prioritized by about 68% of American adults over increasing the production of oil, coal, and natural gas.
-
Surge in Global Warming Owing to Carbon Emission - The total land and ocean temperature has risen at an average rate of 0.14 degrees Fahrenheit (0.08 degrees Celsius) every decade since 1880, according to NOAA's 2021 Annual Climate Report. However, the average growth rate since 1981 has risen more nearly twice as fast: 0.32 °F (0.18 °C) each decade.
-
Upsurge in Investment in Clean Energy - In 2022, global energy investment is expected to expand by about 7% to approximately USD 2 trillion, with clean energy expected to account for the majority of the increase.
Challenges
- Lack of Technical Expertise - More skilled individuals are required owing to the many technical constraints. In addition, the installation and adoption of modern manufacturing techniques to boost performance also add to the need for specialists and professionals. Hence, the market for solar photovoltaic (PV) mounting solutions would face significant challenges owing to a lack of technical skills.
- Extremely Fragmented Market
- Volatility of price
Solar PV Mounting Systems Market Size and Forecast:
| Report Attribute | Details |
|---|---|
|
Base Year |
2025 |
|
Forecast Period |
2026-2035 |
|
CAGR |
4.5% |
|
Base Year Market Size (2025) |
USD 15.54 billion |
|
Forecast Year Market Size (2035) |
USD 24.13 billion |
|
Regional Scope |
|
Solar PV Mounting Systems Market Segmentation:
End-user Segment Analysis
The utility segment is anticipated to hold largest share in the solar PV mounting systems market on account of rising number of high-income driven projects that requires deployment of efficient solar equipment with low operational costs. Along with these, growing investments from public and private institutions for energy targets is estimated to drive the segment growth. Global energy investment was projected to increase to about USD 2 trillion annually in 2021, up over 9% from 2020 and bringing overall investment levels back to pre-crisis levels.
Type Segment Analysis
The ground mounted segment is anticipated to garner the highest revenue by the end of 2035. The segment growth can be attributed to increasing installation of these type of photovoltaic structures in the recent years. Furthermore, ground-mounted solar for the utility sector offers simple upkeep and cleaning in addition to improved airflow for more efficient energy production as compared to roof-mounted solar. Ground-mounted solar panel demand is expected to increase as a result of the growing new facility construction associated with utility-scale solar projects, providing a potential opportunity for the market expansion.
Our in-depth analysis of the global market includes the following segments:
|
By Type |
|
|
By End User |
|
|
By Technology |
|

Vishnu Nair
Head - Global Business DevelopmentCustomize this report to your requirements — connect with our consultant for personalized insights and options.
Solar PV Mounting Systems Market Regional Analysis:
APAC Market Insights
Asia Pacific region is projected to account for more than 53.9% market share by 2035, backed by rising installation of solar panels in commercial and residential sectors, and favorable government initiatives regarding solar projects. For instance, solar photovoltaic energy capacity in India increased from almost 35,000 megawatts in 2019 to 39,000 megawatts in 2020.
Europe Market Insights
The market in Europe region is estimated to have a significant growth till 2035. The growth can be attributed to the high usage of sustainable energy resources in the region. Additionally, the focus on updating the area's deteriorating electrical infrastructure as well as the encouragement of power generation from renewable energy sources by the local governments will fuel the market expansion.
Solar PV Mounting Systems Market Players:
- K2 Systems GmbH
- Company Overview
- Business Strategy
- Key Product Offerings
- Financial Performance
- Key Performance Indicators
- Risk Analysis
- Recent Development
- Regional Presence
- SWOT Analysis
- Unirac, Inc.
- Schletter, Inc.
- Land Power Solar Technology Co. Ltd
- Quick Mount PV
- Mounting Systems, Inc.
- RBI Solar, Inc.
- Pennar Industries Limited
- Tata International Limited
- Nuevosol Energy Pvt. Ltd.
Recent Developments
-
Unirac, Inc. acquired Ecolibrium Solar, expanding their solar mounting offerings by adding Ecolibrium’s residential rail-less, commercial flat roof, and metal roof products to its product lines.
-
For one of India's biggest businesses in the distributed solar energy industry, Tata International Limited started an 18MW project in Rajasthan. A textile factory commissioned the project to meet their captive needs. The site team made sure the company's security and safety standards were upheld by working in a very organised manner.
- Report ID: 3176
- Published Date: Sep 08, 2025
- Report Format: PDF, PPT
- Explore a preview of key market trends and insights
- Review sample data tables and segment breakdowns
- Experience the quality of our visual data representations
- Evaluate our report structure and research methodology
- Get a glimpse of competitive landscape analysis
- Understand how regional forecasts are presented
- Assess the depth of company profiling and benchmarking
- Preview how actionable insights can support your strategy
Explore real data and analysis
Frequently Asked Questions (FAQ)
Solar PV Mounting Systems Market Report Scope
Free Sample includes current and historical market size, growth trends, regional charts & tables, company profiles, segment-wise forecasts, and more.
Connect with our Expert


Copyright @ 2026 Research Nester. All Rights Reserved.
